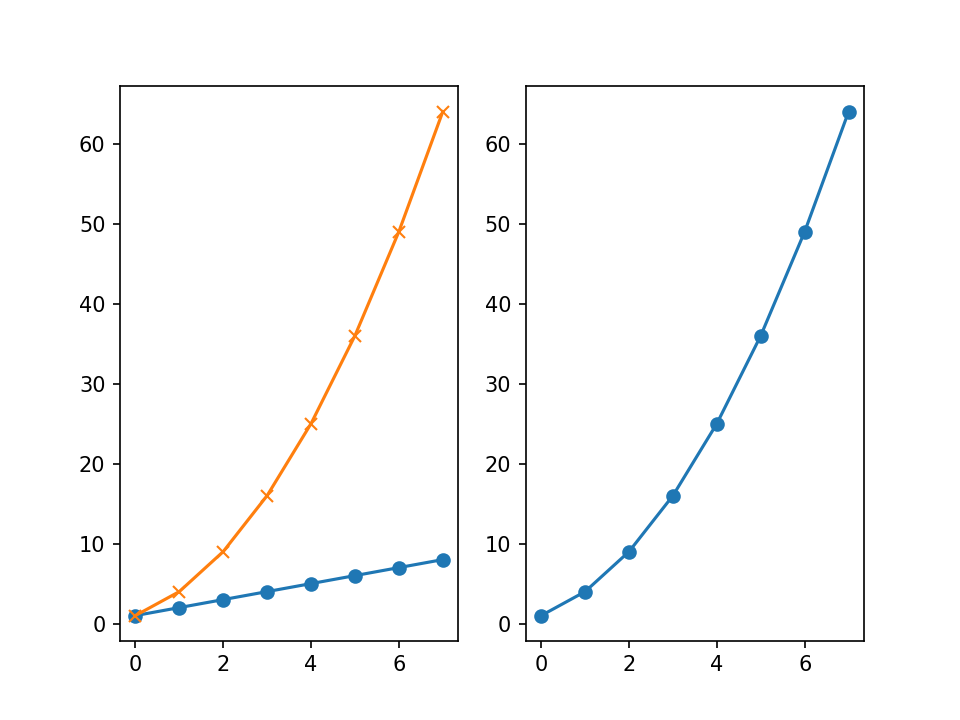
 1 %matplotlib notebook
 2
 3 import matplotlib.pyplot as plt
 4 import numpy as np
 5
 6 plt.subplot?
 7
 8 plt.figure()
 9 # 把图分成一行两列,当前为第一个图,即第一行第一列
10 plt.subplot(1, 2, 1)
11
12 linear_data = np.array([1,2,3,4,5,6,7,8])
13
14 plt.plot(linear_data, '-o')
15
16 exponential_data = linear_data**2
17
18 # 当前为第二个图,即第一行第二列
19 plt.subplot(1, 2, 2)
20 plt.plot(exponential_data, '-o')
21
22 # 画平方数据在第一张图中
23 plt.subplot(1, 2, 1)
24 plt.plot(exponential_data, '-x')
1 plt.figure()
2 #两边相等
3 plt.subplot(1,2,1) == plt.subplot(121)
True
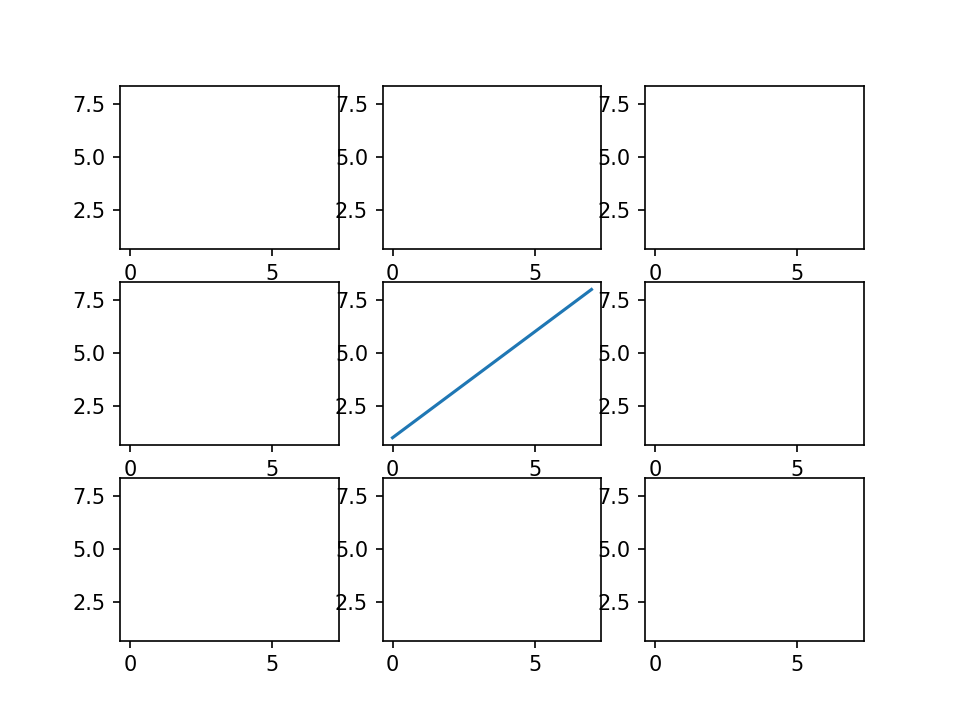
 1 # 创建3*3的图块
 2 fig, ((ax1,ax2,ax3), (ax4,ax5,ax6), (ax7,ax8,ax9)) = plt.subplots(3, 3, sharex=True, sharey=True)
 3 # 把线性数据画在第5张图中,即最中间的图
 4 ax5.plot(linear_data, '-')
 5
 6 # 把内部图标的横纵坐标标度都显示出来
 7 for ax in plt.gcf().get_axes():
 8     for label in ax.get_xticklabels() + ax.get_yticklabels():
 9         label.set_visible(True)
10
11 # 在一些系统中有必要使用这句话,来更新图像
12 plt.gcf().canvas.draw()