 1 import numpy as np
 2
 3 linear_data = np.array([1,2,3,4,5,6,7,8])
 4 exponential_data = linear_data**2
 5
 6 plt.figure()
 7 #画直线和平方后的线
 8 plt.plot(linear_data, '-o', exponential_data, '-o')
 9
10 #用红色虚线画另一组点
11 plt.plot([22,44,55], '--r')
12 #添加横纵坐标标注和图的标题
13 plt.xlabel('Some data')
14 plt.ylabel('Some other data')
15 plt.title('A title')
16 #用图例项添加图例,因为之前没有给线段定义labels
17 plt.legend(['Baseline', 'Competition', 'Us'])
18
19 #填充一次和两次线段之间的空间
20 plt.gca().fill_between(range(len(linear_data)),
21                        linear_data, exponential_data,
22                        facecolor='blue',
23                        alpha=0.25)
1 import pandas as pd
2
3 plt.figure()
4 observation_dates = np.arange('2017-01-01', '2017-01-09', dtype='datetime64[D]')
5 observation_dates = map(pd.to_datetime, observation_dates) # trying to plot a map will result in an error
6 plt.plot(observation_dates, linear_data, '-o',  observation_dates, exponential_data, '-o')
错误代码
TypeError: object of type 'map' has no len()
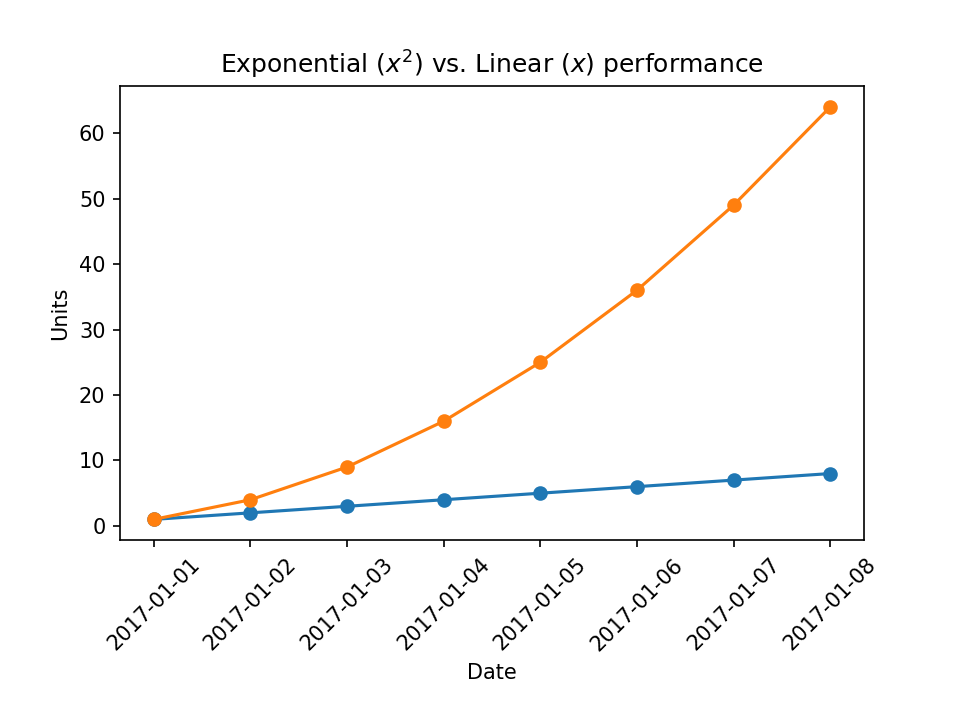
1 plt.figure()
2 observation_dates = np.arange('2017-01-01', '2017-01-09', dtype='datetime64[D]')
3 observation_dates = list(map(pd.to_datetime, observation_dates)) # 把map转换成list来避免错误
4 plt.plot(observation_dates, linear_data, '-o',  observation_dates, exponential_data, '-o')
 1 x = plt.gca().xaxis
 2
 3 # 因为日期太长导致横坐标相互遮盖,所以旋转横坐标值45°
 4 for item in x.get_ticklabels():
 5     item.set_rotation(45)
 6
 7 # 调整坐标系防止横坐标旋转部分被遮盖
 8 plt.subplots_adjust(bottom=0.25)
 9 #添加横纵坐标标注和图标标题
10 ax = plt.gca()
11 ax.set_xlabel('Date')
12 ax.set_ylabel('Units')
13 ax.set_title('Exponential vs. Linear performance')
14
15 #在文本用添加数学表达式
16 ax.set_title("Exponential ($x^2$) vs. Linear ($x$) performance")


