%matplotlib notebook提供一个交互的环境
1 %matplotlib notebook
1 import matplotlib as mpl
2 mpl.get_backend()
'nbAgg'
%plt.plot查询plot的帮助
1 import matplotlib.pyplot as plt
2 plt.plot?
1 #因为默认线的风格为'-'
2 #如果只进过一个点的话没有东西会被画出来
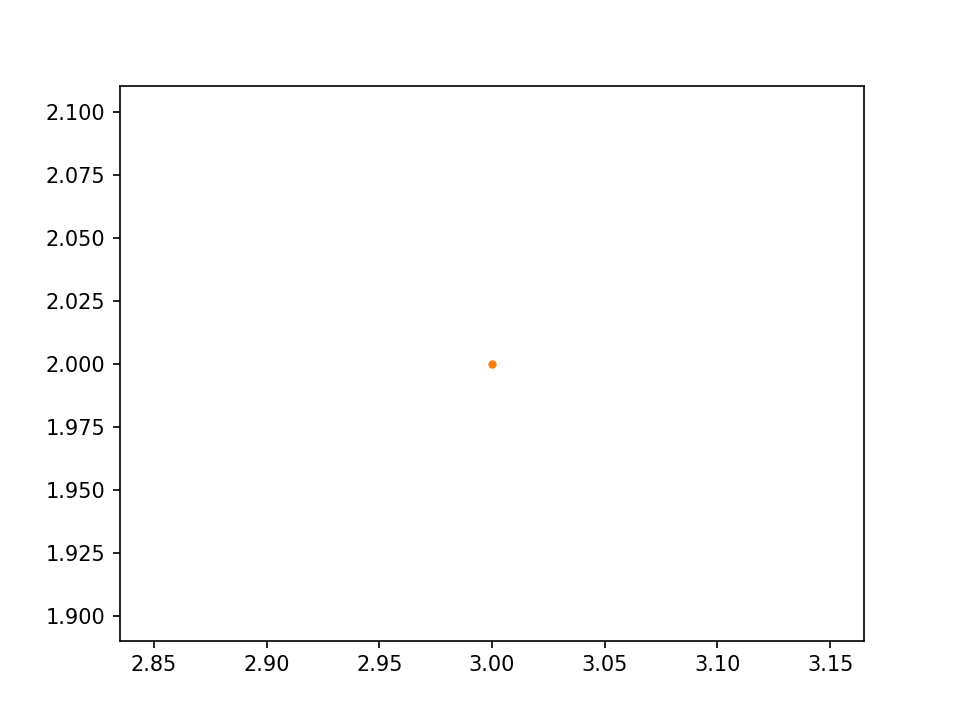
3 plt.plot(3, 2)

#使用'.'时可以显示
1 # we can pass in '.' to plt.plot to indicate that we want
2 # the point (3,2) to be indicated with a marker '.'
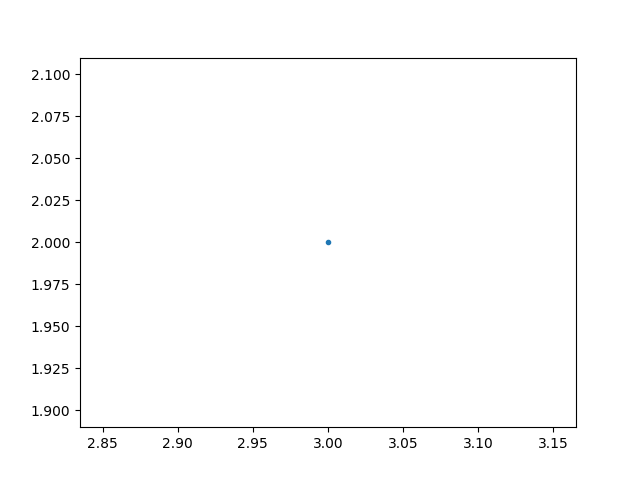
3 plt.plot(3, 2, '.')

 1 # First let's set the backend without using mpl.use() from the scripting layer
 2 from matplotlib.backends.backend_agg import FigureCanvasAgg
 3 from matplotlib.figure import Figure
 4
 5 # create a new figure
 6 fig = Figure()
 7
 8 # associate fig with the backend
 9 canvas = FigureCanvasAgg(fig)
10
11 # add a subplot to the fig
12 ax = fig.add_subplot(111)
13
14 # plot the point (3,2)
15 ax.plot(3, 2, '.')
16
17 # save the figure to test.png
18 # you can see this figure in your Jupyter workspace afterwards by going to
19 # https://hub.coursera-notebooks.org/
20 canvas.print_png('test.png')
%%html
<img src='test.png' />

ax.axis设置坐标边界
 1 # create a new figure
 2 plt.figure()
 3
 4 # plot the point (3,2) using the circle marker
 5 plt.plot(3, 2, 'o')
 6
 7 # get the current axes
 8 ax = plt.gca()
 9
10 # Set axis properties [xmin, xmax, ymin, ymax]
11 ax.axis([0,6,0,10])

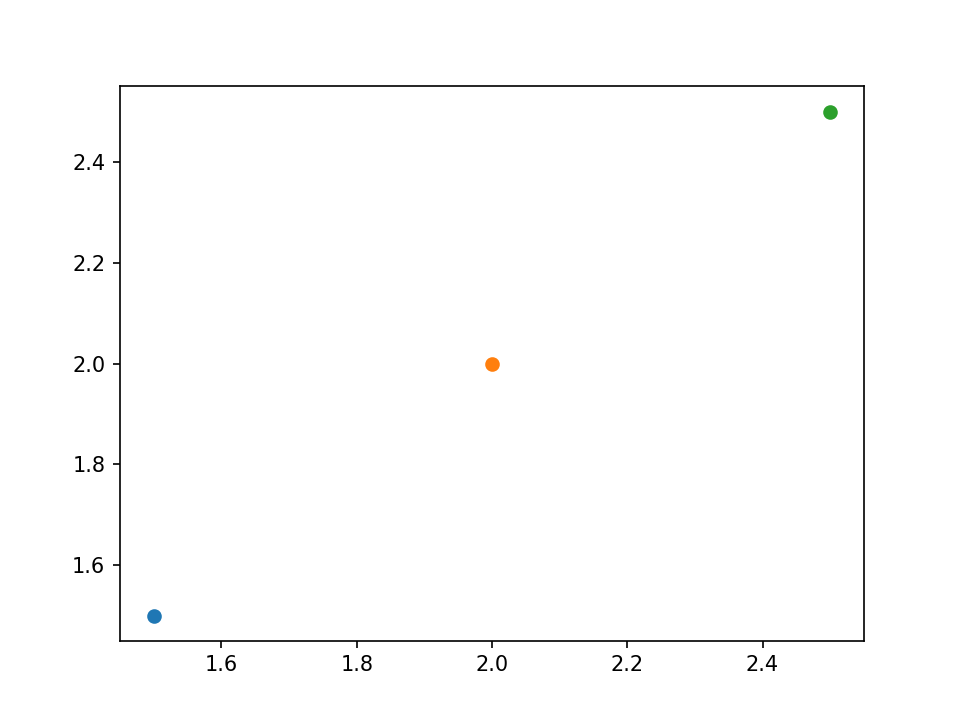
每次使用plt.plot画出来得颜色不同
1 # create a new figure
2 plt.figure()
3
4 # plot the point (1.5, 1.5) using the circle marker
5 plt.plot(1.5, 1.5, 'o')
6 # plot the point (2, 2) using the circle marker
7 plt.plot(2, 2, 'o')
8 # plot the point (2.5, 2.5) using the circle marker
9 plt.plot(2.5, 2.5, 'o')

1 # get current axes
2 ax = plt.gca()
3 # get all the child objects the axes contains
4 ax.get_children()


