
线性回归主要是拟合一个函数,能预测一个新的样本:
(1)数据集如下:
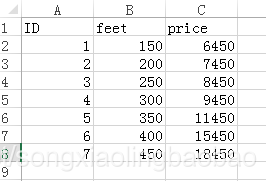
(2)预测值:feet=500
1 # -*- coding:utf-8 -*-
2 import matplotlib.pyplot as plt
3 import pandas as pd
4 from sklearn import linear_model
5 import os
6 os.chdir("/Users/xxx/PycharmProjects/dataset/")
7 filename = "input_data.xlsx"
8 datafile = pd.read_excel(filename, index_col=u'ID')
9 # 获取数据
10 def get_data(datafile):
11 x_paramter = []
12 y_paramter = []
13 for feet,price in zip(datafile['feet'],datafile['price']):
14 x_paramter.append([float(feet)])
15 y_paramter.append(float(price))
16 return x_paramter,y_paramter
17 # 线性回归模型
18 def linear_model_main(x_paramter,y_paramter,predict_value):
19 # 创建线性回归对象
20 regr = linear_model.LinearRegression()
21 regr.fit(x_paramter,y_paramter) # 建立模型
22 predict_outcome = regr.predict(predict_value) # 预测值
23 return regr.intercept_,regr.coef_,predict_outcome # 返回截距、斜率、预测结果
24 # 显示线性拟合模型的结果
25 def show_linear_line(x_paramter,y_paramter):
26 regr = linear_model.LinearRegression()
27 regr.fit(x_paramter,y_paramter)
28 plt.scatter(x_paramter,y_paramter,color="blue")
29 x_new = [[0],[500]] # x轴长
30 plt.plot(x_new,regr.predict(x_new),color="red",linewidth=2)
31 plt.xlabel(u'Feet',color="green")
32 plt.ylabel(u'Price',color="green")
33 # plt.plot(label=u'数据图')
34 # plt.xticks(())
35 # plt.yticks(())
36 plt.ylim(-2000,20000)
37 plt.xlim(0,500)
38 plt.show()
39 def main():
40 X,Y = get_data(datafile)
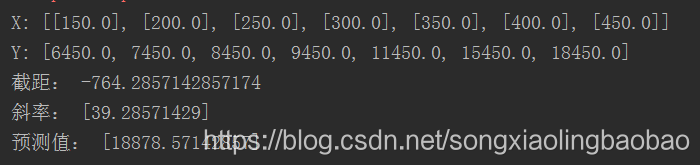
41 print('X:',X)
42 print('Y:',Y)
43 predictvalue = [[500]]
44 intercept,coefficient,predict_value = linear_model_main(X,Y,predictvalue)
45 print("截距:",intercept) # b ( y=ax+b )
46 print("斜率:",coefficient) # a
47 print("预测值:",predict_value) # y
48 show_linear_line(X,Y)
49 main()
(3)输出:
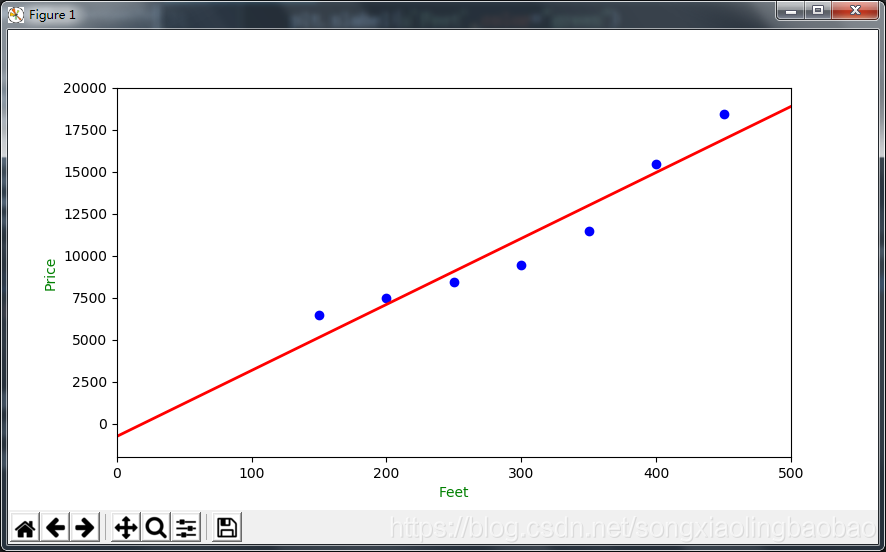
(4)样本以及拟合的直线

 浙公网安备 33010602011771号