简述
QCustomPlot是一个基于Qt C++的图形库,用于绘制和数据可视化 - 制作漂亮的2D图 - 曲线图、趋势图、坐标图、柱状图等,并为实时可视化应用程序提供高性能服务。它没有进一步的依赖关系,并有着良好的文档记录。
QCustomPlot可以导出为各种格式,比如:PDF文件和位图(如:PNG、JPG、BMP)。
可在自己的项目中直接使用两个源文件(qcustomplot.h与qcustomplot.cpp),或预先编译成库。


下载、配置和使用
下载
QCustomPlot首页:http://www.qcustomplot.com/
进入QCustomPlot下载页,下载最新的完整包(包含:源码、文档、示例)!
将下载好的安装包进行解压缩,里面包含文档、示例、更改日志、GPL授权、以及最重要的两个文件qcustomplot.h与qcustomplot.cpp。
配置
完整的API文档在complete API documentation上面,或者作为完整包的一部分,在解压缩后的目录中可以找到。里面包含一个HTML文档的层次结构和qch帮助文件用于QtCreator/Assistant集成。如果使用QtCreator或Assistant,应考虑使用qch文件,这将极大地提高工作效率!
集成到QtCreator/Assistant
集成qch文件相当简单:
- 复制qcustomplot.qch文件到你需要存储的地方(例如:本地QtCreator配置目录)。
- 在QtCreator中,选择:工具 -> 选项 -> 帮助 -> 文档,你会看到一个加载文档模块的列表,以及添加/删除模块的按钮。点击”添加…”按钮,选择qcustomplot.qch文件。
这样,我们就添加完成了。可以通过:帮助 -> 索引,来搜索QCustomPlot相关的类或函数。
当你把光标放在任何QCustomPlot相关的类或函数上时,按下F1键,就会有相应的文档项弹出,就像Qt组件一样。
使用
在examples中我们会看到一些自带的示例,可以运行看一下效果。
如果在自己的项目中使用,需要进行以下配置:
首先,在pro中需要添加(由于QCustomPlot中存在导出功能,使用了printsupport模块):
QT += printsupport
然后,将qcustomplot.h与qcustomplot.cpp拷贝到工程目录下,右键 -> 添加现有文件…,将这两个文件添加至工程。
在调用qcustomplot的地方,需要引入:
#include "qcustomplot.h"
创建一个qcustomplot对象。
QCustomPlot *pCustomPlot = new QCustomPlot(this);
QCustomPlot类
几个重要的类
- QCustomPlot图标类:用于图标的显示和交互
- QCPLayer图层:管理图层元素(QCPLayerable),所有可显示的对象都是继承自图层元素。
- QCPAbstractPlottable绘图元素:包含折线图(QCPGraph)、曲线图(QCPCurve)、柱状图(QCPBars)、QCPStatiBox(盒子图)、QCPColorMap(色谱图)、QCPFinancial(金融图)
- QCPAxisRect坐标轴矩形:一个坐标轴矩形默认包含上下左右四个坐标,但是可以添加多个坐标轴。
QCustomPlot类管理着所有图层,它本身自带6个图层,分别是:
- 背景图(background)
- 网格层(grid)
- 绘图层(main)
- 坐标轴层(axis)
- 图例层(legend)
- overlay层(overlay)
依据层的顺序不同,绘制的顺序也不同,越在底下的层越早绘制,当前层默认为绘图层main。
我们一般操作的都在绘图层,绘图层则在QCPAxisRect中,QCustomPlot类默认包含一个QCPAxisRect。下图中可以看到一个QCPAxisRect一般包含4个轴。

个性化外观
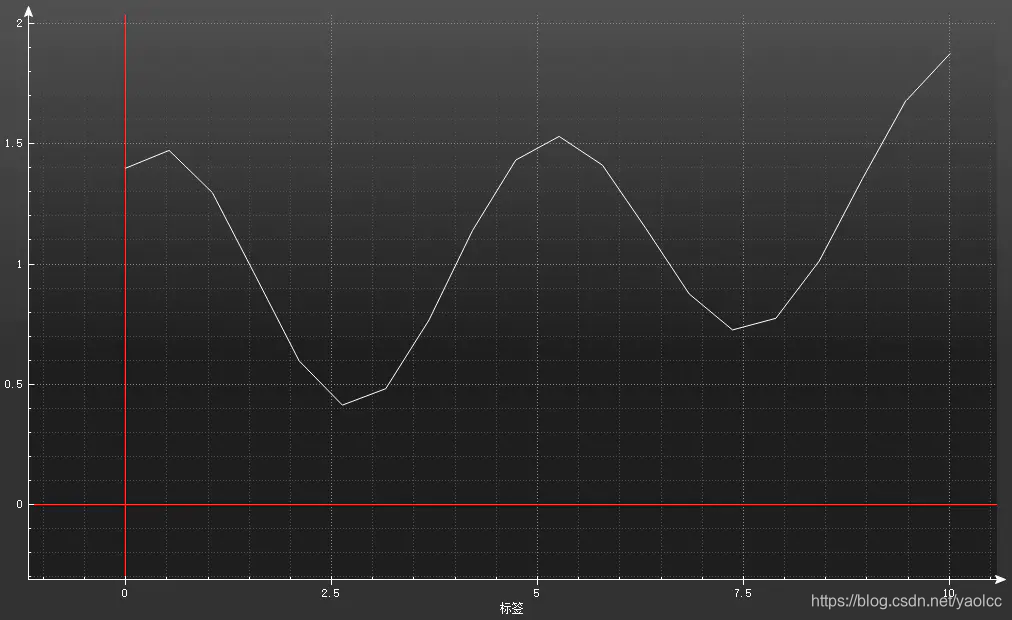
设置QCustomPlot的背景颜色
1 QLinearGradient plotGradient;
2 plotGradient.setStart(0, 0);
3 plotGradient.setFinalStop(0, 350);
4 plotGradient.setColorAt(0, QColor(80, 80, 80));
5 plotGradient.setColorAt(1, QColor(50, 50, 50));
6 customPlot->setBackground(plotGradient);   // 设置背景颜色

设置QCPAxisRect轴矩阵的背景颜色
1 QLinearGradient axisRectGradient;
2 axisRectGradient.setStart(0, 0);
3 axisRectGradient.setFinalStop(0, 350);
4 axisRectGradient.setColorAt(0, QColor(80, 80, 80));
5 axisRectGradient.setColorAt(1, QColor(30, 30, 30));
6 /* 设置QCPAxisRect背景颜色 */
7 customPlot->axisRect()->setBackground(axisRectGradient);

设置QCPGrid网格的风格
 1 /* 每条网格对应一个刻度 */
 2 /* 网格线(对应刻度)画笔 */
 3 customPlot->xAxis->grid()->setPen(QPen(QColor(140, 140, 140), 1, Qt::DotLine));
 4 customPlot->yAxis->grid()->setPen(QPen(QColor(140, 140, 140), 1, Qt::DotLine));
 5 /* 子网格线(对应子刻度)画笔 */
 6 customPlot->xAxis->grid()->setSubGridPen(QPen(QColor(80, 80, 80), 1, Qt::DotLine));
 7 customPlot->yAxis->grid()->setSubGridPen(QPen(QColor(80, 80, 80), 1, Qt::DotLine));
 8 /* 显示子网格线 */
 9 customPlot->xAxis->grid()->setSubGridVisible(true);
10 customPlot->yAxis->grid()->setSubGridVisible(true);
11 /* 设置刻度为0时的网格线的画笔 */
12 customPlot->xAxis->grid()->setZeroLinePen(QPen(Qt::red));
13 customPlot->yAxis->grid()->setZeroLinePen(QPen(Qt::red));

图表的风格
 1 QPen pen;
 2 QStringList lineNames;
 3 lineNames << "lsNone" << "lsLine" << "lsStepLeft" << "lsStepRight" << "lsStepCenter" << "lsImpulse";
 4 for (int i = QCPGraph::lsNone; i <= QCPGraph::lsImpulse; ++i)
 5 {
 6     customPlot->addGraph();
 7     pen.setColor(QColor(qSin(i*1+1.2)*80+80, qSin(i*0.3+0)*80+80, qSin(i*0.3+1.5)*80+80));
 8     customPlot->graph()->setPen(pen);
 9     // 设置图表的画笔
10     customPlot->graph()->setName(lineNames.at(i-QCPGraph::lsNone));
11     customPlot->graph()->setLineStyle((QCPGraph::LineStyle)i);
12     // 设置图表线段的风格
13     customPlot->graph()->setScatterStyle(QCPScatterStyle(QCPScatterStyle::ssCircle, 5));
14     // 设置图表散点图的样式,散点图的样式有很多种,可以自己试试
15     QVector<double> x(15), y(15);
16     for (int j=0; j<15; ++j)
17     {
18         x[j] = j/15.0 * 5*3.14 + 0.01;
19         y[j] = 7*qSin(x[j])/x[j] - (i-QCPGraph::lsNone)*5 + (QCPGraph::lsImpulse)*5 + 2;
20     }
21     customPlot->graph()->setData(x, y);
22     customPlot->graph()->rescaleAxes(true);
23 }

图表画刷
1 /* 第一种:与0刻度线围成区域 */
2 customPlot->addGraph();
3 customPlot->graph(0)->setPen(QPen(Qt::blue));
4 customPlot->graph(0)->setBrush(QBrush(QColor(0, 0, 255, 20)));
5 customPlot->addGraph();
6 customPlot->graph(1)->setPen(QPen(Qt::red));
7 /* 第二种方式:与其它图围成区域,使用的是图0的画刷 */
8 customPlot->graph(0)->setChannelFillGraph(customPlot->graph(1));
9 /* 将图0与图1围成区域 */

QCPAxis坐标系


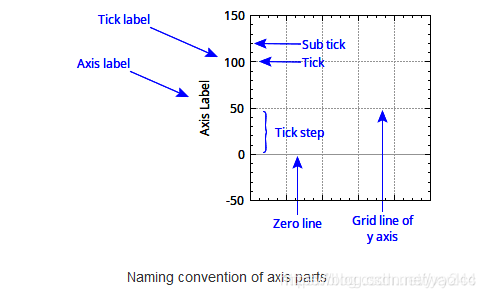
QCPAxis有四个成员变量,分别代表四个坐标轴:xAxis(下)、yAxis(左)、xAxis2(上)、yAxis2(右)。
坐标轴
默认只显示左y轴和下边的x轴,调用setVisible(bool)设置轴是否显示。
1 customplot->yAxis2->setVisible(true);//显示y轴2
2 customplot->xAxis2->setVisible(true);//显示x轴2
也可以设置一个完整的坐标Box,会直接显示四个轴。
customplot->axisRect()->setupFullAxesBox();//四边安装轴并显示
设置刻度
提供了设置坐标轴刻度、间距、范围等函数
 1 /* 设置坐标轴刻度间距 */
 2 setTickStep(double step);
 3 /* 设置坐标轴刻度表(将坐标轴刻度设置为vec) */
 4 setTickVector(const QVector<double> &vec);
 5 /* 一般刻度数量是自动调整的,但也可以手动设置,例如-100到100默认5个主刻度 */
 6 /* 可以设置成11个主刻度,注意有个刻度步进策略,如果默认是tssReadability,
 7 那么customplot有时仍会自动调整,使刻度便于阅读 */
 8 customplot->xAxis->ticker()->setTickCount(11);//11个主刻度
 9 customplot->xAxis->ticker()->setTickStepStrategy(QCPAxisTicker::tssReadability);
10 //可读性优于设置
设置标签
1 customPlot->xAxis->setLabel("x");
2 customPlot->yAxis->setLabel("y");
3 customplot->xAxis->setTickLabels(true);//显示刻度值
4 customplot->xAxis->setTickLabelSide(QCPAxis::LabelSide::lsInside);//显示在内部
5 /* 设置标签旋转角度(顺时针) */
6 customPlot->xAxis->setTickLabelRotation(30);
设置范围
1 customPlot->xAxis->setRange(-1, 1);
2 customPlot->yAxis->setRange(0, 1);
设置画笔
1 /* 轴线的画笔 */
2 customPlot->xAxis->setBasePen(QPen(Qt::white, 1));
3 /* 轴刻度线的画笔 */
4 customPlot->xAxis->setTickPen(QPen(Qt::white, 1));
5 /* 轴子刻度线的画笔 */
6 customPlot->xAxis->setSubTickPen(QPen(Qt::white, 1));
设置label字体颜色
1 /* 轴刻度文字颜色 */
2 customPlot->xAxis->setTickLabelColor(Qt::white);
3 /* 轴标签颜色 */
4 customPlot->xAxis->setLabelColor(Qt::white);
设置刻度长度
1 /* 轴线内刻度的长度 */
2 customPlot->xAxis->setTickLengthIn(3);
3 /* 轴线外刻度的长度 */
4 customPlot->xAxis->setTickLengthOut(5);
5 customplot->xAxis->setSubTickLengthIn(15);//子刻度向内延伸15
6 customplot->xAxis->setSubTickLengthOut(5);//子刻度向外延伸5
设置坐标轴线形状
1 /* 设置轴线结束时的风格为 实角三角形但内部有凹陷的形状,setLowerEnding设置轴线开始时的风格 */
2 customPlot->xAxis->setUpperEnding(QCPLineEnding::esSpikeArrow);
3 customplot->xAxis->setUpperEnding(QCPLineEnding::esSpikeArrow);//x轴终点箭头图案
4 customplot->xAxis->setLowerEnding(QCPLineEnding::esDisc);//x轴起点圆点图案
5 customplot->yAxis->setUpperEnding(QCPLineEnding::esSquare);//y轴终点小方块图案
设置刻度原点
有些需求要修改刻度显示的原点,例如原来是-10,-5,0,5,10,15,设置原点为1后变成-14,-9,-4,1,6,11,代码例子:
1 customplot->xAxis->setRange(-15,15);
2 customplot->xAxis->ticker()->setTickOrigin(1);//改变刻度原点为1
设置坐标轴位置
设置离外部和内部各50,代码例子:
1 customplot->xAxis->setPadding(50);//填充50的空间
2 customplot->xAxis->setOffset(50);//偏移50
设置上下轴、左右轴范围同步
利用rangeChanged信号传递轴范围QCPRange,范围改变时将xAxis的范围传给xAxis2,yAxis也是,就能实现轴范围同步了。
1 connect(customPlot->xAxis, SIGNAL(rangeChanged(QCPRange)), customPlot->xAxis2, SLOT(setRange(QCPRange)));
2 connect(customPlot->yAxis, SIGNAL(rangeChanged(QCPRange)), customPlot->yAxis2, SLOT(setRange(QCPRange)));
设置坐标轴为时间格式
1 QSharedPointer<QCPAxisTickerDateTime> dateTick(new QCPAxisTickerDateTime);
2 dateTick->setDateTimeFormat("yyyy-MM-dd hh:mm:ss:zzz");
3 customPlot->xAxis->setTicker(dateTick);
网格
设置画笔
1 /* 网格线(对应刻度)画笔 */
2 customPlot->xAxis->grid()->setPen(QPen(QColor(140, 140, 140), 1, Qt::DotLine));
3 customPlot->yAxis->grid()->setPen(QPen(QColor(140, 140, 140), 1, Qt::DotLine));
4 /* 子网格线(对应子刻度)画笔 */
5 customPlot->xAxis->grid()->setSubGridPen(QPen(QColor(80, 80, 80), 1, Qt::DotLine));
6 customPlot->yAxis->grid()->setSubGridPen(QPen(QColor(80, 80, 80), 1, Qt::DotLine));
7 /* 设置刻度为0时的网格线的画笔 */
8 customPlot->xAxis->grid()->setZeroLinePen(QPen(Qt::red));
9 customPlot->yAxis->grid()->setZeroLinePen(QPen(Qt::red));
设置子网络线
1 /* 显示子网格线 */
2 customPlot->xAxis->grid()->setSubGridVisible(true);
3 customPlot->yAxis->grid()->setSubGridVisible(true);
背景
设置背景
1 customplot->axisRect()->setBackground(QBrush(Qt::black));//背景黑色
2 customplot->axisRect()->setBackground(QPixmap(":/image/background.jpg"));//背景图片
设置背景属性
1 customplot->axisRect()->setBackgroundScaled(true);//启用背景缩放
2 customplot->axisRect()->setBackgroundScaledMode(Qt::AspectRatioMode::IgnoreAspectRatio);//自由缩放
缩放模式类型和效果

其他设置
设置自动调整范围
设置自动调整范围后,可以使全部数据可见。调用rescaleAxes (bool onlyEnlarge = false)函数,将重新调整与此绘图表关联的键和值轴,以显示所有的数据。
onlyEnlarge 默认false,表示范围可以缩小放大,如果为true表示只能放大,而不会缩小范围。
因为如果有多个曲线,第一个曲线调用rescaleAxes ()函数后,整个坐标轴的范围被缩小,曲线正好占满整个区域,但是如果其他曲线再次调用了rescaleAxes ()函数,如果范围缩小就可能导致数据无法显示,所以后面的曲线要设置参数为true,区域不会被缩小。最终能显示所有曲线的数据。
1 // 让范围自行缩放,使图0完全适合于可见区域:
2 customPlot->graph(0)->rescaleAxes();
3 // 图1也是一样自动调整范围,但只是放大或不变范围
4 customPlot->graph(1)->rescaleAxes(true);
5 // 图2也是一样自动调整范围,但只是放大或不变范围
6 customPlot->graph(2)->rescaleAxes(true);
7 // 图3也是一样自动调整范围,但只是放大或不变范围
8 customPlot->graph(2)->rescaleAxes(true);
设置坐标轴缩放比例
QCustomPlot模式对坐标系的x轴和y轴都是一起缩放的,用时候用起来不方便,有时候需要单独对x轴或者y轴进行缩放。
方法1:修改缩放比例
QCustomPlot给我们提供了setRangeZoomFactor()函数,设置区域放大因子。这样就可以实现单个轴放大缩小比例。
ui->customPlot->axisRect()->setRangeZoomFactor(1.2,1);//x方向为1.2 y为1 是不改变。
方法2:QCustomPlot自己提供的函数设置
 1 void MainWindow::wheelEvent(QWheelEvent *event)
 2 {
 3     static int i=0;
 4     i++;
 5     if (ui->customPlot->xAxis->selectedParts().testFlag(QCPAxis::spAxis))
 6     {
 7         qDebug("%d",i);
 8         ui->customPlot->axisRect()->setRangeZoom(ui->customPlot->xAxis->orientation());
 9         // ui->customPlot->axisRect()->setRangeZoomFactor(1.2,1);//x方向为1.2
10     }
11     else if (ui->customPlot->yAxis->selectedParts().testFlag(QCPAxis::spAxis))
12     {
13         ui->customPlot->axisRect()->setRangeZoom(ui->customPlot->yAxis->orientation());
14         // ui->customPlot->axisRect()->setRangeZoomFactor(1.2,1);//x方向为1.2
15     }
16     else
17         ui->customPlot->axisRect()->setRangeZoom(Qt::Horizontal|Qt::Vertical);
18 }
设置坐标系的操作属性
1 //设置基本坐标轴(左侧Y轴和下方X轴)可拖动、可缩放、曲线可选、legend可选、设置伸缩比例,使所有图例可见
2 CustomPlot->setInteractions(QCP::iRangeDrag|QCP::iRangeZoom| QCP::iSelectAxes |
3 QCP::iSelectLegend | QCP::iSelectPlottables);
画图类
QCustomPlot 提供了多个画图类
QCPCurve:与QCPGraph 类似,差别在于它是用于展示参数化曲线,可以有循环。
QCPBars:柱形图,如果有多个QCPBars ,可以依次重叠。
QCPStatisticalBox、QCPColorMap、QCPFinancial。与QCPGraph 不同的是,这些画图类在添加到QCustomPlot 的时候需要使用new创建一个实例,而不能直接。
QCPGraph类
添加曲线
每一条曲线相当于一个图层,需要调用qcustomplot来添加。
1 //向绘图区域QCustomPlot添加一条曲线
2 QCPGraph *pGraph = pCustomPlot->addGraph();
给曲线添加数据
添加图层后,可以用qcustomplot的graph(编号)来获取图层对象,或者直接拿到图层指针。编号按照添加的顺序寻址。
customPlot->graph(0)->setData(x, y);
设置图层名称
customPlot->graph(0)->setName("第一个示例"); // 设置曲线图的名字
设置图层(曲线)画笔
QCPGraph::setPen(const QPen &pen);
设置图层(曲线)风格
QCPGraph::setLineStyle(LineStyle ls);
设置曲线形状
曲线形状有“*、+、x、o”等
QCPGraph::setScatterStyle(QCPScatterStyle &style);
设置曲线填充方式
给graph设置brush后,会自动填充曲线和x轴之间的空间。
QCPGraph::setBrush(const QBrush &brush); /* 移除填充 */
QCPGraph::setBrush(Qt::NoBrush);
如果想设置两条曲线之间填充的颜色
/* 设置与某之间曲线填充 */
QCPGraph::setChannelFillGraph(otherGraph);
图例
显示图例
customPlot->legend->setVisible(true); // 显示图例
添加完数据,记得重画图像
customPlot->replot();
 1 #include "qcustomplot.h" MainWindow::MainWindow(QWidget *parent)   : CustomWindow(parent)
 2 {
 3     ...
 4     QCustomPlot *pCustomPlot = new QCustomPlot(this);
 5     pCustomPlot->resize(300, 300);       // 可变数组存放绘图的坐标的数据,分别存放x和y坐标的数据,101为数据长度
 6     QVector<double> x(101), y(101);       // 添加数据,这里演示y = x^3,为了正负对称,x从-10到+10
 7     for (int i = 0; i < 101; ++i)
 8     {
 9         x[i] = i/5 - 10;
10         y[i] = qPow(x[i], 3); // x的y次方;
11     }
12     // 向绘图区域QCustomPlot添加一条曲线
13     QCPGraph *pGraph = pCustomPlot->addGraph();
14     // 添加数据
15     pCustomPlot->graph(0)->setData(x, y);
16     // 设置坐标轴名称
17     pCustomPlot->xAxis->setLabel("x");
18     pCustomPlot->yAxis->setLabel("y");
19     // 设置背景色
20     pCustomPlot->setBackground(QColor(50, 50, 50));
21     pGraph->setPen(QPen(QColor(32, 178, 170)));
22     // 设置x/y轴文本色、轴线色、字体等
23     pCustomPlot->xAxis->setTickLabelColor(Qt::white);
24     pCustomPlot->xAxis->setLabelColor(QColor(0, 160, 230));
25     pCustomPlot->xAxis->setBasePen(QPen(QColor(32, 178, 170)));
26     pCustomPlot->xAxis->setTickPen(QPen(QColor(128, 0, 255)));
27     pCustomPlot->xAxis->setSubTickPen(QColor(255, 165, 0));
28     QFont xFont = pCustomPlot->xAxis->labelFont();
29     xFont.setPixelSize(20);
30     pCustomPlot->xAxis->setLabelFont(xFont);
31     pCustomPlot->yAxis->setTickLabelColor(Qt::white);
32     pCustomPlot->yAxis->setLabelColor(QColor(0, 160, 230));
33     pCustomPlot->yAxis->setBasePen(QPen(QColor(32, 178, 170)));
34     pCustomPlot->yAxis->setTickPen(QPen(QColor(128, 0, 255)));
35     pCustomPlot->yAxis->setSubTickPen(QColor(255, 165, 0));
36     QFont yFont = pCustomPlot->yAxis->labelFont();
37     yFont.setPixelSize(20);
38     pCustomPlot->yAxis->setLabelFont(yFont);
39     // 设置坐标轴显示范围,否则只能看到默认范围
40     pCustomPlot->xAxis->setRange(-11, 11);
41     pCustomPlot->yAxis->setRange(-1100, 1100);
42     ...
43 }
如果需要导出,我们可以调用对应的save…接口。
例如,导出一张为PNG格式,宽度、宽度分别为400px、300px的图片:
pCustomPlot->savePng("customPlot.png", 400, 300);
QCPGraph
用这个类来添加一个图层
 1 /* 增加图层 */
 2 QCPGraph *graphTemp = pCustomPlot->addGraph();
 3 /* 设置画笔 */
 4 graphTemp->setPen(QPen(Qt::red));
 5 /* 设置画刷,曲线和x轴围成的面积颜色 */
 6 graphTemp->setBrush(QBrush(QColor(100,0,205,50)));
 7 graphTemp->setAntialiasedFill(false);
 8 // 设置图层反锯齿:关闭
 9 graphTemp->setLineStyle(QCPGraph::lsLine);
10 graphTemp->setScatterStyle(QCPScatterStyle::ssDisc);
11 // 设置点的形状
12 /* 设置图层名称 */
13 graphTemp->setName("实时电流曲线");
14 /* 传入数据,数据类型为double */
15 graphTemp->setData(x, y);
方案解决
实现横坐标为日期时间
因为曲线轴设置的坐标只能为double型数据,需要将时间转换为double。就需要我们将字符串型的时间数据转换为double型的秒数。需要先将字符串转换为QDateTime,然后再使用totime_t()转换成距离1970年的秒数储存到数组。

