
首先添加引用System.Windows.Forms.DataVisualization,添加引用后,工具面板上将在数据中显示Chart,可直接拖拽到界面上。
代码中添加UsingSystem.Windows.Forms.DataVisualization.Charting;

1. 当拖拽Chart到界面上时,一般来说Chart及其ChartAreas、Legend部分的背景为白色,我们可以分别通过各自的BackColor设置为透明或其他颜色。
通过设置Series的ChartType属性来选择图表类型,一般常用:折线Line,柱状图Column,饼状图Pie,雷达图Redar等等。

 1  2. 设置ChartAreas属性
 2  1 ct.ChartAreas.Add(new ChartArea() { Name = "ca1" }); //背景框
 3  2 ct.ChartAreas[0].Axes[0].MajorGrid.Enabled = false; //X轴上网格
 4  3 ct.ChartAreas[0].Axes[1].MajorGrid.Enabled = false; //y轴上网格
 5  4 ct.ChartAreas[0].Axes[0].MajorGrid.LineDashStyle = ChartDashStyle.Dash; //网格类型 短横线
 6  5 ct.ChartAreas[0].Axes[0].MajorGrid.LineColor = Color.Gray;
 7  6 ct.ChartAreas[0].Axes[0].MajorTickMark.Enabled = false; // x轴上突出的小点
 8  7 ct.ChartAreas[0].Axes[1].MajorTickMark.Enabled = false; //
 9  8 ct.ChartAreas[0].Axes[1].IsInterlaced = true; //显示交错带
10  9 ct.ChartAreas[0].Axes[0].LabelStyle.Format = "#年"; //设置X轴显示样式
11 10 ct.ChartAreas[0].Axes[1].MajorGrid.LineDashStyle = ChartDashStyle.Dash; //网格类型 短横线
12 11 ct.ChartAreas[0].Axes[1].MajorGrid.LineColor = Color.Blue;
13 12 ct.ChartAreas[0].Axes[1].MajorGrid.LineWidth = 3;
14 13
15 14 ct.ChartAreas[0].BackColor = System.Drawing.Color.Transparent; //设置区域内背景透明
16 15
17 16 3. 设置值Series
18 17
19 18 //添加的两组Test数据
20 19 List<int> txData2 = new List<int>() { 2011, 2012, 2013, 2014, 2015, 2016 };
21 20 List<int> tyData2 = new List<int>() { 9, 6, 7, 4, 5, 4 };
22 21 List<int> txData3 = new List<int>() { 2012 };
23 22 List<int> tyData3 = new List<int>() { 7 };
24 23
25 24 ct.Series.Add(new Series()); //添加一个图表序列
26 25 // ct.Series[0].XValueType = ChartValueType.String; //设置X轴上的值类型
27 26 ct.Series[0].Label = "#VAL"; //设置显示X Y的值
28 27 ct.Series[0].ToolTip = "#VALX年\r#VAL"; //鼠标移动到对应点显示数值
29 28 ct.Series[0].ChartArea = ct.ChartAreas[0].Name; //设置图表背景框ChartArea
30 29 ct.Series[0].ChartType = SeriesChartType.Line; //图类型(折线)
31 30 ct.Series[0].Points.DataBindXY(txData2, tyData2); //添加数据
32 31 //折线段配置
33 32 ct.Series[0].Color = Color.Red; //线条颜色
34 33 ct.Series[0].BorderWidth = 3; //线条粗细
35 34 ct.Series[0].MarkerBorderColor = Color.Red; //标记点边框颜色
36 35 ct.Series[0].MarkerBorderWidth = 3; //标记点边框大小
37 36 ct.Series[0].MarkerColor = Color.Red; //标记点中心颜色
38 37 ct.Series[0].MarkerSize = 5; //标记点大小
39 38 ct.Series[0].MarkerStyle = MarkerStyle.Circle; //标记点类型
40 39
41 40 ct.Series.Add(new Series()); //添加一个图表序列
42 41 ct.Series[1].Label = "#VAL"; //设置显示X Y的值
43 42 ct.Series[1].ToolTip = "#VALX年\r#VAL"; //鼠标移动到对应点显示数值
44 43 ct.Series[1].ChartArea = "ca1";        //选择显示的ChartArea ,如果和其他的Series选择是同一个ChartArea,则在同一个区域中显示对比
45 44 ct.Series[1].ChartType = SeriesChartType.Line; //图类型(折线)
46 45 ct.Series[1].Points.DataBindXY(txData3, tyData3); //添加数据
47 46 //折线段配置
48 47 ct.Series[1].Color = Color.Black; //线条颜色
49 48 ct.Series[1].BorderWidth = 3; //线条粗细
50 49 ct.Series[1].MarkerBorderColor = Color.Black; //标记点边框颜色
51 50 ct.Series[1].MarkerBorderWidth = 3; //标记点边框大小
52 51 ct.Series[1].MarkerColor = Color.Black; //标记点中心颜色
53 52 ct.Series[1].MarkerSize = 5; //标记点大小
54 53 ct.Series[1].MarkerStyle = MarkerStyle.Circle; //标记点类型
55 54
56 55 4.其他ChartType的特殊设置
57 56
58 57 //饼图说明设置,这用来设置饼图每一块的信息显示在什么地方
59 58 ct.Series[0]["PieLabelStyle"] = "Outside";//将文字移到外侧
60 59 ct.Series[0]["PieLineColor"] = "Black";//绘制黑色的连线。
61 60 //柱状图其他设置
62 61 ct.Series[0]["DrawingStyle"] = "Emboss"; //设置柱状平面形状
63 62 ct.Series[0]["PointWidth"] = "0.5"; //设置柱状大小
5. 几种ChartType展示
 |
 |
 |
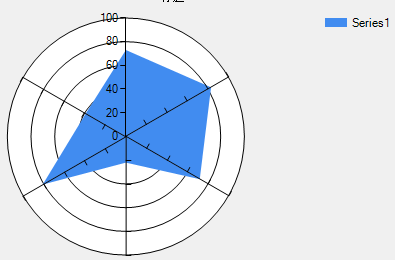 |
| 折线图-Line | 柱状图-Column | 饼状图-Pie | 雷达图-Redar |
 |
 |
 |
|
| Spline | Bar | Doughnut |


【推荐】编程新体验,更懂你的AI,立即体验豆包MarsCode编程助手
【推荐】抖音旗下AI助手豆包,你的智能百科全书,全免费不限次数
【推荐】轻量又高性能的 SSH 工具 IShell:AI 加持,快人一步
· 浏览器原生「磁吸」效果!Anchor Positioning 锚点定位神器解析
· 没有源码,如何修改代码逻辑?
· 一个奇形怪状的面试题:Bean中的CHM要不要加volatile?
· [.NET]调用本地 Deepseek 模型
· 一个费力不讨好的项目,让我损失了近一半的绩效!
· 全网最简单!3分钟用满血DeepSeek R1开发一款AI智能客服,零代码轻松接入微信、公众号、小程
· .NET 10 首个预览版发布,跨平台开发与性能全面提升
· 《HelloGitHub》第 107 期
· 全程使用 AI 从 0 到 1 写了个小工具
· 从文本到图像:SSE 如何助力 AI 内容实时呈现?(Typescript篇)