


1.监控程序环境准备

mkdir /data/docker-compose -p
cd /data/docker-compose

cat > docker-compose.yaml <<"EOF"
version: '3'
services:
  redis:
    image: redis:5
    container_name: redis
    command: redis-server --requirepass 123456 --maxmemory 512mb
    restart: always
    volumes:
      - /data/redis/data:/data
    ports:
      - 6379:6379
  nginx:
    image: nginx:1.21.6
    container_name: nginx
    restart: always
    volumes:
      - /data/nginx/conf.d:/etc/nginx/conf.d
      - /data/nginx/html:/usr/share/nginx/html
      - /data/nginx/log:/var/log/nginx
    ports:
      - 80:80
  rabbitmq:
    image: rabbitmq:3.7.15-management
    container_name: rabbitmq
    restart: always
    volumes:
      - /data/rabbitmq/data:/var/lib/rabbitmq
      - /data/rabbitmq/log:/var/log/rabbitmq
    ports:
      - 5672:5672
      - 15672:15672
  mongo:
    image: mongo:4.2.5
    container_name: mongo
    restart: always
    volumes:
      - /data/mongo/db:/data/db
    ports:
      - 27017:27017
    command: [--auth]
    environment:
      MONGO_INITDB_ROOT_USERNAME: root
      MONGO_INITDB_ROOT_PASSWORD: 123456
EOF
2.nginx监控
2.1 nginx配置conf文件
# 1.创建nginx目录
mkdir /data/nginx/conf.d -p
cd /data/nginx/conf.d

# 2.创建nginx.conf配置文件
cat >>server.conf<< "EOF"
server {
    listen       80;
    server_name  localhost;

    location / {
        root   /usr/share/nginx/html;
        index  index.html index.htm;
    }

    error_page   500 502 503 504  /50x.html;
    location = /50x.html {
        root   /usr/share/nginx/html;
    }
}
EOF
nginx开启tub_status
- 注 监控nginx需要with-http_stub_status_module
检查是否安装有with-http_stub_status_module模块
[root@test docker-compose]#  docker exec -it nginx nginx -V 2>&1 | grep -o with-http_stub_status_module
with-http_stub_status_module
nginx开启stub_status配置:
vim server.conf
    server_name  localhost;
# 新增以下配置
    location /stub_status {
        stub_status on;
        access_log off;
        #allow nginx_export的ip;
        allow 0.0.0.0/0;
        deny all;
    }

# 重新加载配置
docker exec -it nginx nginx -s reload
# 检查
[root@test nginx]# curl http://192.168.10.100/stub_status
Active connections: 1
server accepts handled requests
 1 1 1
Reading: 0 Writing: 1 Waiting: 0


参数解释:
● Active connections -- 活动连接数
accepts -- 接收请求数
handled -- 成功处理请求数
requests -- 总请求数
reding -- 正在进行读操作的请求数
writing -- 正在进行写操作的请求数
waiting -- 正在等待的请求数
2.2 nginx_exporter二进制监控安装
# 下载并解压
mkdir -p /opt/prometheus/nginx-prometheus
cd /opt/prometheus/nginx-prometheus
wget https://github.com/nginxinc/nginx-prometheus-exporter/releases/download/v1.1.0/nginx-prometheus-exporter_1.1.0_linux_amd64.tar.gz

tar -xzvf nginx-prometheus-exporter_1.1.0_linux_amd64.tar.gz

# 创建用户
useradd -M -s /usr/sbin/nologin prometheus

# 更改exporter文件夹权限
chown prometheus:prometheus -R /opt/prometheus

# 创建服务
cat > /etc/systemd/system/nginx_exporter.service <<"EOF"
[Unit]
Description=nginx-prometheus-exporter
After=network.target

[Service]
Type=simple
User=prometheus
Group=prometheus
Restart=always
ExecStart=/opt/prometheus/nginx_exporter/nginx-prometheus-exporter -nginx.scrape-uri=http://192.168.11.62/stub_status

[Install]
WantedBy=multi-user.target
EOF

# 启动服务
systemctl daemon-reload
systemctl start nginx_exporter.service
systemctl enable nginx_exporter.service
2.2.1 docker-compose方式安装nginx_exporter
cd /data/nginx

cat >docker-compose.yaml <<EOF
version: '3.3'
services:
  nginx_exporter:
    image: nginx/nginx-prometheus-exporter:0.11
    container_name: nginx_exporter
    hostname: nginx_exporter
    command:
     - '-nginx.scrape-uri=http://192.168.10.100/stub_status'
    restart: always
    ports:
    - "9113:9113"
EOF

# 启动
docker-compose up -d

# 参数解释
-nginx.scrape-uri    nginx stub_status 复制
2.3 Prometheus配置
配置prometheus去采集(拉取)nginx_exporter的监控样本数据
cd /data/docker-prometheus

#在scrape_configs(搜刮配置):下面增加如下配置:

cat >> prometheus/prometheus.yml << "EOF"
  - job_name: 'nginx_exporter'
    static_configs:
    - targets: ['192.168.11.62:9113']
      labels:
        instance: test服务器
EOF

# 重载配置
curl -X POST http://localhost:9090/-/reload
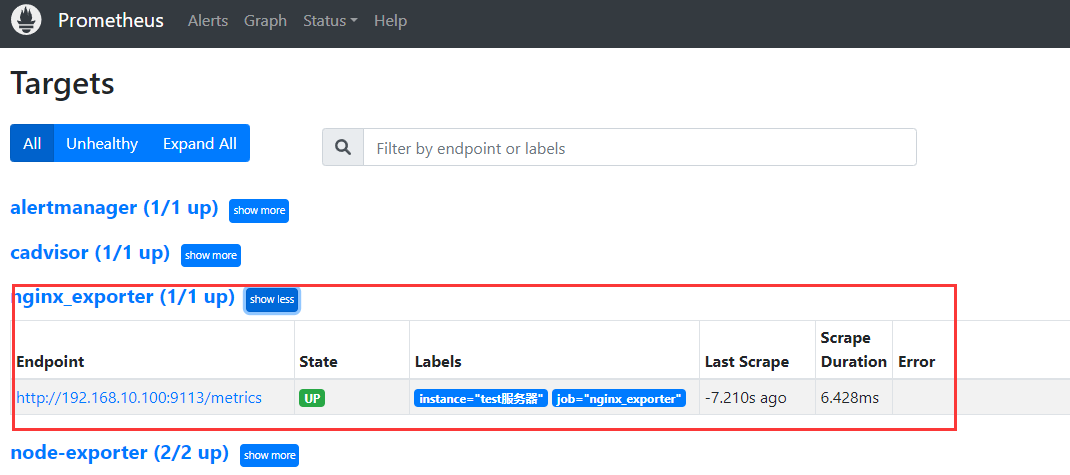
检查:
2.4 常用的监控指标
nginx_connections_accepted  接收请求数
nginx_connections_active    活动连接数
nginx_connections_handled   成功处理请求数
nginx_connections_reding    正在进行读操作的请求数
nginx_connections_waiting   正在等待的请求数
nginx_connections_writing   正在进行写操作的请求数
nginx_connections_requests  总请求数
2.5 添加触发器
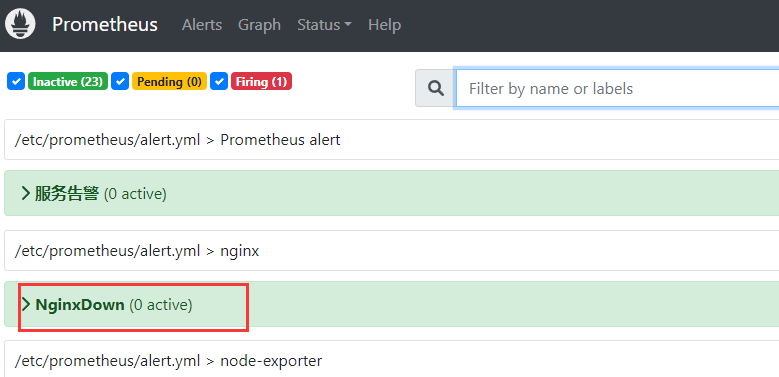
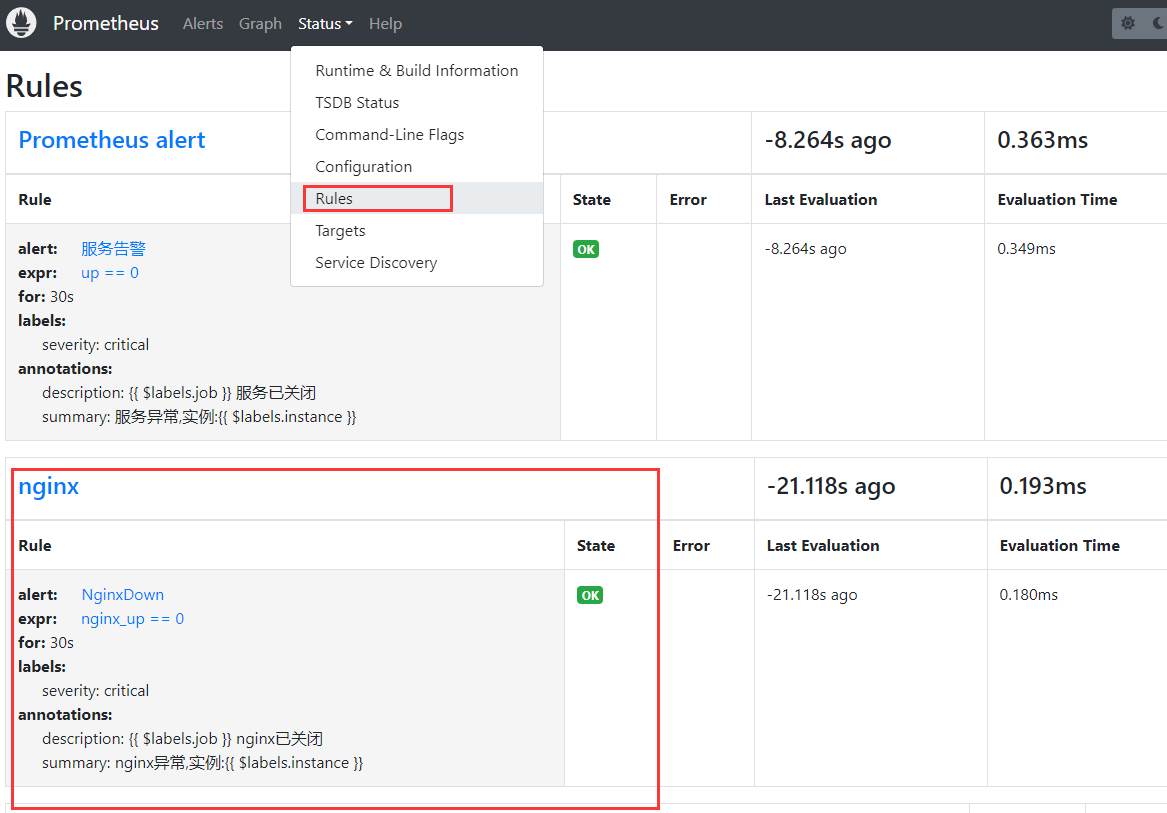
# 添加触发器
cd /data/docker-prometheus
cat >>prometheus/alert.yml <<"EOF"
- name: nginx
  rules:
  # 对任何实例超过30秒无法联系的情况发出警报
  - alert: NginxDown
    expr: nginx_up == 0
    for: 30s
    labels:
      severity: critical
    annotations:
      summary: "nginx异常,实例:{{ $labels.instance }}"
      description: "{{ $labels.job }} nginx已关闭"
EOF

# 检查配置:
docker exec -it prometheus promtool check config /etc/prometheus/prometheus.yml

# 重载配置
curl -X POST http://localhost:9090/-/reload
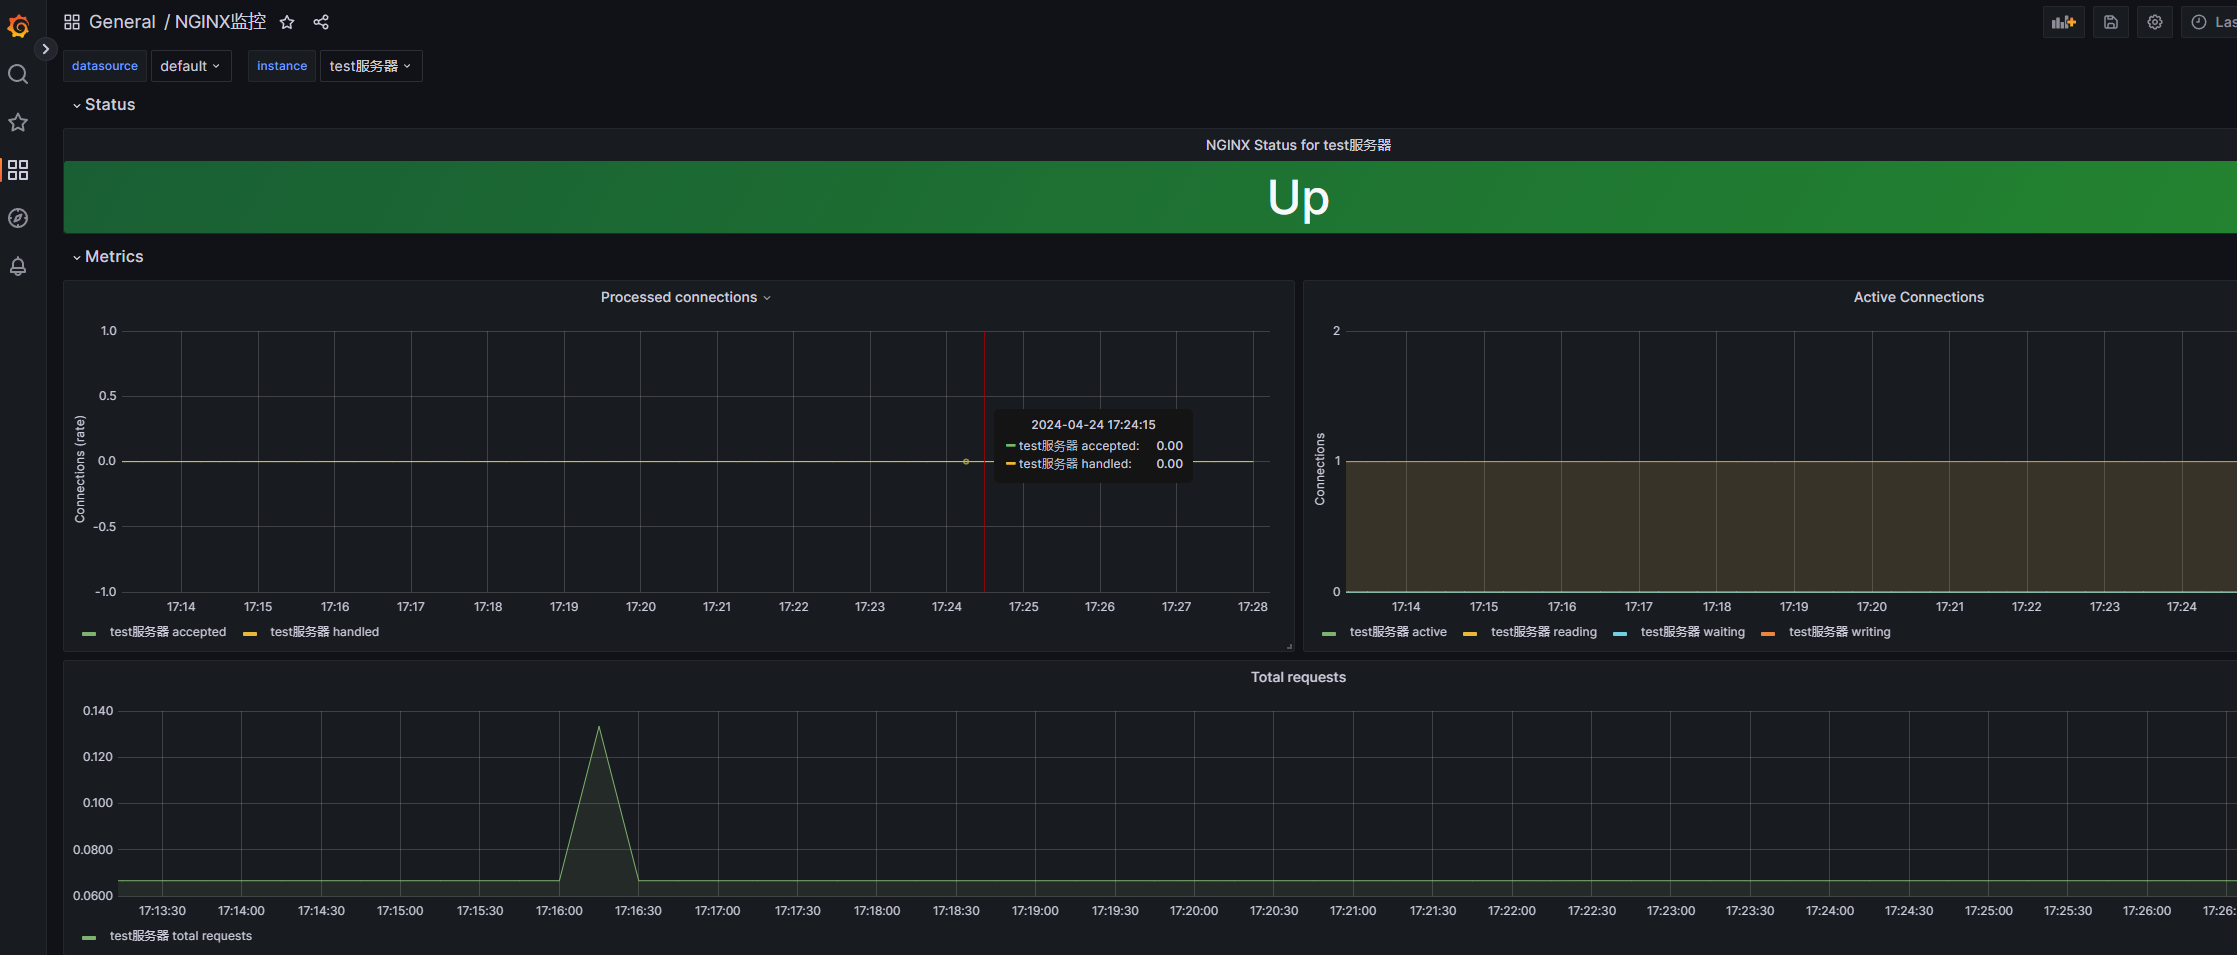
2.6 展示数据
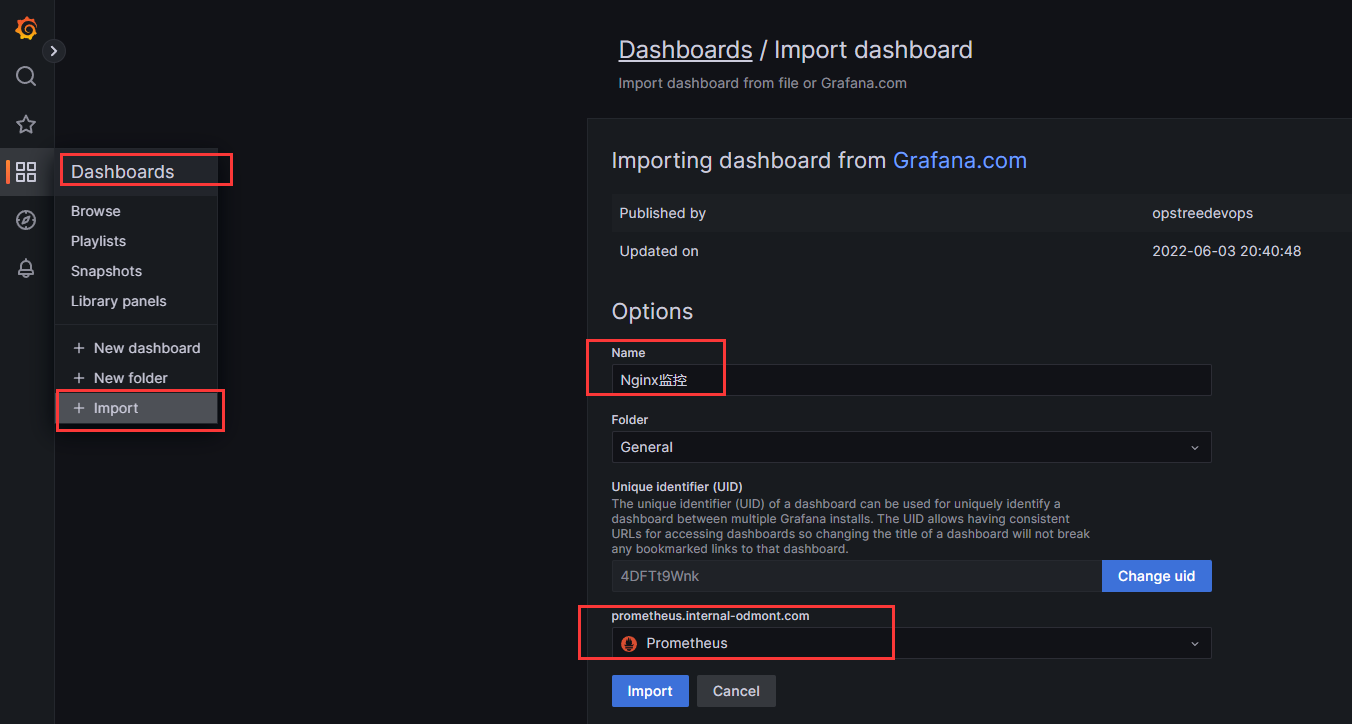
grafana展示prometheus从nginx_exporter收集到的数据
nginx vtx:2949
https://grafana.com/grafana/dashboards/12708
或者 https://grafana.com/grafana/dashboards/14900-nginx/
分类:
监控


【推荐】国内首个AI IDE,深度理解中文开发场景,立即下载体验Trae
【推荐】编程新体验,更懂你的AI,立即体验豆包MarsCode编程助手
【推荐】抖音旗下AI助手豆包,你的智能百科全书,全免费不限次数
【推荐】轻量又高性能的 SSH 工具 IShell:AI 加持,快人一步
· 被坑几百块钱后,我竟然真的恢复了删除的微信聊天记录!
· 没有Manus邀请码?试试免邀请码的MGX或者开源的OpenManus吧
· 【自荐】一款简洁、开源的在线白板工具 Drawnix
· 园子的第一款AI主题卫衣上架——"HELLO! HOW CAN I ASSIST YOU TODAY
· Docker 太简单,K8s 太复杂?w7panel 让容器管理更轻松!
2019-04-24 三元表达式、列表推导式、生成器表达式、递归、匿名函数、内置函数