

一、prometheus安装前准备
prometheus官网:https://prometheus.io/
grafana官网:https://grafana.com/
资源下载:

# 1.资源下载
wget https://github.com/prometheus/prometheus/releases/download/v2.45.4/prometheus-2.45.4.linux-amd64.tar.gz

wget https://github.com/prometheus/alertmanager/releases/download/v0.27.0/alertmanager-0.27.0.linux-amd64.tar.gz

wget https://github.com/prometheus/node_exporter/releases/download/v1.7.0/node_exporter-1.7.0.linux-amd64.tar.gz

wget https://dl.grafana.com/enterprise/release/grafana-enterprise-10.4.2.linux-amd64.tar.gz

# 2.解压到对应目录
mkdir -p /opt/prometheus
root@os:/opt/prometheus# pwd
/opt/prometheus
root@os:/opt/prometheus# ls
alertmanager  grafana  node_exporter  prometheus

# 3.创建一个专门的prometheus用户
useradd -M -s /usr/sbin/nologin prometheus

# 4.修改目录权限
chown prometheus:prometheus -R /opt/prometheus
二、配置文件修改
2.1 创建system服务
# 1.prometheus服务启动文件
cat > /etc/systemd/system/prometheus.service << "EOF"
[Unit]
Description=Prometheus Server
Documentation=https://prometheus.io/docs/introduction/overview/
After=network-online.target

[Service]
Type=simple
User=prometheus
Group=prometheus
Restart=on-failure
ExecStart=/opt/prometheus/prometheus/prometheus \
  --config.file=/opt/prometheus/prometheus/prometheus.yml \
  --storage.tsdb.path=/opt/prometheus/prometheus/data \
  --storage.tsdb.retention.time=60d \
  --web.enable-lifecycle

[Install]
WantedBy=multi-user.target
EOF

# 详情
--config.file=/opt/prometheus/prometheus/prometheus.yml                 #主配置文件
--storage.tsdb.path=/opt/prometheus/prometheus/data                     #数据库存储目录
--web.console.libraries=/opt/prometheus/prometheus/console_libraries    #指定控制台库目录路径
--web.console.templates=/opt/prometheus/prometheus/consoles             #指定控制台模版目录路径
--storage.tsdb.retention=60d                                            #指明数据保留天数,默认15天
--web.enable-lifecycle                                                  #热加载
# 2.创建altermanager启动服务
cat >/etc/systemd/system/alertmanager.service << "EOF"

[Unit]
Description=Alert Manager
Wants=network-online.target
After=network-online.target

[Service]
Type=simple
User=prometheus
Group=prometheus
ExecStart=/opt/prometheus/alertmanager/alertmanager \
  --config.file=/opt/prometheus/alertmanager/alertmanager.yml \
  --storage.path=/opt/prometheus/alertmanager/data

Restart=always

[Install]
WantedBy=multi-user.target

EOF
# 3.创建grafana启动服务
cat >/etc/systemd/system/grafana-server.service<<"EOF"
[Unit]
Description=Grafana server
Documentation=http://docs.grafana.org
[Service]
Type=simple
User=prometheus
Group=prometheus
Restart=on-failure
ExecStart=/opt/prometheus/grafana/bin/grafana-server \
  --config=/opt/prometheus/grafana/conf/defaults.ini \
  --homepath=/opt/prometheus/grafana
[Install]
WantedBy=multi-user.target
EOF
# 4.创建node_exporter启动服务
cat > /etc/systemd/system/node_exporter.service <<"EOF"
[Unit]
Description=node_exporter
Documentation=https://prometheus.io/
After=network.target
[Service]
User=prometheus
Group=prometheus
ExecStart=/opt/prometheus/node_exporter/node_exporter
Restart=on-failure
[Install]
WantedBy=multi-user.target
EOF
2.2 修改配置文件
# altermanager启动前修改prometheus配置
vim /opt/prometheus/prometheus/prometheus.yml

alerting:
  alertmanagers:
  - static_configs:
    - targets:
      #根据实际填写alertmanager的地址
      - localhost:9093

rule_files:
  #根据实际名修改文件名
  - "alert.yml"

# 搜刮配置
scrape_configs:
  - job_name: 'alertmanager'
    scrape_interval: 15s
    static_configs:
    - targets: ['localhost:9093']

# 触发器配置文件alert.yml
cat > /opt/prometheus/prometheus/alert.yml <<"EOF"
groups:
- name: Prometheus alert
  rules:
  # 对任何实例超过30秒无法联系的情况发出警报
  - alert: 服务告警
    expr: up == 0
    for: 30s
    labels:
      severity: critical
    annotations:
      summary: "服务异常,实例:{{ $labels.instance }}"
      description: "{{ $labels.job }} 服务已关闭"
EOF
# node_exporter服务
cat >> /opt/prometheus/prometheus/prometheus.yml <<"EOF"

# 再scrape_configs这行下面添加如下配置:
  #node-exporter配置
  - job_name: 'node-exporter'
    scrape_interval: 15s
    static_configs:
    - targets: ['localhost:9100']
      labels:
        instance: Prometheus服务器
EOF
2.3 启动服务
# 启动服务
systemctl daemon-reload
systemctl start prometheus.service
systemctl enable prometheus.service
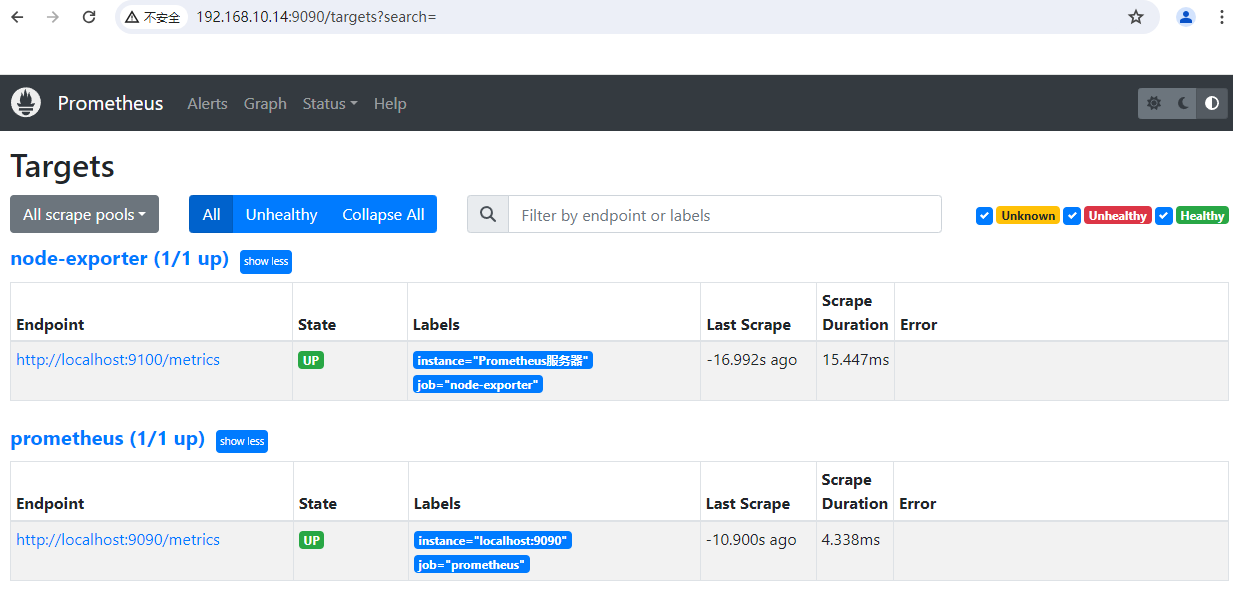
访问测试地址:
http://192.168.10.14:9090/
监控指标:http://192.168.10.14:9090/metrics
systemctl start alertmanager.service
systemctl enable alertmanager.service
访问测试地址:http://192.168.10.14:9093/
systemctl start grafana-server.service
systemctl enable grafana-server.service
web访问地址:http://192.168.10.14:3000/
systemctl start node_exporter.service
systemctl enable node_exporter.service
web访问地址:http://192.168.10.14:9100/metrics
# 查看命令
systemctl status 服务名
# prometheus配置文件如果有修改,请用重载或重启服务命令
重载:curl -X POST http://localhost:9090/-/reload
三、使用grafana展示prometheus
3.1 登录grafana
http://192.168.10.14:3000/login
默认用户名密码:admin/admin
第一次登陆,需要修改密码,填入新的密码后,再submit
3.2 创建prometheus数据源
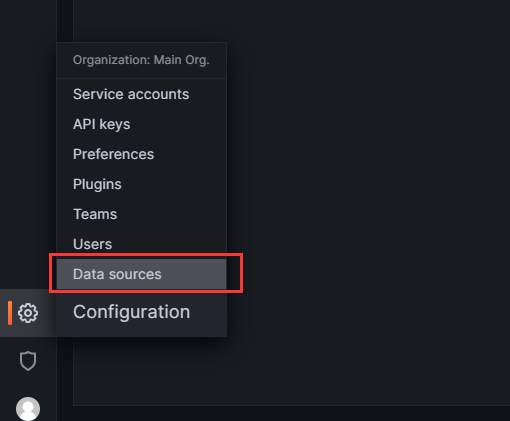
在 Grafana 中创建 Prometheus 数据源:
- 单击边栏中的“齿轮”,打开“配置”菜单。
- 单击“数据源”。
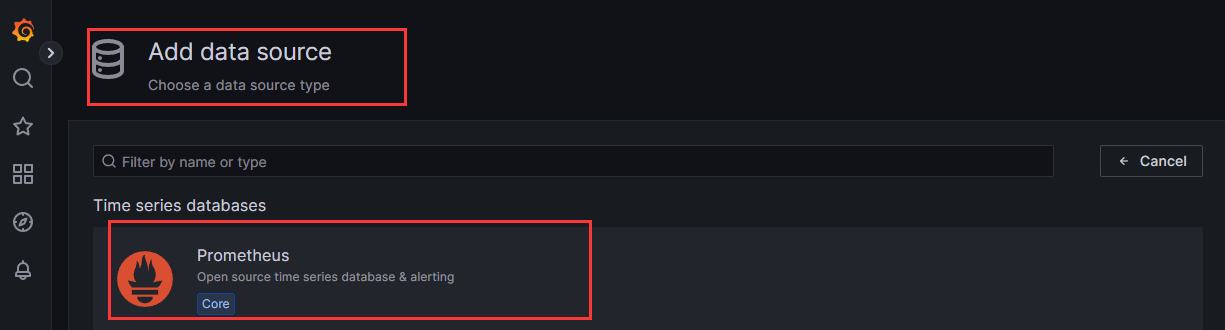
- 单击“添加数据源”。
- 选择“Prometheus”作为类型。
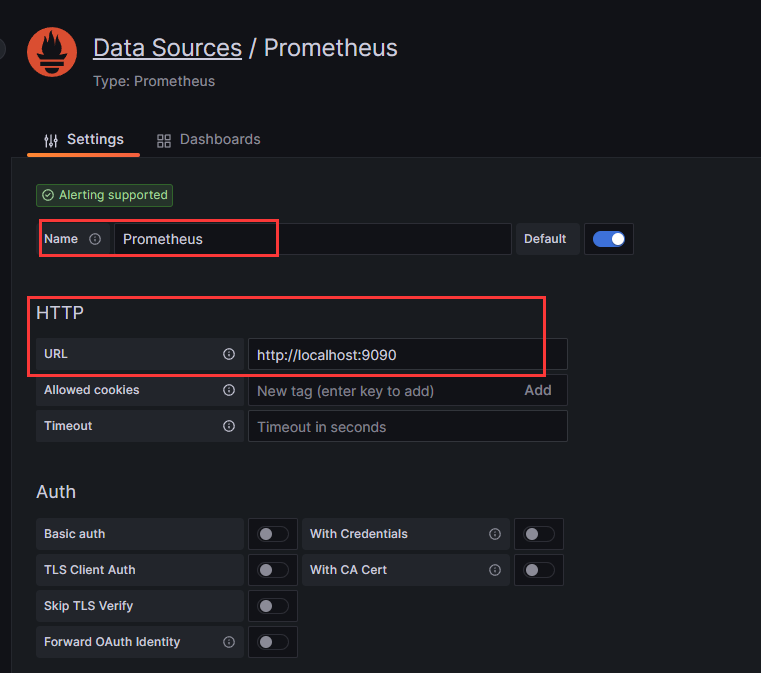
- 设置适当的 Prometheus 服务器 URL(例如,
http://localhost:9090)
- 单击“保存并测试”以保存新的数据源。
url填入:http://localhost:9090 注:localhost表示本机,然后保存save&test
3.3 创建仪表盘:从grafana导入仪表盘
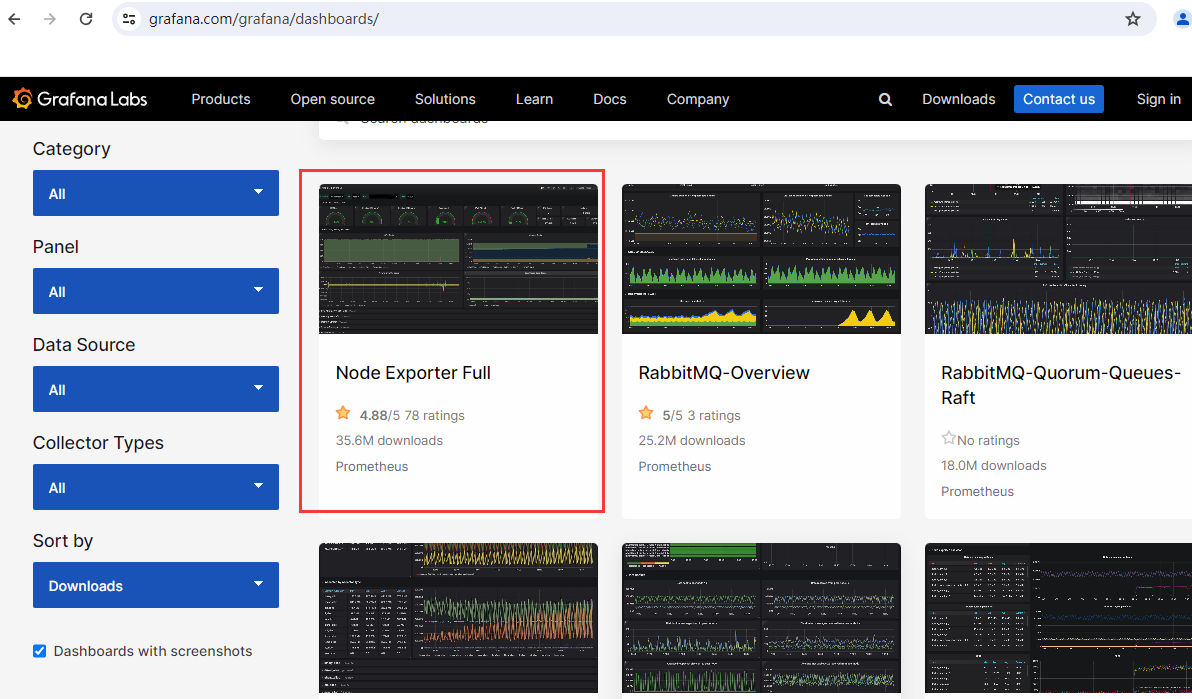
https://grafana.com/grafana/dashboards/
打开grafana的dashboards官网,在搜索栏输入node exporter回车,点击下载量大的dashboards如下图:
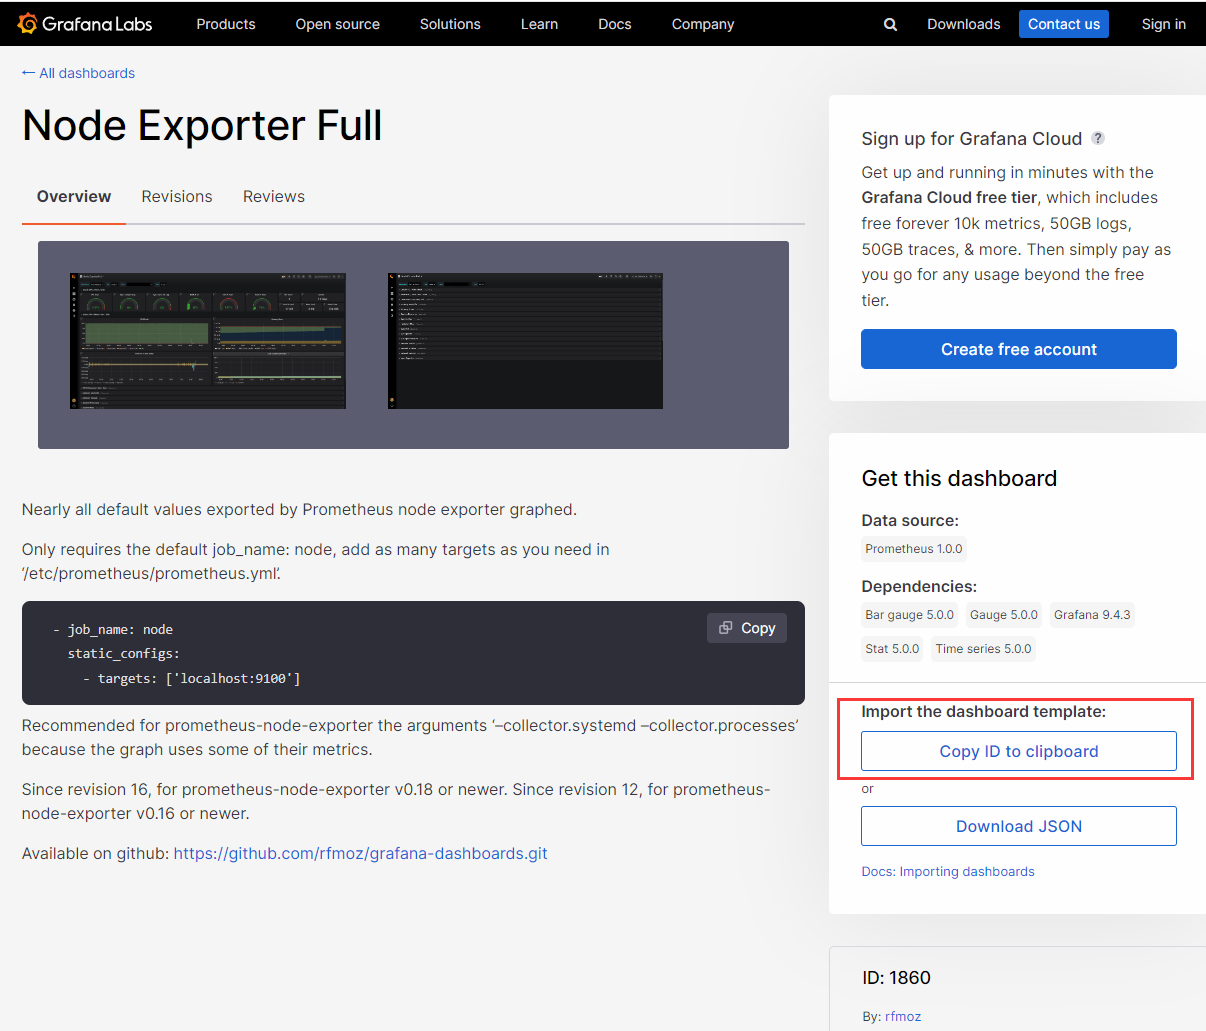
拷贝id
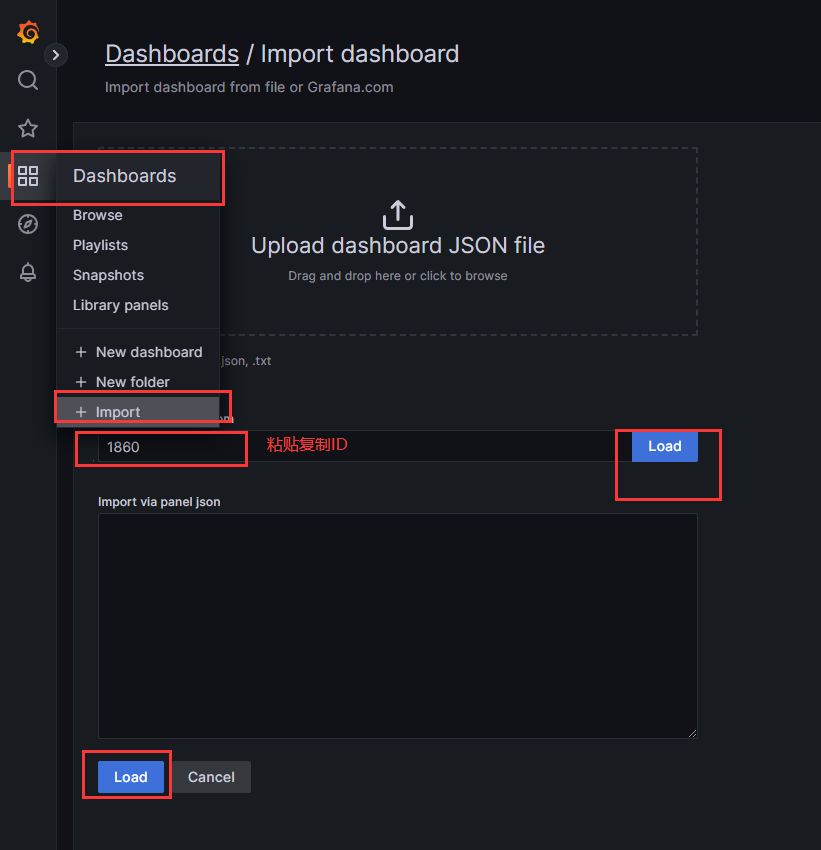
打开grafana web控制台--点击dashbord图标--在点import导入--粘贴之前复制的id--在点load加载
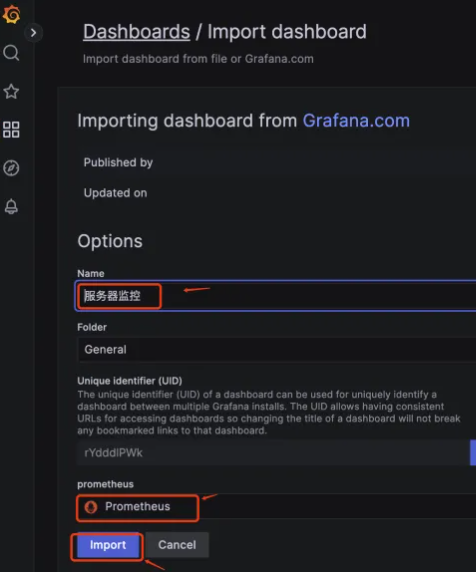
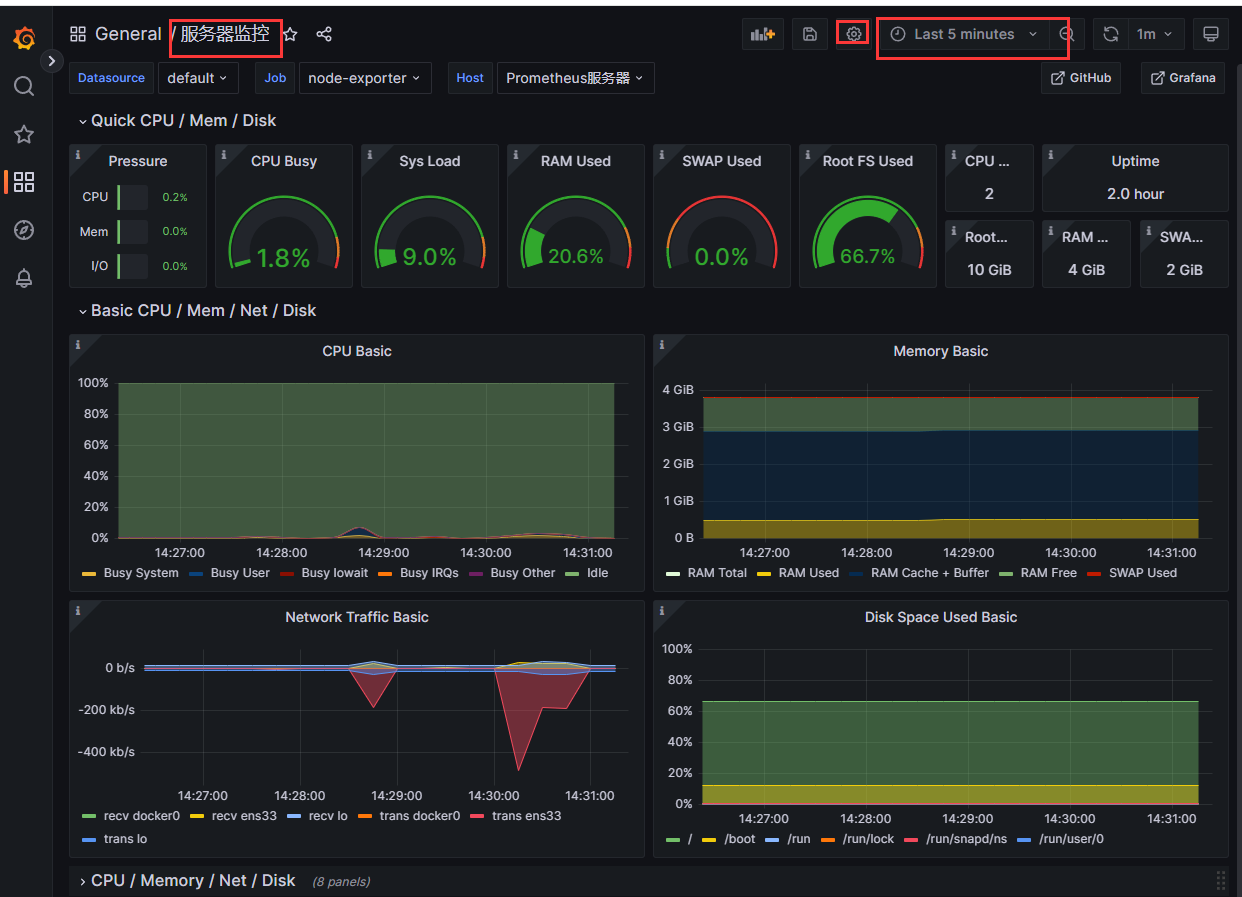
name填写“服务器监控”(根据实际修改),选择“prometheus”--在点import导入
导入dashboard完成后,查看:
分类:
监控


【推荐】国内首个AI IDE,深度理解中文开发场景,立即下载体验Trae
【推荐】编程新体验,更懂你的AI,立即体验豆包MarsCode编程助手
【推荐】抖音旗下AI助手豆包,你的智能百科全书,全免费不限次数
【推荐】轻量又高性能的 SSH 工具 IShell:AI 加持,快人一步
· 震惊!C++程序真的从main开始吗?99%的程序员都答错了
· 单元测试从入门到精通
· 【硬核科普】Trae如何「偷看」你的代码?零基础破解AI编程运行原理
· 上周热点回顾(3.3-3.9)
· winform 绘制太阳,地球,月球 运作规律
2019-04-24 三元表达式、列表推导式、生成器表达式、递归、匿名函数、内置函数