


七、Prometheus监控扩展
7.1 Promethues 采集tomcat监控数据

# 1.制作tomcat 镜像
[root@monitor ~]# mkdir /root/tomcat_image && cd tomcat_image
[root@monitor tomcat_image]# cat Dockfile
from tomcat
ADD metrics.war /usr/local/tomcat/webapps/
ADD simpleclient-0.8.0.jar  /usr/local/tomcat/lib/
ADD simpleclient_common-0.8.0.jar /usr/local/tomcat/lib/
ADD simpleclient_hotspot-0.8.0.jar /usr/local/tomcat/lib/
ADD simpleclient_servlet-0.8.0.jar /usr/local/tomcat/lib/
ADD tomcat_exporter_client-0.0.12.jar /usr/local/tomcat/lib/

# 上传jar文件到/root/tomcat_image目录
[root@monitor tomcat_image]# docker build -t="tomcat:v1" .
Sending build context to Docker daemon    128kB
Step 1/7 : from tomcat
 ---> fb5657adc892
Step 2/7 : ADD metrics.war /usr/local/tomcat/webapps/
 ---> 70bebb443fa6
Step 3/7 : ADD simpleclient-0.8.0.jar  /usr/local/tomcat/lib/
 ---> 2c037ca1a4e8
Step 4/7 : ADD simpleclient_common-0.8.0.jar /usr/local/tomcat/lib/
 ---> 60a1a9fffbcb
Step 5/7 : ADD simpleclient_hotspot-0.8.0.jar /usr/local/tomcat/lib/
 ---> ac58a0695b53
Step 6/7 : ADD simpleclient_servlet-0.8.0.jar /usr/local/tomcat/lib/
 ---> 0f592584df8a
Step 7/7 : ADD tomcat_exporter_client-0.0.12.jar /usr/local/tomcat/lib/
 ---> 1911921b4169
Successfully built 1911921b4169
Successfully tagged tomcat:v1

# 2.基于上面的镜像创建一个tomcat实例
[root@master tomcat_image]# cat tomcat-deploy.yaml
apiVersion: apps/v1
kind: Deployment
metadata:
  name: tomcat-deployment
  namespace: default
spec:
  selector:
    matchLabels:
     app: tomcat
  replicas: 2 # tells deployment to run 2 pods matching the template
  template: # create pods using pod definition in this template
    metadata:
      labels:
        app: tomcat
      annotations:
        prometheus.io/scrape: 'true'
    spec:
      containers:
      - name: tomcat
        image: tomcat:v1
        imagePullPolicy: IfNotPresent
        ports:
        - containerPort: 8080
        securityContext:
          privileged: true

[root@master tomcat_image]# kubectl apply -f tomcat-deploy.yaml
[root@master tomcat_image]# kubectl get pods -o wide
NAME READY STATUS RESTARTS AGE IP NODE NOMINATED NODE READINESS GATES
tomcat-deployment-685fcb974f-plbh9 1/1 Running 0 11s 10.244.75.214 monitor <none> <none>
tomcat-deployment-685fcb974f-z8jdp 1/1 Running 0 11s 10.244.75.215 monitor <none> <none>
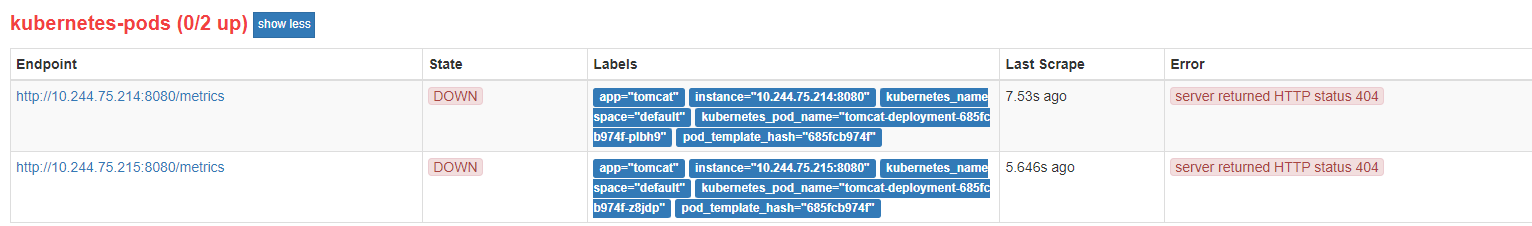
# 3.创建一个service(可操作也可不操作,prometheus通过内网链接)
[root@master tomcat_image]# cat tomcat_svc.yaml
kind: Service  #service 类型
apiVersion: v1
metadata:
#  annotations:
#  #    prometheus.io/scrape: 'true'
  name: tomcat-service
spec:
  selector:
    app: tomcat
  ports:
  - nodePort: 31360
    port: 8080
    protocol: TCP
    targetPort: 8080
  type: NodePort
[root@master tomcat_image]# kubectl apply -f tomcat_svc.yaml
tomcat没有进行配置,所以显示这样,可以看出在prometheus中出现了
7.2 Promethues 采集 Nginx监控数据---nginx-vts-export
监控Nginx主要用到以下三个模块:

nginx-module-vts:Nginx的监控模块,能够提供JSON格式的数据产出。
nginx-vts-exporter:主要用于收集Nginx的监控数据,并给Prometheus提供监控接口,默认端口号9913。
Prometheus:监控Nginx-vts-exporter提供的Nginx数据,并存储在时序数据库中,可以使用PromQL对时序数据进行查询和聚合。
grafana nginx监控模板下载:请根据grafana版本需求下载
https://grafana.com/grafana/dashboards/?pg=community&plcmt=topnav&search=nginx
# 环境:centos 7.9,nginx-1.22.0,grafana 5.0.4,nginx-vts-export-0.10.3
1.安装依赖包
yum install -y yum-utils wget pcre-devel gcc gcc-c++ ncurses-devel perl openssl openssl-devel libssl-dev mysql-devel geoip-devel

./configure --prefix=/usr/local/nginx-1.20.0 --conf-path=/usr/local/nginx-1.20.0/conf/nginx.conf --http-client-body-temp-path=/usr/local/nginx-1.20.0/cache/client_temp --http-proxy-temp-path=/usr/local/nginx-1.20.0/cache/proxy_temp --http-fastcgi-temp-path=/usr/local/nginx-1.20.0/cache/fastcgi_temp --http-uwsgi-temp-path=/usr/local/nginx-1.20.0/cache/uwsgi_temp --http-scgi-temp-path=/usr/local/nginx-1.20.0/cache/scgi_temp --with-http_geoip_module=dynamic --with-http_ssl_module --with-http_v2_module --with-http_realip_module --with-http_addition_module --with-http_sub_module --with-http_dav_module --with-http_flv_module --with-http_mp4_module --with-http_gunzip_module --with-http_gzip_static_module --with-http_random_index_module --with-http_secure_link_module --with-http_stub_status_module --with-http_degradation_module --with-http_slice_module --with-http_auth_request_module --with-mail --with-mail_ssl_module --with-pcre --with-pcre-jit --with-stream --with-stream_ssl_module --with-threads --with-file-aio --with-ipv6 --with-cc-opt='-O2 -g -pipe -Wp,-D_FORTIFY_SOURCE=2 -fexceptions -fstack-protector --param=ssp-buffer-size=4 -m64 -mtune=generic' --add-module=/usr/local/nginx-module-vts-master/

make && make install

# nginx.conf中增加
http {
  ....
  vhost_traffic_status_zone;
  vhost_traffic_status_filter_by_host on;
  ...
}

# server_name中添加
    location /status {
        vhost_traffic_status_display;
        vhost_traffic_status_display_format html;
  }

# 解释:
打开vhost过滤
vhost_traffic_status_filter_by_host on
开启此功能,在Nginx配置有多个server_name的情况下,会根据不同的server_name进行流量的统计,否则默认会把流量全部计算到第一个server_name上。在不想统计流量的server区域禁vhost_traffic_status off;
vhost_traffic_status_zone; # 共享内存区域设置参数,默认32M共享内存大小
vhost_traffic_status_display; # 启用或禁用显示处理模块
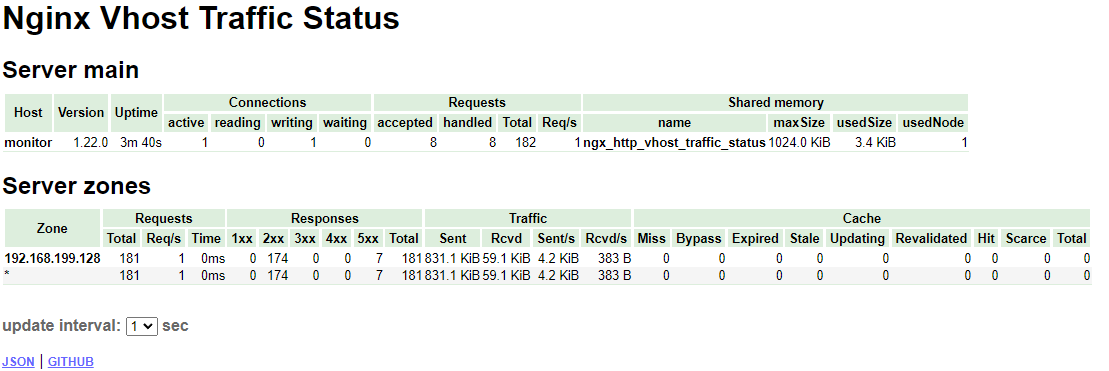
vhost_traffic_status_display_format html; # 设置显示处理模块输出的格式,<json\|html\|jsonp\|prometheus>,默认值为json
启动nginx后访问查看:http://192.168.199.128/status
tar -xzvf nginx-vts-exporter-0.10.3.linux-amd64.tar.gz
cd nginx-vts-exporter-0.10.3.linux-amd64
[root@monitor nginx-vts-exporter-0.10.3.linux-amd64]# nohup ./nginx-vts-exporter -nginx.scrape_uri http://192.168.199.128/status/format/json &
# 新增
vim prometheus-alertmanager-cfg.yaml
    - job_name: 'nginx'
      scrape_interval: 5s
      static_configs:
      - targets: ['192.168.199.128:9913']

kubectl delete -f alertmanager-cm.yaml
kubectl delete -f prometheus-alertmanager-cfg.yaml
kubectl delete -f prometheus-alertmanager-deploy.yaml
kubectl apply -f .

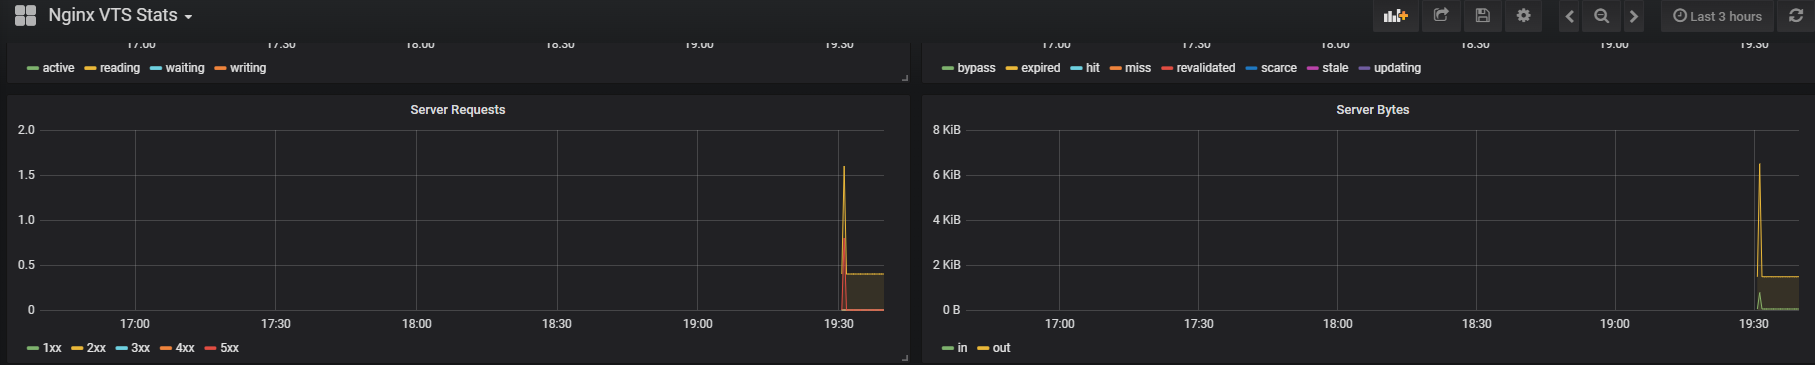
在grafana界面导入nginx-vts-stats_rev2.json
https://grafana.com/grafana/dashboards/2949
nginx-vts-exporter采用镜像安装
[root@monitor vhosts]# docker search nginx-vts-exporter
NAME                                   DESCRIPTION                                     STARS     OFFICIAL   AUTOMATED
sophos/nginx-vts-exporter              Simple server that scrapes Nginx vts stats a…   7                    [OK]

[root@monitor vhosts]# docker pull sophos/nginx-vts-exporter:v0.10.7
docker.io/sophos/nginx-vts-exporter:v0.10.7
[root@monitor vhosts]# docker images
sophos/nginx-vts-exporter                            v0.10.7   3524e3801c35   2 years ago     15MB

[root@monitor vhosts]# docker run -di -p 9913:9913 --env NGINX_STATUS=http://192.168.199.128/status/format/json --restart=always sophos/nginx-vts-exporter:v0.10.7
cefb0050c7fb2409f4b24640089478370a176724ab4719b01aa7cece5bc22906


【推荐】国内首个AI IDE,深度理解中文开发场景,立即下载体验Trae
【推荐】编程新体验,更懂你的AI,立即体验豆包MarsCode编程助手
【推荐】抖音旗下AI助手豆包,你的智能百科全书,全免费不限次数
【推荐】轻量又高性能的 SSH 工具 IShell:AI 加持,快人一步
· 无需6万激活码!GitHub神秘组织3小时极速复刻Manus,手把手教你使用OpenManus搭建本
· C#/.NET/.NET Core优秀项目和框架2025年2月简报
· Manus爆火,是硬核还是营销?
· 终于写完轮子一部分:tcp代理 了,记录一下
· Qt个人项目总结 —— MySQL数据库查询与断言