
一、环境
grafana 使用nginx做转发,源地址http://192.168.1.180:3000 nginx转发的grafana地址: http://grafana.xxx.com/grafana
二、实现:
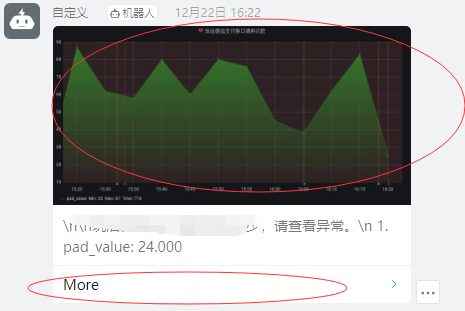
(1)、点击 “More”跳转grafana网页
(2)、告警信息包含 image图片
1、点击 “More”跳转grafana网页,配置
nginx配置
 [root@kibana vhost]# cat grafana.conf
    server {
        listen       80;
        server_name  grafana.xxx.com;
        access_log /var/log/nginx/grafana.xxx.com.access.log;
        error_log  /var/log/nginx/grafana.xxx.com.error.log;
        # Load configuration files for the default server block.
        #include /etc/nginx/default.d/*.conf;

        location /grafana/ {
                root html;
                index index.html index.htm;
                proxy_pass http://192.168.1.180:3000/;  #一定要在端口号后面加“/”
                proxy_set_header Host $host;
                proxy_set_header X-Real-IP $remote_addr;
                proxy_set_header x-forwarded-for $proxy_add_x_forwarded_for;
                proxy_redirect default;
                proxy_http_version 1.1;
                proxy_set_header Connection "";
        }

        error_page 404 /404.html;
            location = /40x.html {
        }

        error_page 500 502 503 504 /50x.html;
            location = /50x.html {
        }
}
grafana配置修改
修改grafana.ini配置文件的server配置
domain = grafana.xxx.com
root_url = http://grafana.xxx.com/grafana
serve_from_sub_path = true
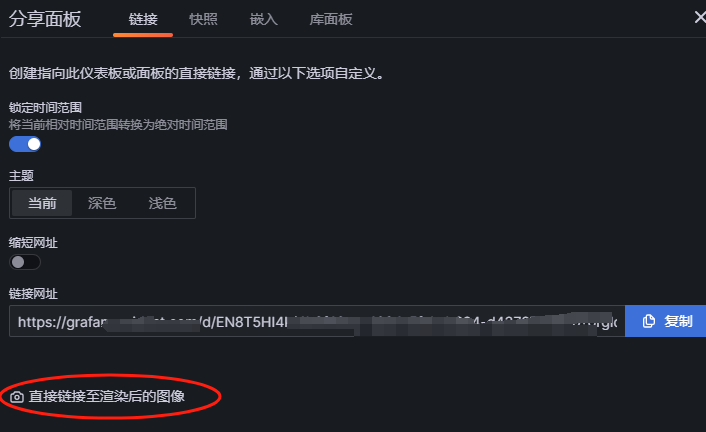
2、实现告警信息包含 image图片
(1)安装grafana-image-renderer
docker pull grafana/grafana-image-renderer

docker run -d --name=render --network=host --restart=always -e BROWSER_TZ=Asia/Shanghai grafana/grafana-image-renderer
安装完成可访问 192.168.1.180:8081 测试
(2)修改 /etc/grafana/grafana.ini
server_url 是Remote rendering service 的地址
server_url = http://192.168.1.180:8081/render/
callback_url 是本grafana的地址(可以不设置)
callback_url = http://grafana.xxx.com/grafana/
[external_image_storage] #相当于把本机当作一个服务器,可以通过本机IP访问到存储在本地的图片。
provider = local
temp_data_lifetime = 24h #截图的图片保留24小时
concurrent_render_limit = 5 #同时最大渲染数5
3、grafana钉钉告警设置
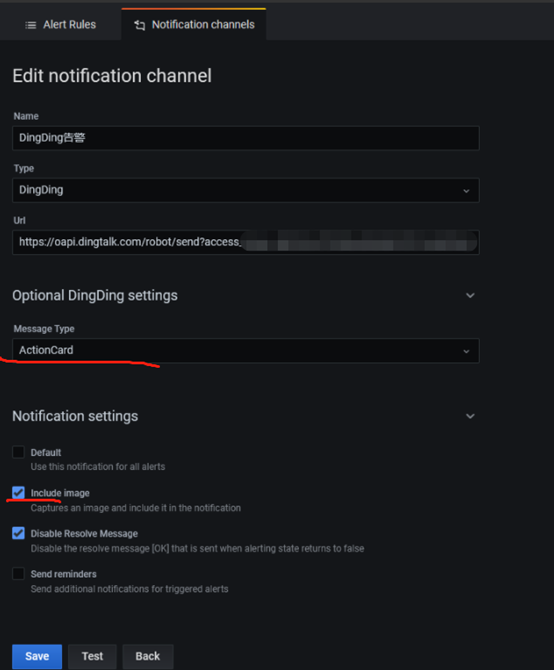
grafana 8.0版本开始不再支持钉钉发送消息加载image,可以使用邮件通知
https://grafana.com/docs/grafana/latest/alerting/manage-notifications/images-in-notifications/
grafana.ini配置
[root@prometheus opt]# cat grafana.ini |grep -Ev '^$|^#'
;app_mode = production
;instance_name = ${HOSTNAME}
[paths]
data = /var/lib/grafana
temp_data_lifetime = 24h
logs = /var/log/grafana
plugins = /var/lib/grafana/plugins
;provisioning = conf/provisioning
[server]
;protocol = http
;http_addr =
;enforce_domain = true
domain = grafana.xxx.com
;serve_from_sub_path = true
;enforce_domain = false
root_url = %(protocol)s://%(domain)s
;router_logging = false
static_root_path = public
;enable_gzip = false
;cert_file =
;cert_key =
;socket =
[database]
;type = sqlite3
;host = 127.0.0.1:3306
;name = grafana
;user = root
;password =
;url =
;ssl_mode = disable
;ca_cert_path =
;client_key_path =
;client_cert_path =
;server_cert_name =
;path = grafana.db
;max_idle_conn = 2
;max_open_conn =
;conn_max_lifetime = 14400
;log_queries =
;cache_mode = private
[remote_cache]
;type = database
;connstr =
[dataproxy]
;logging = false
;timeout = 30
;keep_alive_seconds = 30
;tls_handshake_timeout_seconds = 10
;expect_continue_timeout_seconds = 1
;max_idle_connections = 100
;idle_conn_timeout_seconds = 90
;send_user_header = false
[analytics]
;reporting_enabled = true
;check_for_updates = true
;google_analytics_ua_id =
;google_tag_manager_id =
[security]
;disable_initial_admin_creation = false
;admin_user = admin
;admin_password = admin
;secret_key = SW2YcwTIb9zpOOhoPsMm
;disable_gravatar = false
;data_source_proxy_whitelist =
;disable_brute_force_login_protection = false
cookie_secure = false
;cookie_samesite = lax
;allow_embedding = false
;strict_transport_security = false
;strict_transport_security_max_age_seconds = 86400
;strict_transport_security_preload = false
;strict_transport_security_subdomains = false
;x_content_type_options = true
;x_xss_protection = true
[snapshots]
;external_enabled = true
;external_snapshot_url = https://snapshots-origin.raintank.io
;external_snapshot_name = Publish to snapshot.raintank.io
;public_mode = false
;snapshot_remove_expired = true
[dashboards]
;versions_to_keep = 20
;min_refresh_interval = 5s
;default_home_dashboard_path =
[users]
;allow_sign_up = true
;allow_org_create = true
;auto_assign_org = true
;auto_assign_org_id = 1
;auto_assign_org_role = Viewer
;verify_email_enabled = false
;login_hint = email or username
;password_hint = password
;default_theme = dark
;external_manage_link_url =
;external_manage_link_name =
;external_manage_info =
;viewers_can_edit = false
;editors_can_admin = false
;user_invite_max_lifetime_duration = 24h
[auth]
;login_cookie_name = grafana_session
;login_maximum_inactive_lifetime_duration =
;login_maximum_lifetime_duration =
;token_rotation_interval_minutes = 10
;disable_login_form = false
;disable_signout_menu = false
;signout_redirect_url =
;oauth_auto_login = false
;oauth_state_cookie_max_age = 600
;api_key_max_seconds_to_live = -1
;sigv4_auth_enabled = false
[auth.anonymous]
;enabled = false
;org_name = Main Org.
;org_role = Viewer
;hide_version = false
[auth.github]
;enabled = false
;allow_sign_up = true
;client_id = some_id
;client_secret = some_secret
;scopes = user:email,read:org
;auth_url = https://github.com/login/oauth/authorize
;token_url = https://github.com/login/oauth/access_token
;api_url = https://api.github.com/user
;allowed_domains =
;team_ids =
;allowed_organizations =
[auth.gitlab]
;enabled = false
;allow_sign_up = true
;client_id = some_id
;client_secret = some_secret
;scopes = api
;auth_url = https://gitlab.com/oauth/authorize
;token_url = https://gitlab.com/oauth/token
;api_url = https://gitlab.com/api/v4
;allowed_domains =
;allowed_groups =
[auth.google]
;enabled = false
;allow_sign_up = true
;client_id = some_client_id
;client_secret = some_client_secret
;scopes = https://www.googleapis.com/auth/userinfo.profile https://www.googleapis.com/auth/userinfo.email
;auth_url = https://accounts.google.com/o/oauth2/auth
;token_url = https://accounts.google.com/o/oauth2/token
;api_url = https://www.googleapis.com/oauth2/v1/userinfo
;allowed_domains =
;hosted_domain =
[auth.grafana_com]
;enabled = false
;allow_sign_up = true
;client_id = some_id
;client_secret = some_secret
;scopes = user:email
;allowed_organizations =
[auth.azuread]
;name = Azure AD
;enabled = false
;allow_sign_up = true
;client_id = some_client_id
;client_secret = some_client_secret
;scopes = openid email profile
;auth_url = https://login.microsoftonline.com/<tenant-id>/oauth2/v2.0/authorize
;token_url = https://login.microsoftonline.com/<tenant-id>/oauth2/v2.0/token
;allowed_domains =
;allowed_groups =
[auth.okta]
;name = Okta
;enabled = false
;allow_sign_up = true
;client_id = some_id
;client_secret = some_secret
;scopes = openid profile email groups
;auth_url = https://<tenant-id>.okta.com/oauth2/v1/authorize
;token_url = https://<tenant-id>.okta.com/oauth2/v1/token
;api_url = https://<tenant-id>.okta.com/oauth2/v1/userinfo
;allowed_domains =
;allowed_groups =
;role_attribute_path =
[auth.generic_oauth]
;enabled = false
;name = OAuth
;allow_sign_up = true
;client_id = some_id
;client_secret = some_secret
;scopes = user:email,read:org
;email_attribute_name = email:primary
;email_attribute_path =
;login_attribute_path =
;id_token_attribute_name =
;auth_url = https://foo.bar/login/oauth/authorize
;token_url = https://foo.bar/login/oauth/access_token
;api_url = https://foo.bar/user
;allowed_domains =
;team_ids =
;allowed_organizations =
;role_attribute_path =
;tls_skip_verify_insecure = false
;tls_client_cert =
;tls_client_key =
;tls_client_ca =
[auth.basic]
;enabled = true
[auth.proxy]
;enabled = false
;header_name = X-WEBAUTH-USER
;header_property = username
;auto_sign_up = true
;sync_ttl = 60
;whitelist = 192.168.1.1, 192.168.2.1
;headers = Email:X-User-Email, Name:X-User-Name
;enable_login_token = false
[auth.ldap]
;enabled = false
;config_file = /etc/grafana/ldap.toml
;allow_sign_up = true
;sync_cron = "0 0 1 * * *"
;active_sync_enabled = true
[smtp]
enabled = true
host = smtp.mxhichina.com:465
user = xxx@xxx.com   ###使用的是阿里云的企业邮箱
password = "xxxx"    ###此处阿里云企业邮箱使用的是user的密码, 别的类型邮箱需要开通SMTP,并在此处填写授权码
cert_file =
key_file =
skip_verify = true
from_address = xxx@xxx.com
from_name = Grafana
;ehlo_identity = dashboard.example.com
;startTLS_policy = NoStartTLS
[emails]
;welcome_email_on_sign_up = false
;templates_pattern = emails/*.html
[log]
;mode = console file
;level = info
;filters =
[log.console]
;level =
;format = console
[log.file]
;level =
;format = text
;log_rotate = true
;max_lines = 1000000
;max_size_shift = 28
;daily_rotate = true
;max_days = 7
[log.syslog]
;level =
;format = text
;network =
;address =
;facility =
;tag =
[quota]
; enabled = false
; org_user = 10
; org_dashboard = 100
; org_data_source = 10
; org_api_key = 10
; user_org = 10
; global_user = -1
; global_org = -1
; global_dashboard = -1
; global_api_key = -1
; global_session = -1
[unified_alerting]
enabled = true
;disabled_orgs =
;admin_config_poll_interval = 60s
;alertmanager_config_poll_interval = 60s
;ha_redis_address =
;ha_redis_username =
;ha_redis_password =
;ha_redis_db =
;ha_redis_prefix =
;ha_redis_peer_name =
;ha_listen_address = "0.0.0.0:9094"
;ha_advertise_address = ""
;ha_peers = ""
;ha_peer_timeout = "15s"
;ha_gossip_interval = "200ms"
;ha_push_pull_interval = "60s"
;execute_alerts = true
;evaluation_timeout = 30s
;max_attempts = 3
;min_interval = 10s
[unified_alerting.reserved_labels]
;disabled_labels =
[unified_alerting.state_history]
; enabled = true
; backend = "multiple"
; primary = "loki"
; secondaries = "annotations"
; loki_remote_url = "http://loki:3100"
; loki_remote_read_url = "http://loki-querier:3100"
; loki_remote_write_url = "http://loki-distributor:3100"
; loki_tenant_id = 123
; loki_basic_auth_username = "myuser"
; loki_basic_auth_password = "mypass"
[unified_alerting.state_history.external_labels]
; mylabelkey = mylabelvalue
[alerting]
enabled = false
;execute_alerts = true
;error_or_timeout = alerting
;nodata_or_nullvalues = no_data
;concurrent_render_limit = 5
;evaluation_timeout_seconds = 30
;notification_timeout_seconds = 30
;max_attempts = 3
;min_interval_seconds = 1
;max_annotation_age =
;max_annotations_to_keep =
[annotations.dashboard]
;max_age =
;max_annotations_to_keep =
[annotations.api]
;max_age =
;max_annotations_to_keep =
[explore]
;enabled = true
[metrics]
;enabled           = true
;interval_seconds  = 10
;disable_total_stats = false
; basic_auth_username =
; basic_auth_password =
[metrics.environment_info]
[metrics.graphite]
;address =
;prefix = prod.grafana.%(instance_name)s.
[grafana_com]
;url = https://grafana.com
[tracing.jaeger]
;address = localhost:6831
;always_included_tag = tag1:value1
;sampler_type = const
;sampler_param = 1
;sampling_server_url =
;zipkin_propagation = false
;disable_shared_zipkin_spans = false
[external_image_storage]
provider = local
[external_image_storage.s3]
;endpoint =
;path_style_access =
;bucket =
;region =
;path =
;access_key =
;secret_key =
[external_image_storage.webdav]
;url =
;public_url =
;username =
;password =
[external_image_storage.gcs]
;key_file =
;bucket =
;path =
[external_image_storage.azure_blob]
;account_name =
;account_key =
;container_name =
[external_image_storage.local]
[rendering]
renderer_token = JSlIhleC!V@S
server_url = http://122.xxx.xxx.220:8081/render/
callback_url = http://grafana.xxx.com
concurrent_render_request_limit = 30
render_key_lifetime = 10m
[panels]
;disable_sanitize_html = false
[plugins]
;enable_alpha = false
;app_tls_skip_verify_insecure = false
allow_loading_unsigned_plugins = aliyun_cms_grafana_datasource,aliyun-log-service-datasource,grafana-log-service-datasource
;marketplace_url = https://grafana.com/grafana/plugins/
[plugin.grafana-image-renderer]
;rendering_timezone =
;rendering_language =
;rendering_viewport_device_scale_factor =
;rendering_ignore_https_errors =
filters = rendering:debug
;rendering_verbose_logging =
;rendering_dumpio =
;rendering_args =
;rendering_chrome_bin =
;rendering_mode =
;rendering_clustering_mode =
;rendering_clustering_max_concurrency =
;rendering_viewport_max_width =
;rendering_viewport_max_height =
;rendering_viewport_max_device_scale_factor =
;grpc_host =
;grpc_port =
[enterprise]
;license_path =
[feature_toggles]
;enable =
[date_formats]
;full_date = YYYY-MM-DD HH:mm:ss
;interval_second = HH:mm:ss
;interval_minute = HH:mm
;interval_hour = MM/DD HH:mm
;interval_day = MM/DD
;interval_month = YYYY-MM
;interval_year = YYYY
;use_browser_locale = false
default_timezone = browser
[unified_alerting.screenshots]
capture = true
upload_external_image_storage = false
max_concurrent_screenshots = 5
NGINX转发配置
upstream xxx.xxx.com{
        server 122.xxx.xxx.220:3000 max_fails=2 fail_timeout=2s;
        keepalive 300;
        }
server {
    listen 80;
    server_name xxx.xxx.com;
    return 301 https://$server_name$request_uri;
}

server {
    listen 443 ssl;
    server_name          xxx.xxx.com;
    ssl_certificate      /home/web/ssl/20230731_xxx.com.pem;
    ssl_certificate_key  /home/web/ssl/20230731_xxx.com.key;
    ssl_session_timeout  5m;
    ssl_ciphers ECDHE-RSA-AES128-GCM-SHA256:ECDHE:ECDH:AES:HIGH:!NULL:!aNULL:!MD5:!ADH:!RC4;
    ssl_protocols TLSv1 TLSv1.1 TLSv1.2;
    ssl_prefer_server_ciphers on;
    #allow 61.164.52.202;
    #deny all;
    access_log /var/log/nginx/grafana.xxx.com.access.log;
    error_log  /var/log/nginx/grafana.xxx.com.error.log;

    location / {
         root html;
         index index.html index.htm;
         proxy_pass http://122.xxx.xxx.220:3000/;
         proxy_set_header Host $host;
         proxy_set_header X-Real-IP $remote_addr;
         proxy_set_header x-forwarded-for $proxy_add_x_forwarded_for;
         proxy_redirect default;
         proxy_http_version 1.1;
         proxy_set_header Connection "";
        }

  location /api/live/ws {
    rewrite  ^/(.*)  /$1 break;
    proxy_http_version 1.1;
    proxy_set_header Upgrade $http_upgrade;
    proxy_set_header Connection "Upgrade";
    proxy_set_header Host $http_host;
    proxy_pass http://122.xxx.xxx.220:3000/;
  }
        error_page 404 /404.html;
            location = /40x.html {
        }

        error_page 500 502 503 504 /50x.html;
            location = /50x.html {
        }
}
grafana-render-image 3.8.4 配置
{
  "service": {
    "host": null,
    "port": 8081,
    "metrics": {
      "enabled": false,
      "collectDefaultMetrics": true,
      "requestDurationBuckets": [1, 5, 7, 9, 11, 13, 15, 20, 30]
    },
    "logging": {
      "level": "info",
      "console": {
        "json": true,
        "colorize": false
      }
    },
    "security": {
      "authToken": "JSlIhleC!V@S"
    }
  },
  "rendering": {
    "chromeBin": null,
    "args": ["--no-sandbox", "--disable-gpu","--ignore-certificate-errors"],
    "ignoresHttpsErrors": true,
    "timezone": "Asia/Shanghai",
    "acceptLanguage": null,
    "width": 1000,
    "height": 500,
    "deviceScaleFactor": 1,
    "maxWidth": 3080,
    "maxHeight": 3000,
    "maxDeviceScaleFactor": 4,
    "pageZoomLevel": 1,
    "headed": false,
    "mode": "default",
    "emulateNetworkConditions": false,
    "clustering": {
      "monitor": false,
      "mode": "browser",
      "maxConcurrency": 5,
      "timeout": 30
    },
    "verboseLogging": false,
    "dumpio": false,
    "timingMetrics": false
  }
}
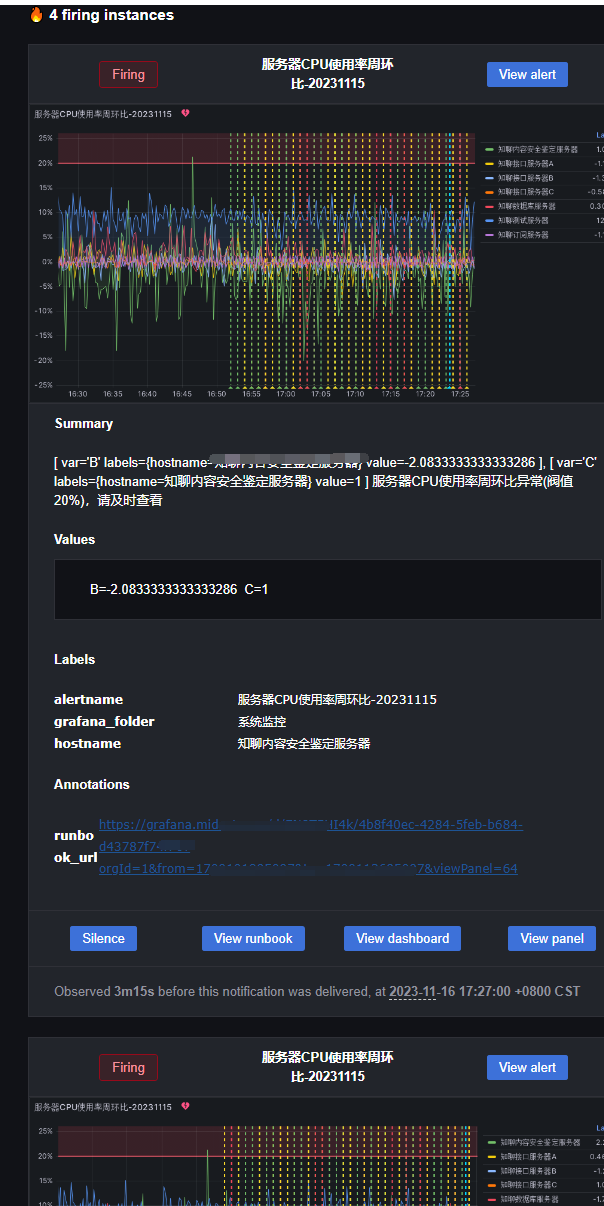
验证:
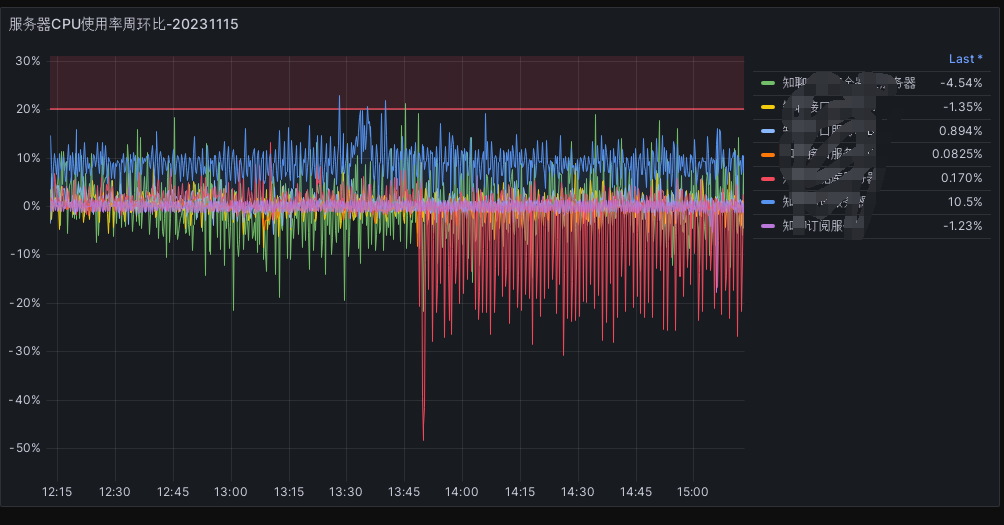
邮件告警
参考:
https://grafana.com/docs/grafana-cloud/alerting-and-irm/alerting/manage-notifications/images-in-notifications/
https://zhuanlan.zhihu.com/p/588254228
https://cloud.tencent.com/developer/article/2245015
https://blog.csdn.net/loveyoulouyou/article/details/81476307
https://blog.csdn.net/weixin_44923842/article/details/132802667

 浙公网安备 33010602011771号