
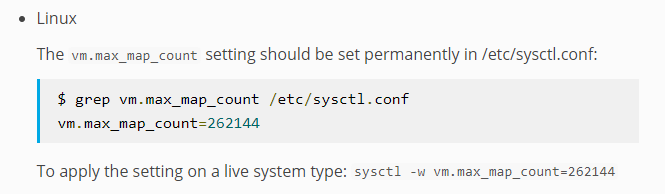
修改系统参数
sysctl -w vm.max_map_count=262144
或者
vi /etc/sysctl.conf
添加  :vm.max_map_count=262144
sysctl -p 后重启es
此参数是elasticsearch需要修改的值,如果不修改,在生产模式下elasticsearch会启动失败。官方说明如下:
使用docker-compose安装elasticsearch+kibana
mkdir -p /es/{data01,data02,data03}
chmod 777 -R /es
vim /es/docker-compose.yml
version: '2.2'
services:
es01:
image: elasticsearch:7.5.1
container_name: es01
environment:
- node.name=es01
- cluster.name=es-docker-cluster
- discovery.seed_hosts=es02
- cluster.initial_master_nodes=es01,es02,es03
- bootstrap.memory_lock=true
- "ES_JAVA_OPTS=-Xms512m -Xmx512m"
ulimits:
memlock:
soft: -1
hard: -1
volumes:
- /es/data01:/usr/share/elasticsearch/data
ports:
- 9200:9200
networks:
- elastic
es02:
image: elasticsearch:7.5.1
container_name: es02
environment:
- node.name=es02
- cluster.name=es-docker-cluster
- discovery.seed_hosts=es01
- cluster.initial_master_nodes=es01,es02,es03
- bootstrap.memory_lock=true
- "ES_JAVA_OPTS=-Xms512m -Xmx512m"
ulimits:
memlock:
soft: -1
hard: -1
volumes:
- /es/data02:/usr/share/elasticsearch/data
ports:
- 9201:9200
networks:
- elastic
es03:
image: elasticsearch:7.5.1
container_name: es03
environment:
- node.name=es03
- cluster.name=es-docker-cluster
- discovery.seed_hosts=es01
- cluster.initial_master_nodes=es01,es02,es03
- bootstrap.memory_lock=true
- "ES_JAVA_OPTS=-Xms512m -Xmx512m"
ulimits:
memlock:
soft: -1
hard: -1
volumes:
- /es/data03:/usr/share/elasticsearch/data
ports:
- 9202:9200
networks:
- elastic
kibana:
image: kibana:7.5.1
container_name: kibana
restart: always
ports:
- "5601:5601"
environment:
I18N_LOCALE: zh-CN #汉化
networks:
- elastic
links:
- es01:elasticsearch
volumes:
data01:
driver: local
data02:
driver: local
data03:
driver: local
networks:
elastic:
driver: bridge
此处安装的elasticsearch已经默认集成了ik中文分词器。
注意:一定要修改data1、data2和data3的权限,否则启动elasticsearch会报错。主要是由于启动elasticsearch
并非是以root用户启动的,所以如果data1、data2和data3是root账户创建,会没有写入权限。
安装
docker-compose up -d
Elasticsearch的api端口是9200,elasticsearch2的api端口是9201,elasticsearch3的api端口是9202
Kibana默认对外的端口是5601
参考:
https://blog.csdn.net/maquealone/article/details/89417257
多机多节点分布式集群7.5.1
192.168.1.194
192.168.1.195
192.168.1.198
192.168.1.194
mkdir /data/elasticsearch/data/node1 -p
mkdir /data/elasticsearch/logs/node1 -p
chmod 777 -R /data
es01.yml
version: '3.4'
services:
  elasticsearch_node1:
    network_mode: host
    image: elasticsearch:7.5.1
    container_name: elasticsearch_node1
    restart: always
    privileged: true
    environment:
      - cluster.name=elasticsearch-cluster
      - node.name=node1
      - node.master=true
      - node.data=true
      - http.port:9200
      - transport.tcp.port:9300
      - bootstrap.memory_lock=true
      - search.max_buckets=100000000
      - http.cors.enabled=true
      - http.cors.allow-origin=*
      - cluster.initial_master_nodes=node1
      - "ES_JAVA_OPTS=-Xms5102m -Xmx5102m"
####### #如果是单台服务器
##### #- "discovery.zen.ping.unicast.hosts=elasticsearch_n0,elasticsearch_n1,elasticsearch_n2"
      - discovery.zen.ping.unicast.hosts=192.168.1.194,192.168.1.195,192.168.1.198
      - "discovery.zen.minimum_master_nodes=2"
      - discovery.zen.ping_timeout=120s
      - client.transport.ping_timeout=60s
      # 如果是拆分版,这条配置必须加上,指定当前节点访问的ip
      - network.publish_host=192.168.1.194
    ulimits:
      memlock:
        soft: -1
        hard: -1
    volumes:
      - /data/elasticsearch/data/node1:/usr/share/elasticsearch/data
      - /data/elasticsearch/logs/node1:/usr/share/elasticsearch/logs
    ports:
      - 9200:9200
      - 9300:9300
  kibana:
    network_mode: host
    image: kibana:7.5.1
    container_name: kibana
    ports:
      - 5601:5601
    volumes:
      - /etc/localtime:/etc/localtime
      - /opt/kibana.yml:/usr/share/kibana/config/kibana.yml:rw
    depends_on:
      - elasticsearch_node1
kibana.yml
## ** THIS IS AN AUTO-GENERATED FILE **
##
#
#  # Default Kibana configuration for docker target
server.name: kibana
server.host: "0.0.0.0"
#这里写你的es第一个node的地址
elasticsearch.hosts: [ "http://192.168.1.194:9200"]
xpack.monitoring.ui.container.elasticsearch.enabled: false
xpack.security.enabled: true
i18n.locale: zh-CN
192.168.1.195
mkdir /data/elasticsearch/data/node2 -p
mkdir /data/elasticsearch/logs/node2 -p
chmod 777 -R /data/
es02.yml
version: '3'
services:
  elasticsearch_node2:
    network_mode: host
    image: elasticsearch:7.5.1
    container_name: elasticsearch_node1
    restart: always
    privileged: true
    environment:
      - cluster.name=elasticsearch-cluster
      - node.name=node2
      - node.master=true
      - node.data=true
      - http.port:9200
      - transport.tcp.port:9300
      - bootstrap.memory_lock=true
      - search.max_buckets=100000000
      - http.cors.enabled=true
      - http.cors.allow-origin=*
      - discovery.seed_hosts=["192.168.1.194:9300","192.168.1.195:9300","192.168.1.198:9300"]
      - cluster.initial_master_nodes=node1,node2,node3
      - "ES_JAVA_OPTS=-Xms5120m -Xmx5120m"
####### #如果是单台服务器
##### #- "discovery.zen.ping.unicast.hosts=elasticsearch_n0,elasticsearch_n1,elasticsearch_n2"
      - discovery.zen.ping.unicast.hosts:["192.168.1.194:9300","192.168.1.195:9300","192.168.1.198:9300"]
      - discovery.zen.minimum_master_nodes:2
      - discovery.zen.ping_timeout=120s
      - client.transport.ping_timeout=60s
      # 如果是拆分版,这条配置必须加上,指定当前节点访问的ip
      - network.publish_host=192.168.1.195
    ulimits:
      memlock:
        soft: -1
        hard: -1
    volumes:
      - /data/elasticsearch/data/node2:/usr/share/elasticsearch/data
      - /data/elasticsearch/logs/node2:/usr/share/elasticsearch/logs
    ports:
      - 9200:9200
      - 9300:9300
192.168.1.198
mkdir /data/elasticsearch/data/node3 -p
mkdir /data/elasticsearch/logs/node3 -p
chmod 777 -R /data/
es03.yml
version: '3'
services:
  elasticsearch_node3:
    network_mode: host
    image: elasticsearch:7.5.1
    container_name: elasticsearch_node3
    restart: always
    privileged: true
    environment:
      - cluster.name=elasticsearch-cluster
      - node.name=node3
      - node.master=true
      - node.data=true
      - http.port:9200
      - transport.tcp.port:9300
      - bootstrap.memory_lock=true
      - search.max_buckets=100000000
      - http.cors.enabled=true
      - http.cors.allow-origin=*
      - cluster.initial_master_nodes=node1
      - "ES_JAVA_OPTS=-Xms5120m -Xmx5120m"
####### #如果是单台服务器
##### #- "discovery.zen.ping.unicast.hosts=elasticsearch_n0,elasticsearch_n1,elasticsearch_n2"
      - discovery.zen.ping.unicast.hosts=192.168.1.194,192.168.1.195,192.168.1.198
      - "discovery.zen.minimum_master_nodes=2"
      - discovery.zen.ping_timeout=120s
      - client.transport.ping_timeout=60s
      # 如果是拆分版,这条配置必须加上,指定当前节点访问的ip
      - network.publish_host=192.168.1.198
    ulimits:
      memlock:
        soft: -1
        hard: -1
    volumes:
      - /data/elasticsearch/data/node3:/usr/share/elasticsearch/data
      - /data/elasticsearch/logs/node3:/usr/share/elasticsearch/logs
    ports:
      - 9200:9200
      - 9300:9300
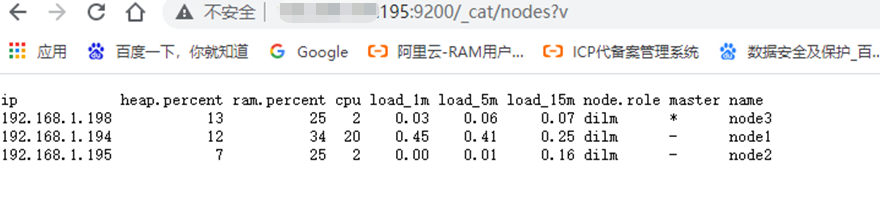
http://122.226.100.194:9200/_cat/health?v
http://122.226.100.194:9200/_cat/nodes?v
http://122.226.100.194:9200/_cluster/stats?pretty
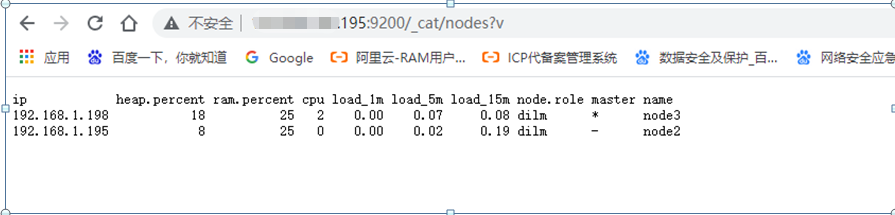
测试,把192.168.1.194 节点关掉
http://122.226.100.195:9200/_cat/nodes?v
启动194节点,过一会
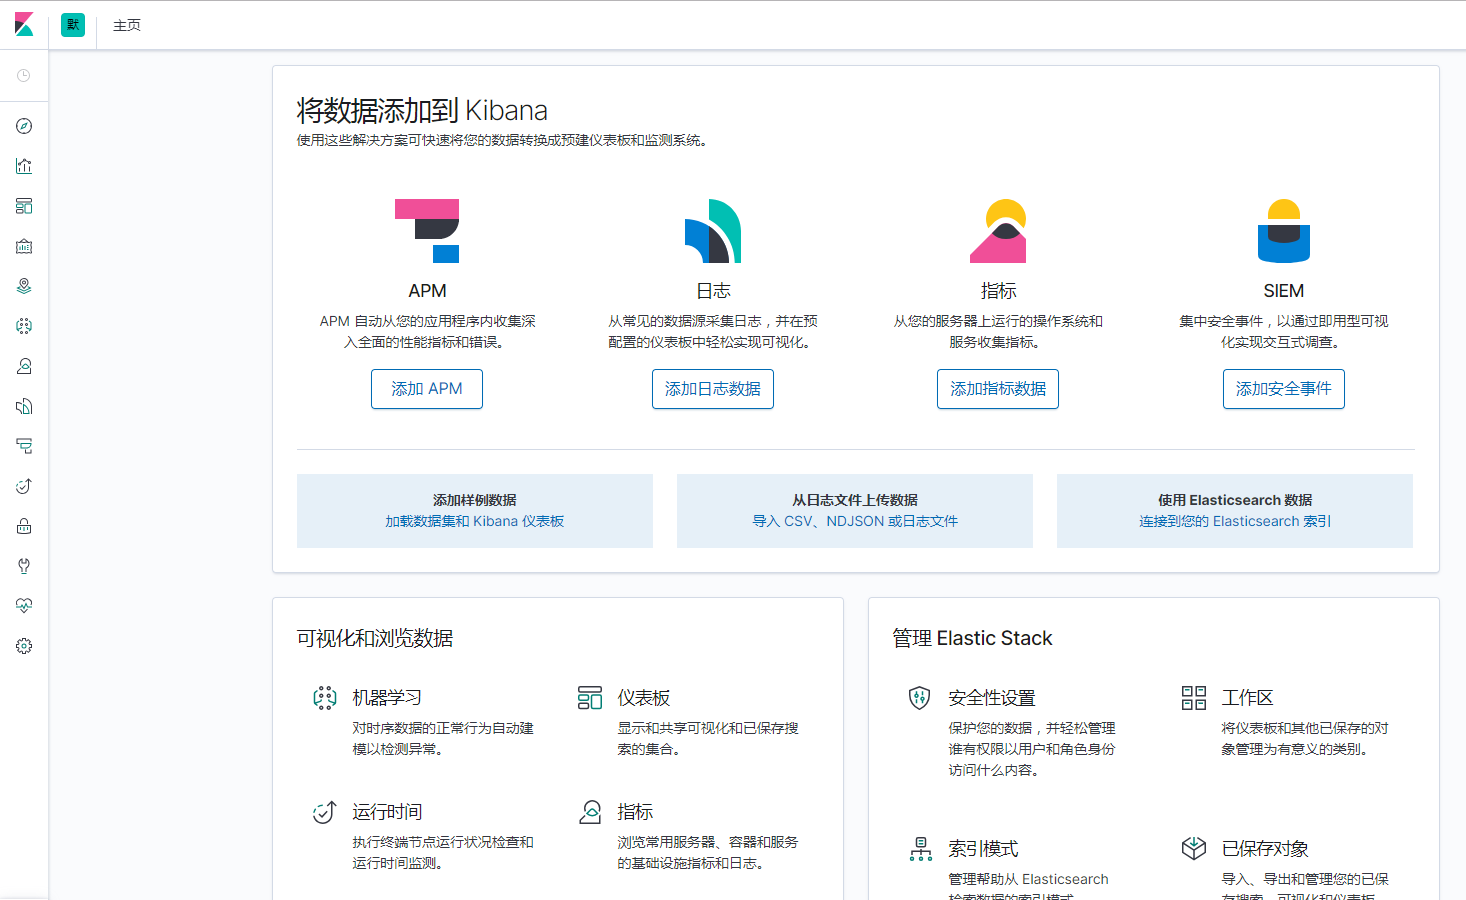
kibana
使用Nginx为Elasticsearch集群做负载均衡及安全控制
安装htpasswd,如果没有,则手动安装
yum install -y httpd-tools
生成/opt/htpasswd文件,用户命名密码文件
htpasswd -b -c htpasswd admin 123456
nginx配置代理
es-cluster.conf
upstream es-cluster.xx.com{
ip_hash;
server 192.168.1.194:9200 max_fails=2 fail_timeout=2s;
server 192.168.1.195:9200 max_fails=2 fail_timeout=2s;
server 192.168.1.198:9200 max_fails=2 fail_timeout=2s;
keepalive 3000;
}

server {
listen 80;
server_name es-cluster.xx.com;
access_log /var/log/nginx/es-cluster.xx.com.access.log;
error_log  /var/log/nginx/es-cluster.xx.com.error.log;

location / {
proxy_pass http://es-cluster.xx.com;
proxy_http_version 1.1;
proxy_set_header Upgrade $http_upgrade;
proxy_set_header Connection "upgrade";
proxy_set_header X-Real-IP $remote_addr;
proxy_set_header Host $host;
proxy_set_header X-Forwarded-For $proxy_add_x_forwarded_for;
auth_basic  "login";
auth_basic_user_file /opt/htpasswd;

}
}
kibana 用户密码登录和上面一样
定时清理ES文件
https://blog.csdn.net/u014526891/article/details/102919650
参考:
https://www.cnblogs.com/xiaofengxzzf/p/12580438.html
https://segmentfault.com/a/1190000018606414
https://www.cnblogs.com/dalianpai/p/12701635.html
https://blog.csdn.net/qq_38011415/article/details/111129089
https://priesttomb.github.io/%E6%96%B9%E6%A1%88%E8%AE%BE%E8%AE%A1%E5%AE%9E%E8%B7%B5/2019/06/22/elasticsearch_with_nginx_auth_basic/
https://www.cnblogs.com/qinsilandiao/p/13634957.html
多机多节点分布式集群7.15.0(带有账户、权限管理功能)
node1
elasticsearch_node1.yml
version: '3.4'
services:
  elasticsearch_node1:
    network_mode: host
    image: docker.elastic.co/elasticsearch/elasticsearch:7.15.0
    container_name: elasticsearch_node1
    restart: always
    privileged: true
    environment:
      - cluster.name=elasticsearch-cluster
      - node.name=node1
      - node.master=true
      - node.data=true
      - http.port:9200
      - transport.tcp.port:9300
      - TZ=Asia/Shanghai
      - bootstrap.memory_lock=true
      - xpack.security.enabled=true
      - xpack.security.transport.ssl.enabled=true
      - xpack.security.transport.ssl.keystore.type=PKCS12
      - xpack.security.transport.ssl.verification_mode=certificate
      - xpack.security.transport.ssl.keystore.path=elastic-certificates.p12
      - xpack.security.transport.ssl.truststore.path=elastic-certificates.p12
      - xpack.security.transport.ssl.truststore.type=PKCS12
      - xpack.security.audit.enabled=true
      - search.max_buckets=100000000
      - http.cors.enabled=true
      - http.cors.allow-origin=*
      - cluster.initial_master_nodes=node1
      - "ES_JAVA_OPTS=-Xms512m -Xmx512m"
####### #如果是单台服务器
##### #- "discovery.zen.ping.unicast.hosts=elasticsearch_n0,elasticsearch_n1,elasticsearch_n2"
      - discovery.zen.ping.unicast.hosts=192.168.1.194,192.168.1.195,192.168.1.198
      - "discovery.zen.minimum_master_nodes=2"
      - discovery.zen.ping_timeout=120s
      - client.transport.ping_timeout=60s
      # 如果是拆分版,这条配置必须加上,指定当前节点访问的ip
      - network.publish_host=192.168.1.194
    ulimits:
      memlock:
        soft: -1
        hard: -1
    volumes:
      - /data/elasticsearch/data/node1:/usr/share/elasticsearch/data
      - /data/elasticsearch/logs/node1:/usr/share/elasticsearch/logs
      - /data/elasticsearch/elastic-certificates.p12:/usr/share/elasticsearch/config/elastic-certificates.p12
    ports:
      - 9200:9200
      - 9300:9300


  kibana:
    network_mode: host
    image: docker.elastic.co/kibana/kibana:7.15.0
    container_name: kibana
    restart: always
    ports:
      - 5601:5601
    volumes:
      - /etc/localtime:/etc/localtime
      - /opt/kibana.yml:/usr/share/kibana/config/kibana.yml:rw
    depends_on:
      - elasticsearch_node1
kibana.yml
#
## ** THIS IS AN AUTO-GENERATED FILE **
##
#
#  # Default Kibana configuration for docker target
server.name: kibana
server.host: "0.0.0.0"
#这里写你的es第一个node的地址
elasticsearch.hosts: [ "http://192.168.1.194:9200"]
xpack.monitoring.ui.container.elasticsearch.enabled: true
xpack.security.enabled: true
elasticsearch.username: "elastic"            ####我提前设置好了,可以在ES自动创建完密码之后再创建kibana
elasticsearch.password: "xxxxxo0juNJr6O"     #####
i18n.locale: zh-CN
node2
elasticsearch_node2.yml
version: '3.4'
services:
  elasticsearch_node2:
    network_mode: host
    image: docker.elastic.co/elasticsearch/elasticsearch:7.15.0
    container_name: elasticsearch_node2
    restart: always
    privileged: true
    environment:
      - cluster.name=elasticsearch-cluster
      - node.name=node2
      - node.master=true
      - node.data=true
      - http.port:9200
      - transport.tcp.port:9300
      - TZ=Asia/Shanghai
      - bootstrap.memory_lock=true
      - xpack.security.enabled=true
      - xpack.security.transport.ssl.enabled=true
      - xpack.security.transport.ssl.keystore.type=PKCS12
      - xpack.security.transport.ssl.verification_mode=certificate
      - xpack.security.transport.ssl.keystore.path=elastic-certificates.p12
      - xpack.security.transport.ssl.truststore.path=elastic-certificates.p12
      - xpack.security.transport.ssl.truststore.type=PKCS12
      - xpack.security.audit.enabled=true
      - search.max_buckets=100000000
      - http.cors.enabled=true
      - http.cors.allow-origin=*
      - cluster.initial_master_nodes=node1
      - "ES_JAVA_OPTS=-Xms5102m -Xmx5102m"
####### #如果是单台服务器
##### #- "discovery.zen.ping.unicast.hosts=elasticsearch_n0,elasticsearch_n1,elasticsearch_n2"
      - discovery.zen.ping.unicast.hosts=192.168.1.194,192.168.1.195,192.168.1.198
      - "discovery.zen.minimum_master_nodes=2"
      - discovery.zen.ping_timeout=120s
      - client.transport.ping_timeout=60s
      # 如果是拆分版,这条配置必须加上,指定当前节点访问的ip
      - network.publish_host=192.168.1.195
    ulimits:
      memlock:
        soft: -1
        hard: -1
    volumes:
      - /data/elasticsearch/data/node1:/usr/share/elasticsearch/data
      - /data/elasticsearch/logs/node1:/usr/share/elasticsearch/logs
      - /data/elasticsearch/elastic-certificates.p12:/usr/share/elasticsearch/config/elastic-certificates.p12
    ports:
      - 9200:9200
      - 9300:9300
node3
elasticsearch_node3.yml
version: '3.4'
services:
  elasticsearch_node3:
    network_mode: host
    image: docker.elastic.co/elasticsearch/elasticsearch:7.15.0
    container_name: elasticsearch_node3
    restart: always
    privileged: true
    environment:
      - cluster.name=elasticsearch-cluster
      - node.name=node3
      - node.master=true
      - node.data=true
      - http.port:9200
      - transport.tcp.port:9300
      - TZ=Asia/Shanghai
      - bootstrap.memory_lock=true
      - xpack.security.enabled=true
      - xpack.security.transport.ssl.enabled=true
      - xpack.security.transport.ssl.keystore.type=PKCS12
      - xpack.security.transport.ssl.verification_mode=certificate
      - xpack.security.transport.ssl.keystore.path=elastic-certificates.p12
      - xpack.security.transport.ssl.truststore.path=elastic-certificates.p12
      - xpack.security.transport.ssl.truststore.type=PKCS12
      - xpack.security.audit.enabled=true
      - search.max_buckets=100000000
      - http.cors.enabled=true
      - http.cors.allow-origin=*
      - cluster.initial_master_nodes=node1
      - "ES_JAVA_OPTS=-Xms5102m -Xmx5102m"
####### #如果是单台服务器
##### #- "discovery.zen.ping.unicast.hosts=elasticsearch_n0,elasticsearch_n1,elasticsearch_n2"
      - discovery.zen.ping.unicast.hosts=192.168.1.194,192.168.1.195,192.168.1.198
      - "discovery.zen.minimum_master_nodes=2"
      - discovery.zen.ping_timeout=120s
      - client.transport.ping_timeout=60s
      # 如果是拆分版,这条配置必须加上,指定当前节点访问的ip
      - network.publish_host=192.168.1.198
    ulimits:
      memlock:
        soft: -1
        hard: -1
    volumes:
      - /data/elasticsearch/data/node1:/usr/share/elasticsearch/data
      - /data/elasticsearch/logs/node1:/usr/share/elasticsearch/logs
      - /data/elasticsearch/elastic-certificates.p12:/usr/share/elasticsearch/config/elastic-certificates.p12
    ports:
      - 9200:9200
      - 9300:9300
1、生成证书elastic-certificates.p12
es提供了生成证书的工具elasticsearch-certutil,我们可以在docker实例中生成它,然后复制出来,后面统一使用。(以后别的环境也可以使用)
docker run -dit --name=es elasticsearch:7.15.0 /bin/bash
docker exec -it es /bin/bash
生成ca: elastic-stack-ca.p12
[root@25dee1848942 elasticsearch]# ./bin/elasticsearch-certutil ca
This tool assists you in the generation of X.509 certificates and certificate
signing requests for use with SSL/TLS in the Elastic stack.

The 'ca' mode generates a new 'certificate authority'
This will create a new X.509 certificate and private key that can be used
to sign certificate when running in 'cert' mode.

Use the 'ca-dn' option if you wish to configure the 'distinguished name'
of the certificate authority

By default the 'ca' mode produces a single PKCS#12 output file which holds:
  * The CA certificate
  * The CA's private key

If you elect to generate PEM format certificates (the -pem option), then the output will
be a zip file containing individual files for the CA certificate and private key

Please enter the desired output file [elastic-stack-ca.p12]:
Enter password for elastic-stack-ca.p12 :
再生成cert: elastic-certificates.p12
[root@25dee1848942 elasticsearch]# ./bin/elasticsearch-certutil cert --ca elastic-stack-ca.p12
This tool assists you in the generation of X.509 certificates and certificate
signing requests for use with SSL/TLS in the Elastic stack.

The 'cert' mode generates X.509 certificate and private keys.
复制出证书到各个节点的/data/elasticsearch/目录,并赋予777权限
删除刚才创建的es容器
docker stop es
docker rm es
2、生成密码es密码
启动es集群,在各个节点
docker-compose -f elasticsearch_node1.yml up -d
docker-compose -f elasticsearch_node2.yml up -d
docker-compose -f elasticsearch_node3.yml up -d
进入elasticsearch_node1容器
docker exec -it elasticsearch_node1 /bin/sh
生成密码用auto, 自己设置用 interactive
[root@cfeeab4bb0eb elasticsearch]# ./bin/elasticsearch-setup-passwords -h
Sets the passwords for reserved users

Commands
--------
auto - Uses randomly generated passwords
interactive - Uses passwords entered by a user

Non-option arguments:
command

Option       Description
------       -----------
-E <KeyValuePair> Configure a setting
-h, --help     Show help
-s, --silent    Show minimal output
-v, --verbose   Show verbose output

[root@cfeeab4bb0eb elasticsearch]# ./bin/elasticsearch-setup-passwords auto
Initiating the setup of passwords for reserved users elastic,apm_system,kibana,logstash_system,beats_system,remote_monitoring_user.
The passwords will be randomly generated and printed to the console.
Please confirm that you would like to continue [y/N]y

Changed password for user apm_system
PASSWORD apm_system = xxx

Changed password for user kibana
PASSWORD kibana = xxxx

Changed password for user logstash_system
PASSWORD logstash_system = xxx

Changed password for user beats_system
PASSWORD beats_system = xxx

Changed password for user remote_monitoring_user
PASSWORD remote_monitoring_user = xxx

Changed password for user elastic
PASSWORD elastic = xxxx
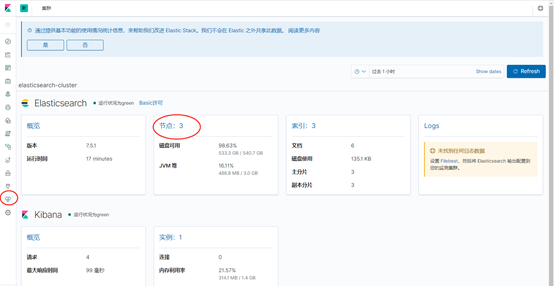
使用elastic账户登录ES和kibana
3、metricbeat监控
node1
curl -L -O https://artifacts.elastic.co/downloads/beats/metricbeat/metricbeat-7.15.0-linux-x86_64.tar.gz
tar xzvf metricbeat-7.15.0-linux-x86_64.tar.gz
mv metricbeat-7.15.0-linux-x86_64 metricbeat-7.15.0
cd metricbeat-7.15.0
vi -b metricbeat.yml
###################### Metricbeat Configuration Example #######################

# This file is an example configuration file highlighting only the most common
# options. The metricbeat.reference.yml file from the same directory contains all the
# supported options with more comments. You can use it as a reference.
#
# You can find the full configuration reference here:
# https://www.elastic.co/guide/en/beats/metricbeat/index.html

# =========================== Modules configuration ============================

metricbeat.config.modules:
  # Glob pattern for configuration loading
  path: ${path.config}/modules.d/*.yml

  # Set to true to enable config reloading
  reload.enabled: false

  # Period on which files under path should be checked for changes
  #reload.period: 10s

# ======================= Elasticsearch template setting =======================

setup.template.settings:
  index.number_of_shards: 1
  index.codec: best_compression
  #_source.enabled: false


# ================================== General ===================================

# The name of the shipper that publishes the network data. It can be used to group
# all the transactions sent by a single shipper in the web interface.
#name:

# The tags of the shipper are included in their own field with each
# transaction published.
#tags: ["service-X", "web-tier"]

# Optional fields that you can specify to add additional information to the
# output.
#fields:
#  env: staging

# ================================= Dashboards =================================
# These settings control loading the sample dashboards to the Kibana index. Loading
# the dashboards is disabled by default and can be enabled either by setting the
# options here or by using the `setup` command.
setup.dashboards.enabled: true

# The URL from where to download the dashboards archive. By default this URL
# has a value which is computed based on the Beat name and version. For released
# versions, this URL points to the dashboard archive on the artifacts.elastic.co
# website.
#setup.dashboards.url:

# =================================== Kibana ===================================

# Starting with Beats version 6.0.0, the dashboards are loaded via the Kibana API.
# This requires a Kibana endpoint configuration.
setup.kibana:

  # Kibana Host
  # Scheme and port can be left out and will be set to the default (http and 5601)
  # In case you specify and additional path, the scheme is required: http://localhost:5601/path
  # IPv6 addresses should always be defined as: https://[2001:db8::1]:5601
 host: "192.168.1.194:5601"

  # Kibana Space ID
  # ID of the Kibana Space into which the dashboards should be loaded. By default,
  # the Default Space will be used.
  #space.id:

# =============================== Elastic Cloud ================================

# These settings simplify using Metricbeat with the Elastic Cloud (https://cloud.elastic.co/).

# The cloud.id setting overwrites the `output.elasticsearch.hosts` and
# `setup.kibana.host` options.
# You can find the `cloud.id` in the Elastic Cloud web UI.
#cloud.id:

# The cloud.auth setting overwrites the `output.elasticsearch.username` and
# `output.elasticsearch.password` settings. The format is `<user>:<pass>`.
#cloud.auth:

# ================================== Outputs ===================================

# Configure what output to use when sending the data collected by the beat.

# ---------------------------- Elasticsearch Output ----------------------------
output.elasticsearch:
  # Array of hosts to connect to.
  hosts: ["192.168.1.194:9200"]

  # Protocol - either `http` (default) or `https`.
  #protocol: "https"

  # Authentication credentials - either API key or username/password.
  #api_key: "id:api_key"
  username: "elastic"
  password: "xxxx"

# ------------------------------ Logstash Output -------------------------------
#output.logstash:
  # The Logstash hosts
  #hosts: ["localhost:5044"]

  # Optional SSL. By default is off.
  # List of root certificates for HTTPS server verifications
  #ssl.certificate_authorities: ["/etc/pki/root/ca.pem"]

  # Certificate for SSL client authentication
  #ssl.certificate: "/etc/pki/client/cert.pem"

  # Client Certificate Key
  #ssl.key: "/etc/pki/client/cert.key"

# ================================= Processors =================================

# Configure processors to enhance or manipulate events generated by the beat.

processors:
  - add_host_metadata: ~
  - add_cloud_metadata: ~
  - add_docker_metadata: ~
  - add_kubernetes_metadata: ~


# ================================== Logging ===================================

# Sets log level. The default log level is info.
# Available log levels are: error, warning, info, debug
#logging.level: debug

# At debug level, you can selectively enable logging only for some components.
# To enable all selectors use ["*"]. Examples of other selectors are "beat",
# "publisher", "service".
#logging.selectors: ["*"]

# ============================= X-Pack Monitoring ==============================
# Metricbeat can export internal metrics to a central Elasticsearch monitoring
# cluster.  This requires xpack monitoring to be enabled in Elasticsearch.  The
# reporting is disabled by default.

# Set to true to enable the monitoring reporter.
#monitoring.enabled: false

# Sets the UUID of the Elasticsearch cluster under which monitoring data for this
# Metricbeat instance will appear in the Stack Monitoring UI. If output.elasticsearch
# is enabled, the UUID is derived from the Elasticsearch cluster referenced by output.elasticsearch.
#monitoring.cluster_uuid:

# Uncomment to send the metrics to Elasticsearch. Most settings from the
# Elasticsearch output are accepted here as well.
# Note that the settings should point to your Elasticsearch *monitoring* cluster.
# Any setting that is not set is automatically inherited from the Elasticsearch
# output configuration, so if you have the Elasticsearch output configured such
# that it is pointing to your Elasticsearch monitoring cluster, you can simply
# uncomment the following line.
#monitoring.elasticsearch:

# ============================== Instrumentation ===============================

# Instrumentation support for the metricbeat.
#instrumentation:
    # Set to true to enable instrumentation of metricbeat.
    #enabled: false

    # Environment in which metricbeat is running on (eg: staging, production, etc.)
    #environment: ""

    # APM Server hosts to report instrumentation results to.
    #hosts:
    #  - http://localhost:8200

    # API Key for the APM Server(s).
    # If api_key is set then secret_token will be ignored.
    #api_key:

    # Secret token for the APM Server(s).
    #secret_token:


# ================================= Migration ==================================

# This allows to enable 6.7 migration aliases
#migration.6_to_7.enabled: true
./metricbeat modules enable elasticsearch-xpack
./metricbeat modules enable kibana
./metricbeat modules enable system
./metricbeat setup
后台运行metricbeat
nohup /opt/metricbeat-7.15.0/metricbeat -c /opt/metricbeat-7.15.0/metricbeat.yml -d "publish" & > nohup.out
其他节点自行修改
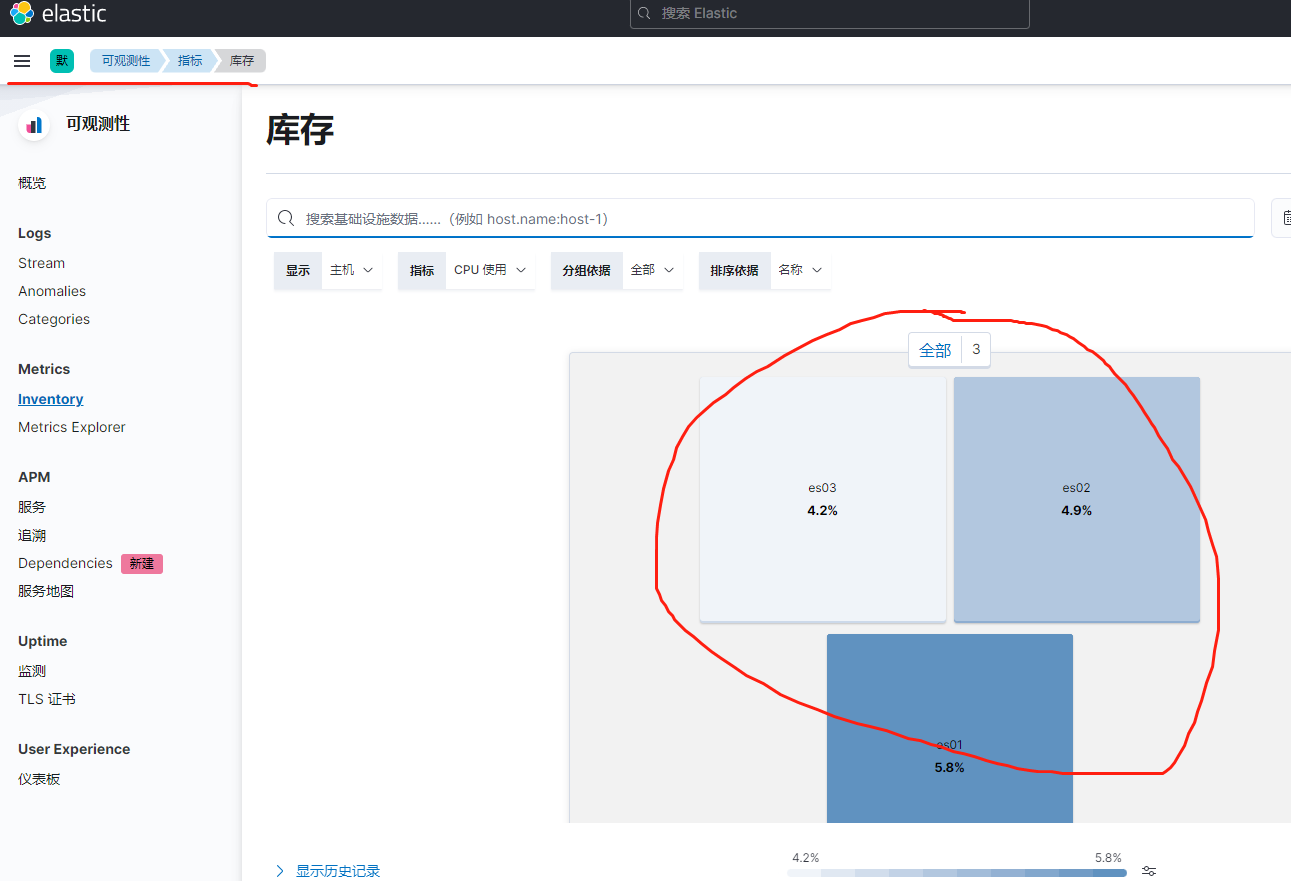
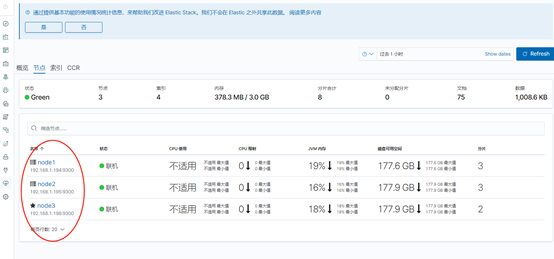
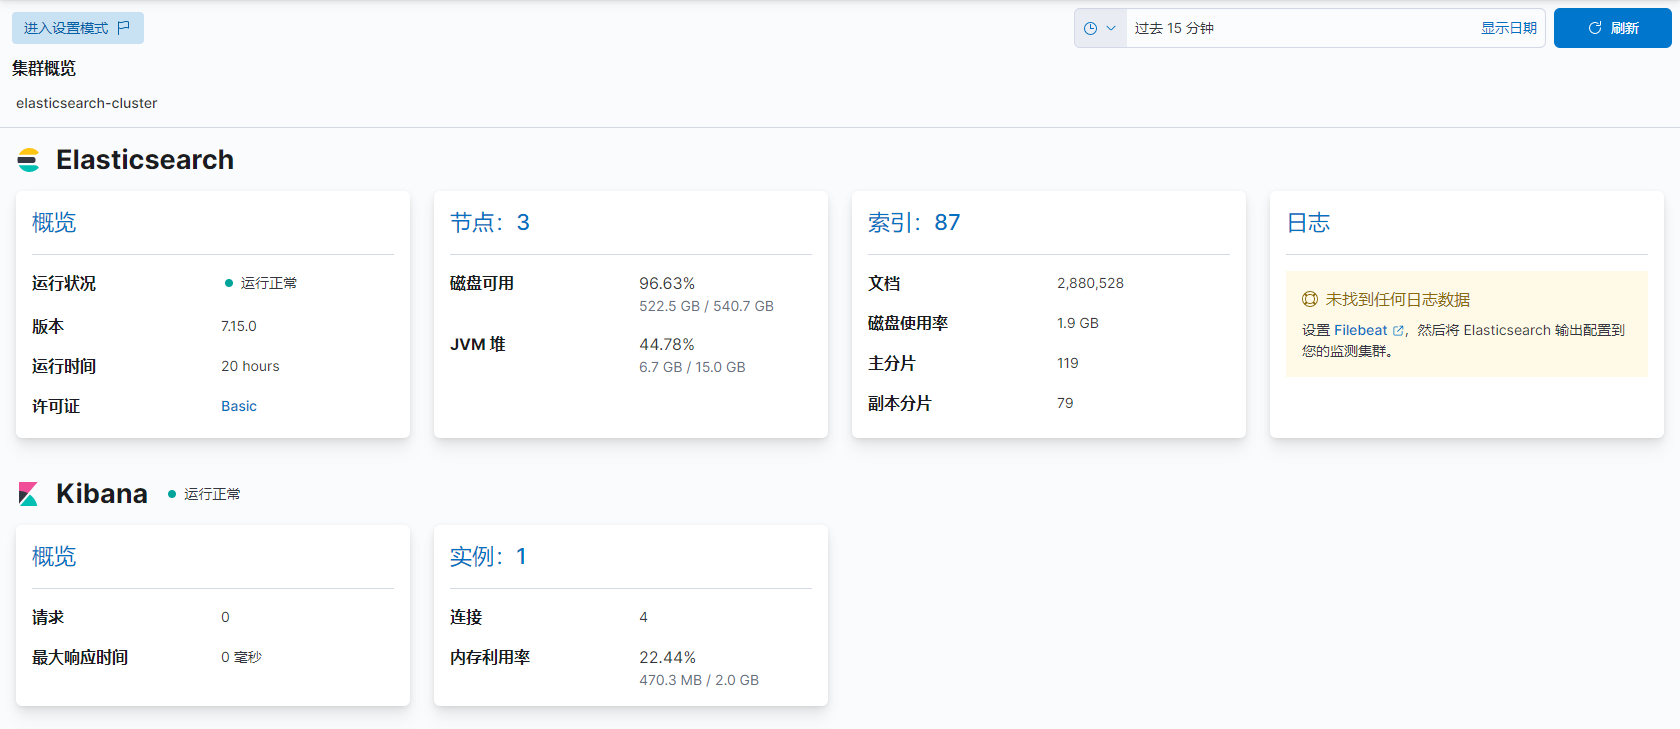
查看堆栈检测的监控,开启“内部检测”
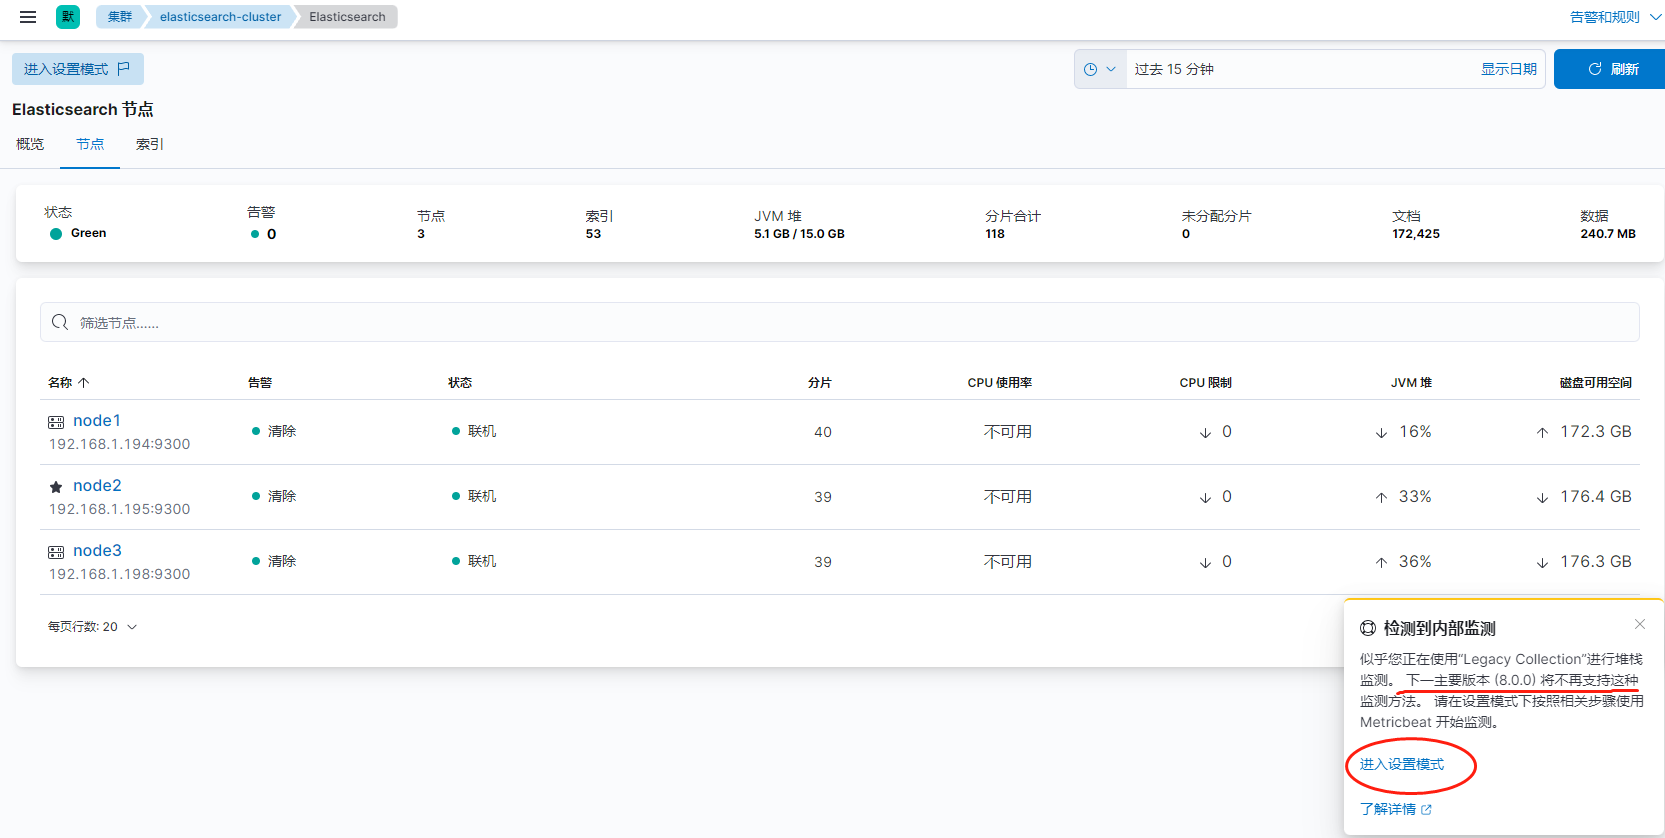
kubernets安装ECK17.5.2
环境: 数据存储在K8S的node节点上,
本次选定三个节点(ES01 ES02 ES03)
准备:
(1)选定的节点上创建好标签和污点
kubernetes.io/hostname:es01 name:es
kubernetes.io/hostname:es02 name:es
kubernetes.io/hostname:es03 name:es
(2)三台主机创建本机目录/var/lib/container/es_data
搭建:
1、下载crds.yaml和operator.yaml,https://www.elastic.co/guide/en/cloud-on-k8s/current/k8s-deploy-eck.html
然后执行
kubectl apply -f crds.yaml
kubectl apply -f operator.yaml
或者
kubectl create -f https://download.elastic.co/downloads/eck/2.1.0/crds.yaml
kubectl apply -f https://download.elastic.co/downloads/eck/2.1.0/operator.yaml
查看创建的容器和日志
kubectl get pods -n elastic-system
kubectl -n elastic-system logs -f statefulset.apps/elastic-operator
2、创建PV,用于Elasticsearch存储
local-pv-es01.yaml
apiVersion: v1
kind: PersistentVolume
metadata:
  name: pv-es01
spec:
  capacity:
    storage: 200Gi
  volumeMode: Filesystem
  accessModes:
  - ReadWriteOnce
  persistentVolumeReclaimPolicy: Delete
  storageClassName: local-storage
  local:
    path: /var/lib/container/es_data
  nodeAffinity:
    required:
      nodeSelectorTerms:
      - matchExpressions:
        - key: kubernetes.io/hostname
          operator: In
          values:
          - es01
local-pv-es02.yaml
apiVersion: v1
kind: PersistentVolume
metadata:
  name: pv-es02
spec:
  capacity:
    storage: 200Gi
  volumeMode: Filesystem
  accessModes:
  - ReadWriteOnce
  persistentVolumeReclaimPolicy: Delete
  storageClassName: local-storage
  local:
    path: /var/lib/container/es_data
  nodeAffinity:
    required:
      nodeSelectorTerms:
      - matchExpressions:
        - key: kubernetes.io/hostname
          operator: In
          values:
          - es02
local-pv-es03.yaml
apiVersion: v1
kind: PersistentVolume
metadata:
  name: pv-es03
spec:
  capacity:
    storage: 200Gi
  volumeMode: Filesystem
  accessModes:
  - ReadWriteOnce
  persistentVolumeReclaimPolicy: Delete
  storageClassName: local-storage
  local:
    path: /var/lib/container/es_data
  nodeAffinity:
    required:
      nodeSelectorTerms:
      - matchExpressions:
        - key: kubernetes.io/hostname
          operator: In
          values:
          - es03
上面定义的local 字段,指定了它是一个 Local Persistent Volume;而 path 字段,指定的正是这个 PV 对应的本地磁盘的路径,即:/var/lib/container/es_data 。而这个磁盘存在与ES01节点上,也就意味着 Pod使用这个 PV就必须运行在 ES01上。所以nodeAffinity 字段就指定 ES01 这个节点的名字,声明PV与节点的对应关系。这正是 Kubernetes 实现“在调度的时候就考虑 Volume 分布”的主要方法
kubectl  create -f local-pv-es01.yaml
kubectl  create -f local-pv-es02.yaml
kubectl  create -f local-pv-es03.yaml
查看创建的PV
kubectl get pv

3、创建Elasticsearch对象,并使用本地路径存储日志
es.yaml
apiVersion: elasticsearch.k8s.elastic.co/v1
kind: Elasticsearch
metadata:
  name: elastic
  namespace: public-service
spec:
  version: 7.15.2
  http:
    tls:
      selfSignedCertificate:
        disabled: true
# 关闭https,使用http进行访问,否则需要提供证书,具体操作参考官方文档
  nodeSets:
  - name: default
    count: 3
    podTemplate:
      spec:
        containers:
        - name: elasticsearch
          env:
          - name: ES_JAVA_OPTS
            value: -Xms2g -Xmx2g
          resources:
            requests:
              memory: 4Gi
              cpu: 0.5
            limits:
              memory: 4Gi
              cpu: 2
        nodeSelector:
          name: es
        tolerations:
          - effect: NoSchedule
            key: public
            operator: Equal
            value: public
    config:
      node.master: true
      node.data: true
      node.ingest: true
      node.store.allow_mmap: false
    volumeClaimTemplates:
    - metadata:
        name: elasticsearch-data
      spec:
        accessModes:
        - ReadWriteOnce

# 选定local-storage为storage class,自动绑定上一步创建的pv
        storageClassName: "local-storage"
        resources:
          requests:
            storage: 200Gi
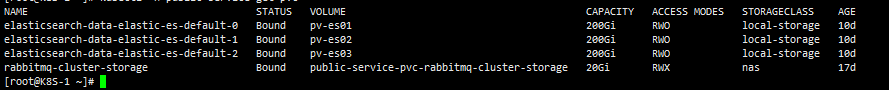
查看自动绑定的PVC
kubectl -n public-service get pvc
4、创建kibana对象,并连接到创建的elasticsearch对象
kibana.yaml
apiVersion: kibana.k8s.elastic.co/v1
kind: Kibana
metadata:
  name: elastic
  namespace: public-service
spec:
  version: 7.15.2
  image: docker.elastic.co/kibana/kibana:7.15.2
  count: 1
  elasticsearchRef:
    name: elastic
  http:
    tls:
      selfSignedCertificate:
        disabled: true
  podTemplate:
    spec:
      containers:
      - name: kibana
        env:
        - name: I18N_LOCALE
          value: zh-CN
        resources:
          requests:
            memory: 1Gi
          limits:
            memory: 2Gi
        volumeMounts:
        - name: timezone-volume
          mountPath: /etc/localtime
          readOnly: true
      volumes:
      - name: timezone-volume
        hostPath:
          path: /usr/share/zoneinfo/Asia/Shanghai
5、通过ingress暴露kibana服务
kubectl create -f ingress.yaml
ingress-kibana.yaml
apiVersion: networking.k8s.io/v1
kind: Ingress
metadata:
  name: kibana
  namespace: public-service
  annotations:
    nginx.ingress.kubernetes.io/proxy-body-size: "20M"
spec:
  ingressClassName: nginx
  rules:
    - host: xx.com
      http:
        paths:
          - backend:
              service:
                name: elastic-kb-http
                port:
                  number: 5601
            path: /
            pathType: ImplementationSpecific
6、查看kibana的密码
kubectl -n logging get secret es-eyecool-es-elastic-user -o=jsonpath='{.data.elastic}' | base64 --decode; echo
参考:
https://www.zhangshengrong.com/p/On1vqW2JXy/
https://gobea.cn/blog/detail/KodEdv6b.html
监控后台运行
https://blog.csdn.net/weixin_41905537/article/details/103404153
docker 部署 elasticsearch后 修改其java堆最大可用内存 ES_JAVA_OPTS 参数
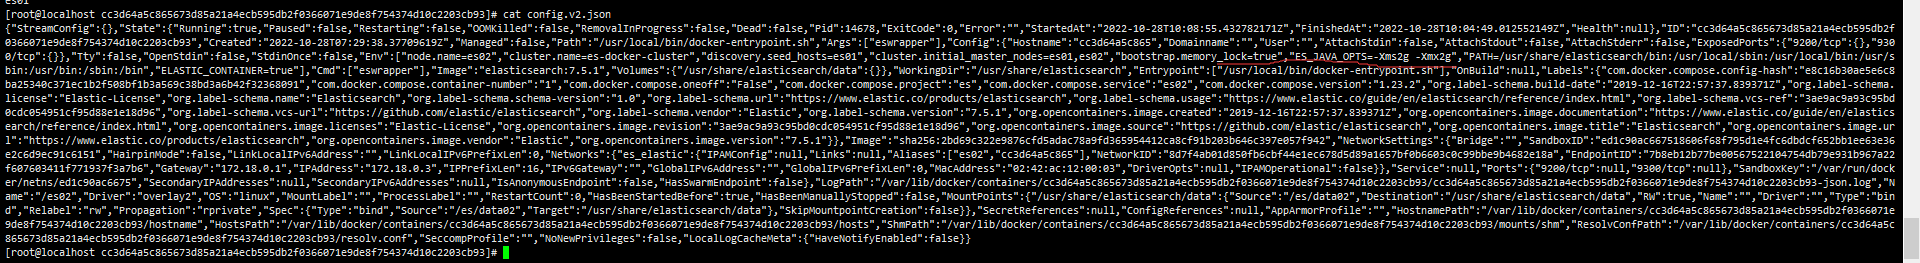
1、停止docker服务
systemctl stop docker
2、进入到相关的容器节点目录
3、修改config.v2.json文件中的ES_JAVA_OPTS参数
4、启动容器
查看es版本
http://xx.xx.xx.xx:9200/
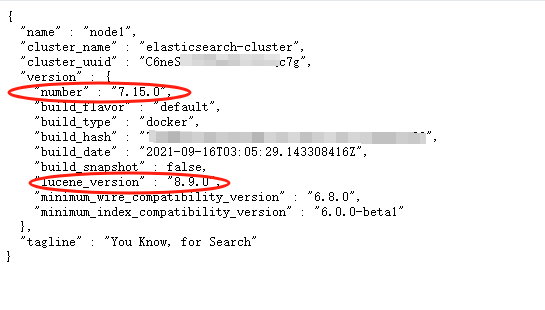
number : 是 es 的版本
lucene_version : 是 lucene 的版本
参考:
https://blog.csdn.net/weixin_42744142/article/details/125263709

 浙公网安备 33010602011771号