- CPU
- MEMORY
- IO
- NETWORK
- LINUX进程内存占用查看方法
系统负载过重时往往会引起其它子系统的问题,比如:
- 大量的读入内存的IO请求(page-in IO)会用完内存队列;
- 大量的网络流量会造成CPU的过载;
- CPU的高使用率可能正在处理空闲内存队列;
- 大量的磁盘读写会消耗CPU和IO资源。
我们测试的系统,总的来说可分为二类:
第一,IO Bound,这类系统会大量消耗内存和底层的存储系统,它并不消耗过多的CPU和网络资源(除非系统是网络的)。IO bound系统消耗CPU资源用来接受IO请求,然后会进入休眠状态。数据库通常被认为是IO bound系统。
第二,CPU Bound,这类系统需要消耗大量的CPU资源。他们往往进行大量的数学计算。高吞吐量的Web server,Mail Server通常被认为是CPU Bound系统。
在性能测试中首先要做的是建立基线(Baseline),这样后续的调整才会有一个参考标准。值得注意的是,在测试基线的时候,一定要保证系统工作在正常的状态下。
CPU
常用的监视工具有:mpstat,vmstat,top。
1.mpstat
mpstat是 Multiprocessor Statistics的缩写,是实时系统监控工具。其报告与CPU的一些统计信息,这些信息存放在/proc/stat文件中。在多CPUs系统里,其不但能查看所有CPU的平均状况信息,而且能够查看特定CPU的信息。下面只介绍 mpstat与CPU相关的参数,mpstat的语法如下:
mpstat [-P {cpu|ALL}] [internal [count]]
参数的含义如下:
| [参数] | [解释] |
| -P {cpu ALL} | 表示监控哪个CPU, cpu在[0,cpu个数-1]中取值 |
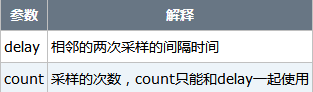
| internal | 相邻的两次采样的间隔时间 |
| count | 采样的次数,count只能和delay一起使用 |
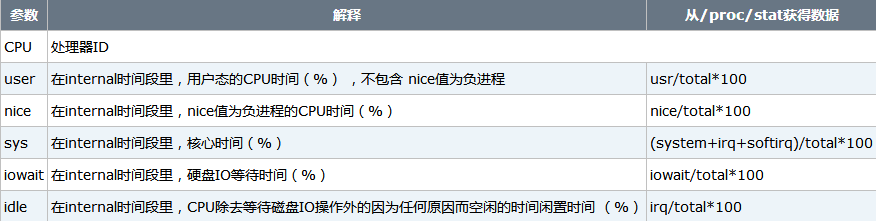
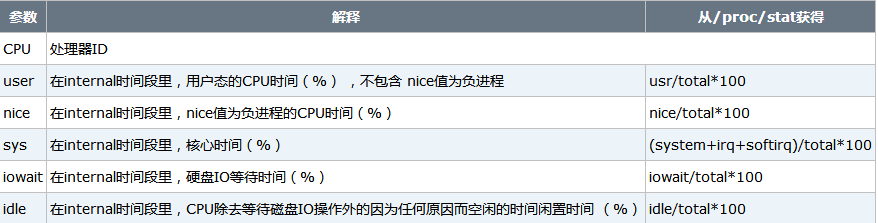
当没有参数时,mpstat则显示系统启动以后所有信息的平均值。有interval时,第一行的信息自系统启动以来的平均信息。从第二行开始,输出为前一个interval时间段的平均信息。与CPU有关的输出的含义如下:
CPU总的工作时间:
<div class="_2Uzcx_"><button class="VJbwyy" type="button" aria-label="复制代码"><i aria-label="icon: copy" class="anticon anticon-copy"><svg
			 viewBox="64 64 896 896" focusable="false" class="" data-icon="copy" width="1em" height="1em" fill="currentColor"
			 aria-hidden="true">
				<path d="M832 64H296c-4.4 0-8 3.6-8 8v56c0 4.4 3.6 8 8 8h496v688c0 4.4 3.6 8 8 8h56c4.4 0 8-3.6 8-8V96c0-17.7-14.3-32-32-32zM704 192H192c-17.7 0-32 14.3-32 32v530.7c0 8.5 3.4 16.6 9.4 22.6l173.3 173.3c2.2 2.2 4.7 4 7.4 5.5v1.9h4.2c3.5 1.3 7.2 2 11 2H704c17.7 0 32-14.3 32-32V224c0-17.7-14.3-32-32-32zM350 856.2L263.9 770H350v86.2zM664 888H414V746c0-22.1-17.9-40-40-40H232V264h432v624z"></path>
			</svg></i></button>
	<pre class="line-numbers  language-undefined"><code class="  language-undefined">total_cur = user + system + nice + idle + iowait + irq + softirq
total_pre = pre_user + pre_system + pre_nice + pre_idle + pre_iowait + pre_irq + pre_softirq
user = user_cur – user_pre
total = total_cur - total_pre
其中_cur 表示当前值,_pre表示interval时间前的值。上表中的所有值可取到两位小数点。
范例1 average mode (粗略信息)
当mpstat不带参数时,输出为从系统启动以来的平均值。
[work@jx-testing-ps1933.jx.baidu.com ~]$ mpstat

Linux 2.6.9-52bs (jx-testing-ps1933.jx.baidu.com) 07/30/2008

10:06:32 AM CPU %user %nice %system %iowait %irq %soft %idle intr/s

10:06:32 AM all 0.71 0.00 0.19 0.01 0.00 0.04 99.05 271.64
范例2 每2秒产生了4个处理器的统计数据报告
下面的命令可以每2秒产生了4个处理器的统计数据报告,一共产生三个interval 的信息,然后再给出这三个interval的平均信息。默认时,输出是按照CPU
号排序。第一个行给出了从系统引导以来的所有活跃数据。接下来每行对应一个处理器的活跃状态。
[work@jx-testing-ps1933.jx.baidu.com ~]$ mpstat -P ALL 2 3
Linux 2.6.9-52bs (jx-testing-ps1933.jx.baidu.com) 07/30/200810:11:04 AM CPU %user %nice %system %iowait %irq %soft %idle intr/s
10:11:06 AM all 0.00 0.00 0.00 0.00 0.00 0.00 100.00 1013.13
10:11:06 AM 0 0.00 0.00 0.00 0.00 0.00 0.00 100.00 253.54
10:11:06 AM 1 0.00 0.00 0.00 0.00 0.00 0.00 100.00 252.53
10:11:06 AM 2 0.00 0.00 0.00 0.00 0.00 0.00 100.00 254.55
10:11:06 AM 3 0.00 0.00 0.00 0.00 0.00 0.00 100.00 252.5310:11:06 AM CPU %user %nice %system %iowait %irq %soft %idle intr/s
10:11:08 AM all 0.00 0.00 0.00 0.00 0.00 0.00 100.00 1015.15
10:11:08 AM 0 0.00 0.00 0.00 0.00 0.00 0.00 100.00 252.53
10:11:08 AM 1 0.00 0.00 0.00 0.00 0.00 0.00 100.00 253.03
10:11:08 AM 2 0.00 0.00 0.00 0.00 0.00 0.00 99.49 257.58
10:11:08 AM 3 0.00 0.00 0.00 0.00 0.00 0.00 100.00 252.5310:11:08 AM CPU %user %nice %system %iowait %irq %soft %idle intr/s
10:11:10 AM all 0.00 0.00 0.00 0.00 0.00 0.00 100.00 1016.16
10:11:10 AM 0 0.00 0.00 0.00 0.00 0.00 0.00 100.00 252.53
10:11:10 AM 1 0.00 0.00 0.00 0.00 0.00 0.00 100.00 252.53
10:11:10 AM 2 0.00 0.00 0.00 0.00 0.00 0.00 100.00 258.08
10:11:10 AM 3 0.00 0.00 0.00 0.00 0.00 0.00 100.00 252.53
Average: CPU %user %nice %system %iowait %irq %soft %idle intr/s
Average: all 0.00 0.00 0.00 0.00 0.00 0.00 100.00 1014.81
Average: 0 0.00 0.00 0.00 0.00 0.00 0.00 100.00 252.86
Average: 1 0.00 0.00 0.00 0.00 0.00 0.00 100.00 252.69
Average: 2 0.00 0.00 0.00 0.00 0.00 0.00 99.83 256.73
Average: 3 0.00 0.00 0.00 0.00 0.00 0.00 100.00 252.53
2.vmstat
vmstat是Virtual Meomory Statistics(虚拟内存统计)的缩写,
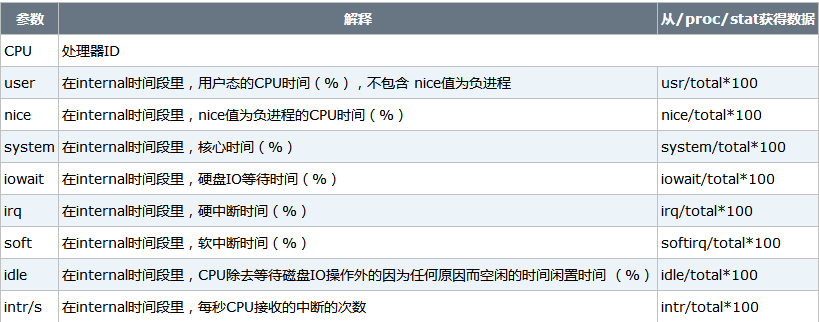
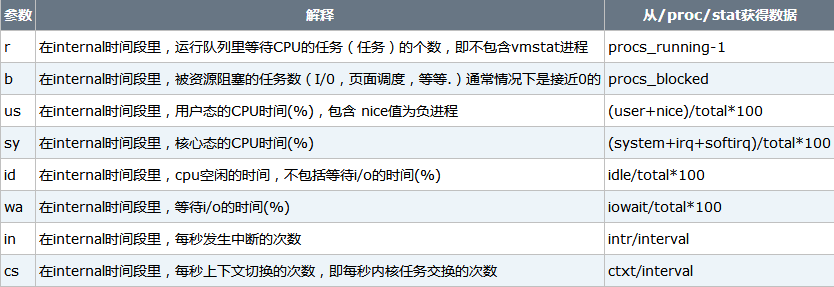
是实时系统监控工具。该命令通过使用knlist子程序和/dev/kmen伪设备驱动器访问这些数据,输出信息直接打印在屏幕。vmstat反馈的与CPU相关的信息包括:
(1)多少任务在运行
(2)CPU使用的情况
(3)CPU收到多少中断
(4)发生多少上下文切换
下面只介绍 Vmstat与CPU相关的参数
vmstat的语法如下:
vmstat [delay [count]]
参数的含义如下:
当没有参数时,vmstat则显示系统启动以后所有信息的平均值。有delay时,第一行的信息自系统启动以来的平均信息。从第二行开始,输出为前一个delay时间段的平均信息。当系统有多个CPU时,输出为所有CPU的平均值。
total_cur = user + system + nice + idle + iowait + irq + softirq

total_pre = pre_user + pre_system + pre_nice + pre_idle + pre_iowait + pre_irq + pre_softirq

total = total_cur - total_pre
3.iostat
iostat [-t] [-c] [interval [count]]
参数的含义如下:
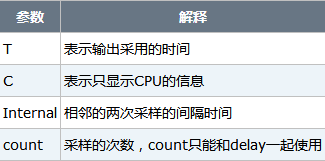
当没有参数时,iostat则显示系统启动以后所有信息的平均值。与CPU有关的输出的含义
total_cur = user + system + nice + idle + iowait + irq + softirq

total_pre = pre_user + pre_system + pre_nice + pre_idle + pre_iowait + pre_irq + pre_softirq

total = total_cur - total_pre
有interval时,第一行的信息自系统启动以来的平均信息。从第二行开始,输出为前一个interval时间段的平均信息。
示例1
[work@jx-testing-ps1933.jx.baidu.com ~]$ iostat -c 1
Linux 2.6.9-52bs (jx-testing-ps1933.jx.baidu.com) 07/30/2008avg-cpu: %user %nice %sys %iowait %idle
0.71 0.00 0.22 0.01 99.05avg-cpu: %user %nice %sys %iowait %idle
0.00 0.00 0.00 0.00 100.00
avg-cpu: %user %nice %sys %iowait %idle
0.00 0.00 0.00 0.00 100.00
4.sar
sar是System Activity
Reporter(系统活跃情况报告)的缩写。顾名思义,sar工具将对系统当前的状态进行采样,然后通过计算数据和比例来表达系统的当前运行状态。它的特点是可以连续对系统采样,获得大量的采样数据;采样数据和分析的结果都可以存入文件,所需的负载很小。这些是检查历史数据和一些近来的系统事件。sar
用于检查的性能数据类似于vmstat, mpstat和 iostat的显示。 sar的数据是一段时间保存的内容,因此可以察看过去的信息。
lastcomm可以现在系统最近被执行的命令。这些可以用在系统审计中。sar可以在*BSD和Linux中找到,它给用户在系统审计中更多的选项来收集信息。
在反馈CPU整体信息方面,sar 反馈的与CPU相关的信息包括:
(1)多少任务在运行
(2)CPU使用的情况
(3)CPU收到多少中断
(4)发生多少上下文切换
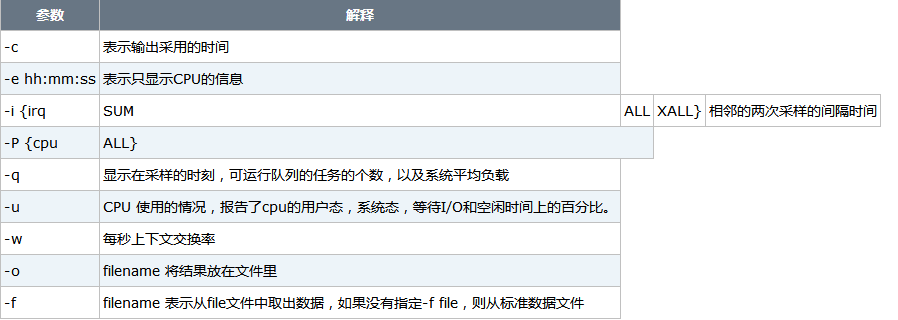
sar的语法如下:
sar [-options] [interval [count]]
其中,internal是两次采样的间隔时间;count是指采样的次数;与CPU相关的options有:
参数的含义如下:
范例
首先在后台运行一个创建2GB文件的任务,然后输入:“sar -c -q -w 3
2”,表示每3秒采样一次,采样两次,可以看到系统有58个任务,但是在10时47分01秒时有一个任务在运行,在下一次采样10时47分04秒时,没有任务在运行。
[work@jx-testing-ps1933.jx.baidu.com ~]$ dd if=/dev/zero of=./1.img bs=2048 count=1000000&
[1] 22332
[work@jx-testing-ps1933.jx.baidu.com ~]$ sar -c -q -w -I SUM 3 2
Linux 2.6.9-52bs (jx-testing-ps1933.jx.baidu.com) 07/30/2008
1000000+0 records in
1000000+0 records out10:46:58 AM proc/s
10:47:01 AM 0.0010:46:58 AM cswch/s
10:47:01 AM 166.4410:46:58 AM INTR intr/s
10:47:01 AM sum 1172.1510:46:58 AM runq-sz plist-sz ldavg-1 ldavg-5 ldavg-15
10:47:01 AM 1 58 0.04 0.01 0.0010:47:01 AM proc/s
10:47:04 AM 0.0010:47:01 AM cswch/s
10:47:04 AM 57.9110:47:01 AM INTR intr/s
10:47:04 AM sum 1142.0910:47:01 AM runq-sz plist-sz ldavg-1 ldavg-5 ldavg-15
10:47:04 AM 0 58 0.11 0.03 0.01Average: proc/s
Average: 0.00Average: cswch/s
Average: 112.27Average: INTR intr/s
Average: sum 1157.14
Average: runq-sz plist-sz ldavg-1 ldavg-5 ldavg-15
Average: 0 58 0.07 0.02 0.01
与CPU有关的输出的含义