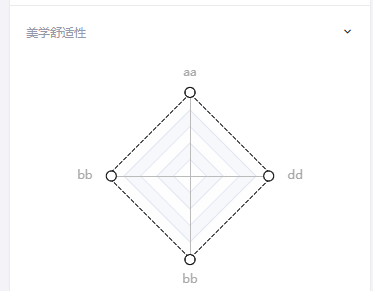
基于echarts实现可拖拽雷达图,不管多少个角标都可以实现效果
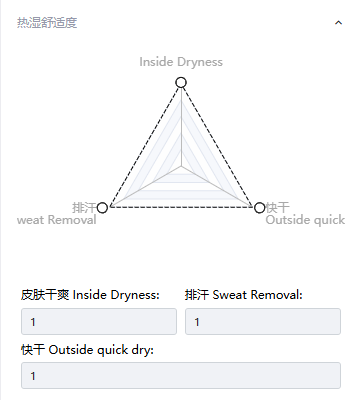
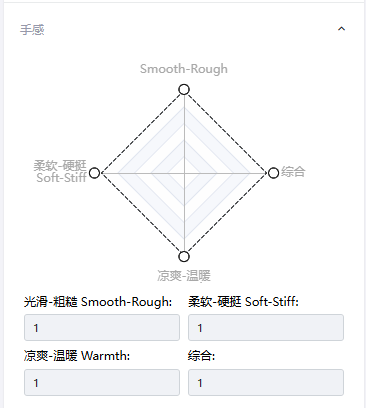
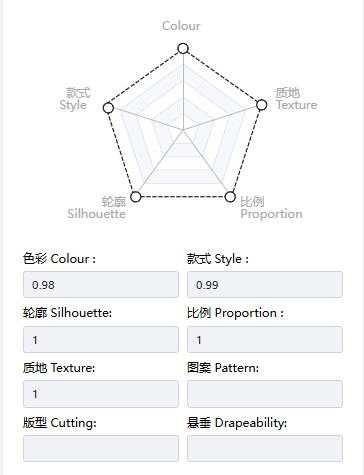
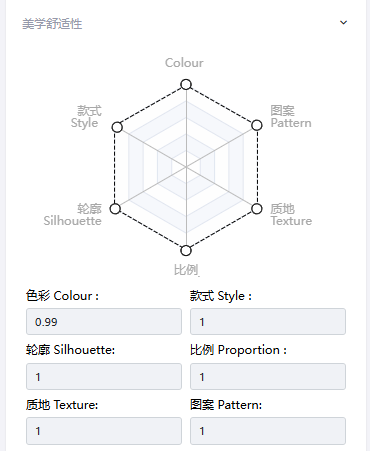
其中细节主要在于拖拽点的位置怎么来,角度以及拖拽后如何移动位置 以及如何沿着轴线拖动 不能随意拖动
直接上代码
import * as echarts from 'echarts';
// import i18n from "@/i18n"

function showTooltip(myChart, dataIndex) {
    myChart.dispatchAction({
        type: 'showTip',
        seriesIndex: 0,
        dataIndex: dataIndex
    });
}

function hideTooltip(myChart, dataIndex) {
    myChart.dispatchAction({
        type: 'hideTip',
        seriesIndex: 0,
        dataIndex: dataIndex
    });
}

const symbolSize = 10;
let maxNumber = 1
let minNumber = -1
/* point 上|左|下|右 */
// let data = [
//     [0, maxNumber],
//     [minNumber, 0],
//     [0, minNumber],
//     [maxNumber, 0]
// ];
let series;
let positions = {}
// function updateChartData(options, reset) {
//     series.push({
//         type: 'radar',
//         symbolSize: 0,
//         data: [{
//             // TODO:
//             value: options.detailData,
//             name: options.name,
//             label: {
//                 show: false,
//                 formatter: (params) => {
//                     return params.value;
//                 },
//                 color: '#000'
//             },
//             areaStyle: {
//                 color: options.color,
//                 opacity: 0.5
//             },
//             lineStyle: {
//                 width: 1,
//                 color: options.color
//             }
//         }]
//     })

//     let myChart = options.chartDom && echarts.init(options.chartDom);
//     setTimeout(function () {
//         if (reset) {
//             data = [
//                 [0, maxNumber],
//                 [minNumber, 0],
//                 [0, minNumber],
//                 [maxNumber, 0]
//             ];
//             initInvisibleGraphic(myChart, data, options.chartData, 10, options.color, options.type, options.width, options.height, options.name, options.calback)
//         }
//         initInvisibleGraphic(myChart, data, options.chartData, 10, options.color, options.type, options.width, options.height, options.name, options.calback)
//     }, 0);

// }

function onPointDragging(myChart, data, data1,  name, dataIndex, pos, position, e,) {
    let xxxxx = false
    if (xxxxx) {
        console.log(position);
        console.log(e);
    }

    const newPos = myChart.convertFromPixel('grid', pos); // 获取拖拽后的数据坐标
    let [x, y] = newPos;
    const distance = Math.sqrt(x * x + y * y);
    console.log(x, y);
    const newPos1 = myChart.convertFromPixel('grid', positions[dataIndex]); // 获取拖拽后的数据坐标
    const [xx, yy] = newPos1;
    console.log(xx, yy);
    const angle = Math.abs(180 / Math.PI * Math.atan2(x, y))
    const angle1 = Math.abs(180 / Math.PI * Math.atan2(xx, yy))
    console.log(angle);
    console.log(angle1);
    // 如果角度偏差太大  或者距离太大   或者 其中有一个是大余0
    if (Math.abs(angle - angle1) > 1 || distance > 1 || (xx >= 0 && x < 0) || (yy >= 0 && y < 0) || (xx <= 0 && x > 0) || (yy <= 0 && y > 0)) {
        data[dataIndex] = [xx, yy]; // 更新角标位置
        // data1[dataIndex] = Math.sqrt(xx * xx + yy * yy);
        e.target.x = positions[dataIndex][0];
        e.target.y = positions[dataIndex][1];
        console.log('偏差太大');
    } else {
        data[dataIndex] = [x, y]; // 更新角标位置
        data1[dataIndex] = Math.round(distance * 100) / 100; // 更新雷达图值
        positions[dataIndex] = pos; // 更新图形位置
    }


    // Update data

    myChart.setOption({
        series: [{
            type: 'line',
            smooth: true,
            lineStyle: {
                width: 0
            },
            symbolSize: 0,
            data: data
        },
        {
            type: 'radar',
            symbolSize: 0,
            data: [{
                // TODO:
                value: data1,
                name: name,
                label: {
                    show: false,
                    formatter: (params) => {
                        return params.value;
                    },
                    color: '#000'
                },
                lineStyle: {
                    type: 'dashed',
                    width: 1,
                    color: '#000'
                }
            }]
        }
        ]
    });
}

function initInvisibleGraphic(myChart, data, data1, symbolSize, type, name, calback) {
    if (myChart) {
        myChart.setOption({
            graphic: data.map(function (item, dataIndex) {
                let position = myChart.convertToPixel('grid', item)
                positions[dataIndex] = position; // 保存图形初始位置
                return {
                    type: 'circle',
                    position: position,
                    // name: nameLsit[dataIndex],
                    shape: {
                        cx: 0,
                        cy: 0,
                        r: symbolSize / 2
                    },
                    style: {
                        fill: "#fff",
                        stroke: '#000'
                    },
                    invisible: false,
                    draggable: true,
                    ondrag: function (e) {
                        // console.log('xy: ' + this.x + ', ' + this.y)
                        onPointDragging(myChart, data, data1, name, dataIndex, [this.x,
                        this.y
                        ], item, e, calback);
                    },
                    ondragend: () => {
                        /* 结束操作后|回调数据 */
                        calback && calback({
                            type: type,
                            data: data1
                        })
                    },
                    onmousemove: function () {
                        showTooltip(myChart, dataIndex);
                    },
                    onmouseout: function () {
                        hideTooltip(myChart, dataIndex);
                    },
                    z: 100
                };
            })
        });
    }
}
function generateInitialData(indicator) {
    const angleStep = (2 * Math.PI) / indicator.length;
    const data = [];
    const data1 = [];
    indicator.forEach((item, index) => {
        // 第一种
        const angle = 2 * Math.PI- ((index) * angleStep); // 计算每个角标对应的角度
         // 根据角度,生成非圆形顶点的坐标
         const x = Math.round(Math.sin(angle) * maxNumber * 10) / 10; // 四舍五入
         const y = Math.round(Math.cos(angle) * maxNumber * 10) / 10;
        data.push([x, y]);
        data1.push(item.name);
    });
    return { data, data1 };
}

// function getRadarVertices(myChart) {
//     const radar = myChart.getOption().radar[0];
//     const indicatorCount = radar.indicator.length;
//     const center = myChart.convertToPixel({ seriesIndex: 0 }, [0, 0]);  // 获取雷达图的中心坐标
//     const radius =80;  // 半径设置为图表宽度的一半

//     const vertices = [];
//     for (let i = 0; i < indicatorCount; i++) {
//         const angle = (2 * Math.PI / indicatorCount) * i;  // 计算每个角标对应的角度
//         const x = center[0] + radius * Math.cos(angle);  // 圆形的 x 坐标
//         const y = center[1] + radius * Math.sin(angle);  // 圆形的 y 坐标
//         vertices.push([x, y]);  // 保存顶点坐标
//     }
//     return vertices;
// }

const dragRadarChart3 = (options, calback, reset, proportion) => {
    let {
        indicator,
        chartDom,
        chartData,
        type,
        // color,
        name,
    } = options;
    let myChart = chartDom && echarts.init(chartDom);
    myChart.clear()
    const data1 = chartData

    // let color = options.color
    series = [
        {
            type: 'line',
            smooth: true,
            lineStyle: {
                width: 0,
            },
            symbolSize: 0,
            data: data
        },
        {
            type: 'radar',
            symbolSize: 0,
            data: [{
                // TODO:
                value: data1,
                name: name,
                label: {
                    show: false,
                    formatter: (params) => {
                        return params.value;
                    },
                    color: '#000'
                },
                lineStyle: {
                    type: 'dashed',
                    width: 1,
                    color: '#000',
                }
            }]
        }
    ];
    // if (options.detailData) {
    //     updateChartData(options, reset)
    // }

    let option = {
        tooltip: {
            // triggerOn: 'none',
            trigger: 'item',
        },
        grid: {
            top: '12%',
            bottom: '12%',
            right: proportion || '28%',
            left: proportion || '28%'
        },
        xAxis: {
            min: minNumber,
            max: maxNumber,
            type: 'value',
            show: false,
            axisLine: {
                onZero: true
            }
        },
        yAxis: {
            min: minNumber,
            max: maxNumber,
            type: 'value',
            show: false,
            axisLine: {
                onZero: true
            }
        },
        radar: {
            axisName: {
                color: '#A8A8A8',
                fontSize: 12,
                //指示器文字换行 start
                formatter: function (text) {
                    text = text.replace(' ', '\n')
                    return text;
                }
                //指示器文字换行 end
            },
            indicator: indicator
        },
        color: '#000',
        series: series
    };

    myChart && option && myChart.setOption(option);
    console.log(indicator);
    const { data, } = generateInitialData(indicator)
    console.log(data);
    initInvisibleGraphic(myChart, data, data1, symbolSize, type, name, calback,)
    return myChart
}

export {
    dragRadarChart3,
    initInvisibleGraphic,
}
使用
let indicatorList = ['aa','bb','bb','dd']
        let options = {
            // 动态获取
            indicator: indicatorList.map(item => {
                return {
                    name: item,
                    max: 1,
                }
            }),
            chartData: indicatorList.map(() => 1),
            color: "#ED5E5E",
            type: "art",
            width: width,
            height: height,
            name: i18n.global.t("radar_chart.art"),
            chartDom: chart_art.value,
        };
        dragRadarChart3(
            options,
            calbackFunc,
            resetChart,
            '26%'
        );
今ならできます。


