1.需要导入的包
import seaborn as sns
import numpy as np
from numpy.random import randn
import matplotlib as mpl
import matplotlib.pyplot as plt
from scipy import stats
我用的是spyder,之前安装过numpy和scipy所以这次只用安装seaborn就可以了
spyder环境下,可以用
conda install seaborn
来安装seaborn
如果遇到无法连接到下载网站的问题,可以通过添加清华镜像下载库(地址一定不能加引号!!)
conda config --add channels https://mirrors.tuna.tsinghua.edu.cn/anaconda/pkgs/free/

conda config --set show_channel_urls yes
如果不小心添加了错误的镜像,可以通过输入
conda info -a
来查看.condarc配置文件的地址,再打开这个配置文件把错误地址删掉就可以了
2.画直方图
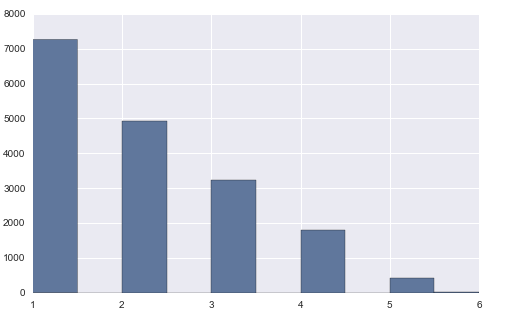
plt.hist(data)
plt.hist(data, bins=12, color=sns.desaturate("indianred", .8), alpha=.4)
n, bins, patches = plt.hist(arr, bins=10, normed=0, facecolor='black', edgecolor='black',alpha=1,histtype='bar')

hist的参数非常多,但常用的就这六个,只有第一个是必须的,后面四个可选
arr: 需要计算直方图的一维数组
bins: 直方图的柱数,可选项,默认为10
normed: 是否将得到的直方图向量归一化。默认为0
facecolor: 直方图颜色
edgecolor: 直方图边框颜色
alpha: 透明度
histtype: 直方图类型,‘bar’, ‘barstacked’, ‘step’, ‘stepfilled’
返回值 :
n: 直方图向量,是否归一化由参数normed设定
bins: 返回各个bin的区间范围
patches: 返回每个bin里面包含的数据,是一个list


