
图例参考:http://matplotlib.org/gallery.html
API参考:http://matplotlib.org/api/pyplot_summary.html
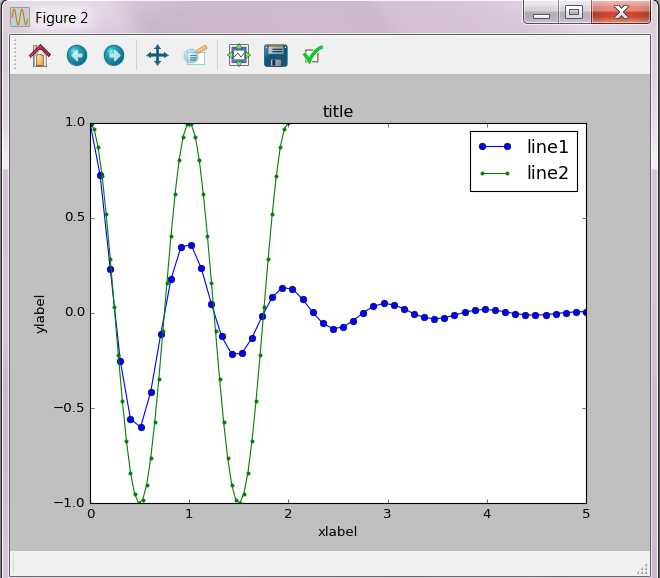
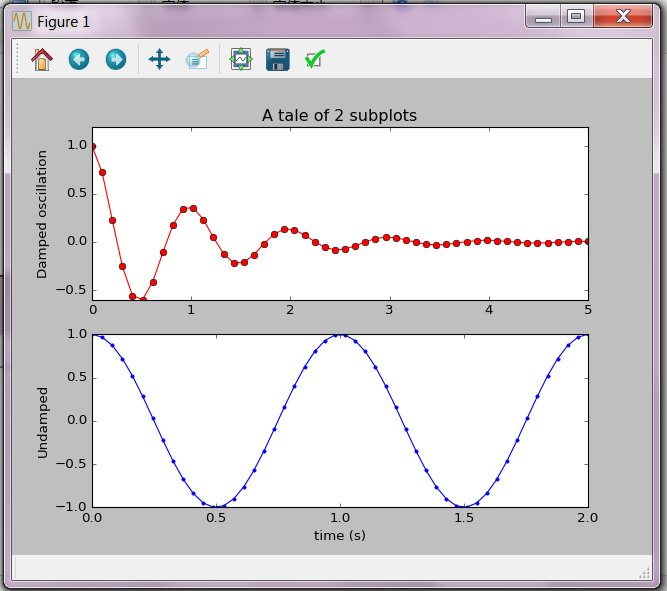
# -*- coding:utf-8 -*-
"""
Simple demo with multiple subplots.
"""
import numpy as np
import matplotlib.pyplot as plt


x1 = np.linspace(0.0, 5.0 )
x2 = np.linspace(0.0, 2.0 )

y1 = np.cos(2 * np.pi * x1) * np.exp(-x1)
y2 = np.cos(2 * np.pi * x2)

#第一张大图
plt.subplot(2, 1, 1)  #
plt.plot(x1, y1, 'ro-')
plt.title('A tale of 2 subplots')
plt.ylabel('Damped oscillation')

plt.subplot(2, 1, 2)
plt.plot(x2, y2, '.-')
plt.xlabel('time (s)')
plt.ylabel('Undamped')

plt.figure(2) #第二张大图
plt.plot(x1,y1,'o-', label="line1") #添加label说明
plt.plot(x2,y2,'.-', label='line2') #添加label说明
plt.axis([0, 5, -1, 1])  #指定坐标系
plt.legend(loc='best', ncol=1, prop={'size':16}, columnspacing=0.5) #添加备注, loc位置,
plt.title("title")
plt.xlabel("xlabel")
plt.ylabel("ylabel")

plt.show()

 浙公网安备 33010602011771号