
Python实例:仅绘制图例而不绘制实际的图形
作者:凯鲁嘎吉 - 博客园 http://www.cnblogs.com/kailugaji/
Python实例:仅绘制图例而不绘制实际的图形,使用线条来表示不同的数据系列(即使这些数据系列在图中没有实际表示)。
# Python实例:仅绘制图例而不绘制实际的图形
# 使用线条来表示不同的数据系列(即使这些数据系列在图中没有实际表示)
# -*- coding: utf-8 -*-
# Author:凯鲁嘎吉 Coral Gajic
# https://www.cnblogs.com/kailugaji/
import matplotlib.pyplot as plt
from matplotlib.legend import Legend
plt.rcParams['font.size'] = 15
plt.rcParams['font.family'] = 'Times New Roman'
fig, ax = plt.subplots(figsize=(10,6)) # 图长宽比例
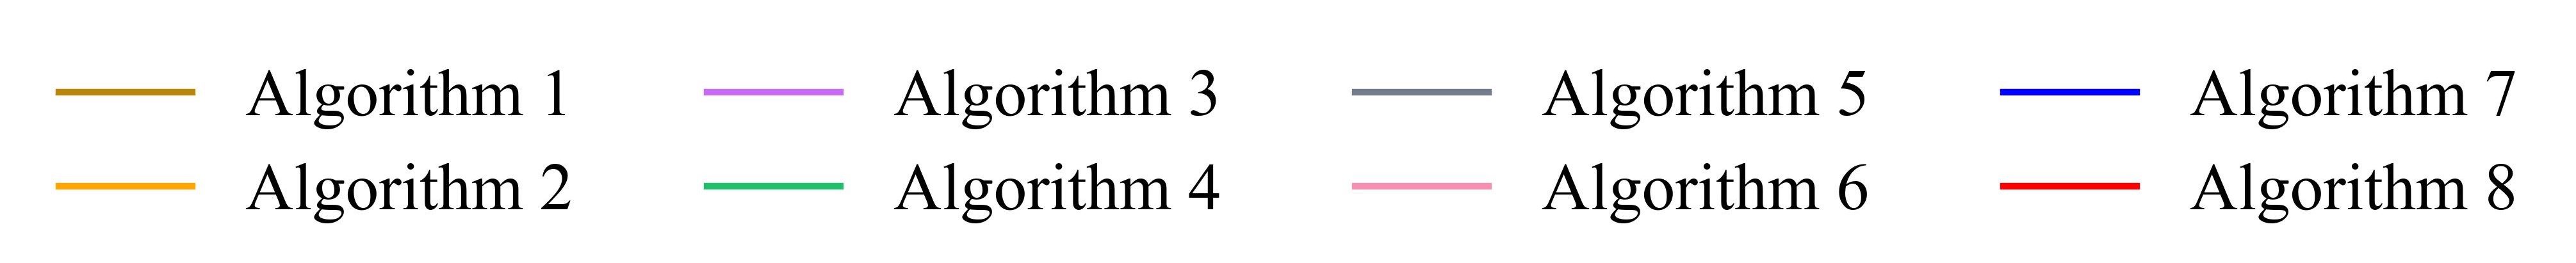
color = ['darkgoldenrod', 'orange', '#c56cf0', '#20bf6b', '#747d8c', '#f78fb3', 'b', 'r']
label = ['Algorithm 1', 'Algorithm 2',
'Algorithm 3', 'Algorithm 4',
'Algorithm 5', 'Algorithm 6',
'Algorithm 7', 'Algorithm 8']
# 创建一个空白的线条列表,用于图例
lines = [plt.Line2D([0], [0], color=color, label=label)
for label, color in zip(label, color)]
# 使用ax.add_artist()添加图例到图表上
legend = Legend(ax, lines, [line.get_label() for line in lines],
loc='center', # lower center
ncol=int(len(label)/2), # 变成一行:int(len(label))
bbox_to_anchor=(0.5, 0.5), # (0.5, -0.1)
frameon=False)
ax.add_artist(legend)
ax.axis('off')
plt.savefig("Plot_Legend.jpg", bbox_inches='tight', dpi=500)
plt.show()
结果:


 浙公网安备 33010602011771号