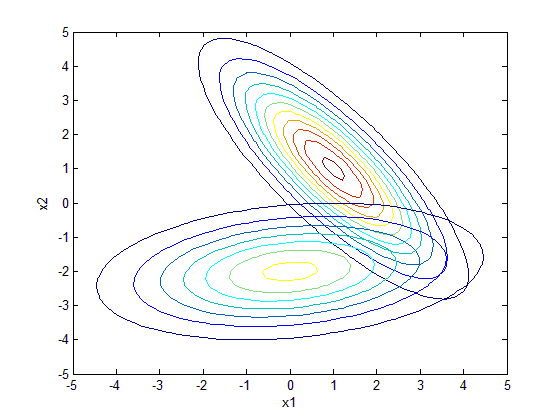
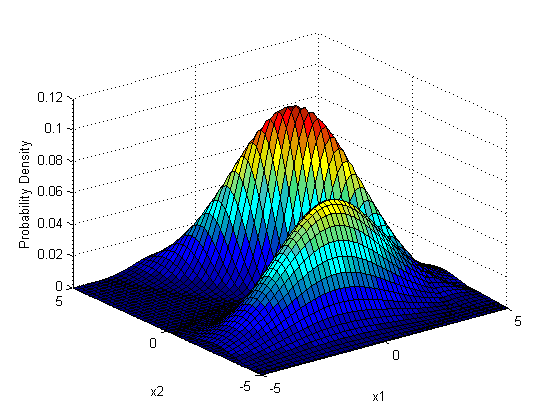
MATLAB实例:二元高斯分布图
作者:凯鲁嘎吉 - 博客园 http://www.cnblogs.com/kailugaji/
1. MATLAB程序
1 2 3 4 5 6 7 8 9 10 11 12 13 14 15 16 17 18 19 20 21 22 23 24 25 26 27 28 29 30 31 32 33 34 35 36 37 38 39 40 41 42 43 44 | %% demo Multivariate Normal Distributionclearclc%% 空间坐标范围x1=-5:0.2:5;x2=-5:0.2:5;[X1, X2]=meshgrid(x1, x2);X=[X1(:) X2(:)];%% 高斯分布参数% 分量1miu_1=[1 1]; % 均值Sigma_1=[2 -2;-2 3]; % 协方差% 分量2miu_2=[0 -2]; % 均值Sigma_2=[5 0.5;0.5 1]; % 协方差%% 高斯概率密度函数% 分量1y_1=mvnpdf(X, miu_1, Sigma_1);y_1=reshape(y_1, length(x2), length(x1));% 分量2y_2=mvnpdf(X, miu_2, Sigma_2);y_2=reshape(y_2, length(x2), length(x1));%% 2D密度图figure(1);contour(x1, x2, y_1);hold oncontour(x1, x2, y_2);xlabel('x1');ylabel('x2');saveas(gcf,sprintf('Gauss_2D.jpg'),'bmp');%% 3D密度图figure(2);surf(x1, x2, y_1);hold onsurf(x1, x2, y_2);xlabel('x1');ylabel('x2');zlabel('Probability Density');saveas(gcf,sprintf('Gauss_3D.jpg'),'bmp'); |
2. 结果


【推荐】编程新体验,更懂你的AI,立即体验豆包MarsCode编程助手
【推荐】凌霞软件回馈社区,博客园 & 1Panel & Halo 联合会员上线
【推荐】抖音旗下AI助手豆包,你的智能百科全书,全免费不限次数
【推荐】博客园社区专享云产品让利特惠,阿里云新客6.5折上折
【推荐】轻量又高性能的 SSH 工具 IShell:AI 加持,快人一步