Hi-C互作热图作图神器-HiCPlotter
摘要
HiCPlotter is a Python data visualization tool for integrating different data types with interaction matrixes
安装
git clone https://github.com/akdemirlab/HiCPlotter.git
使用
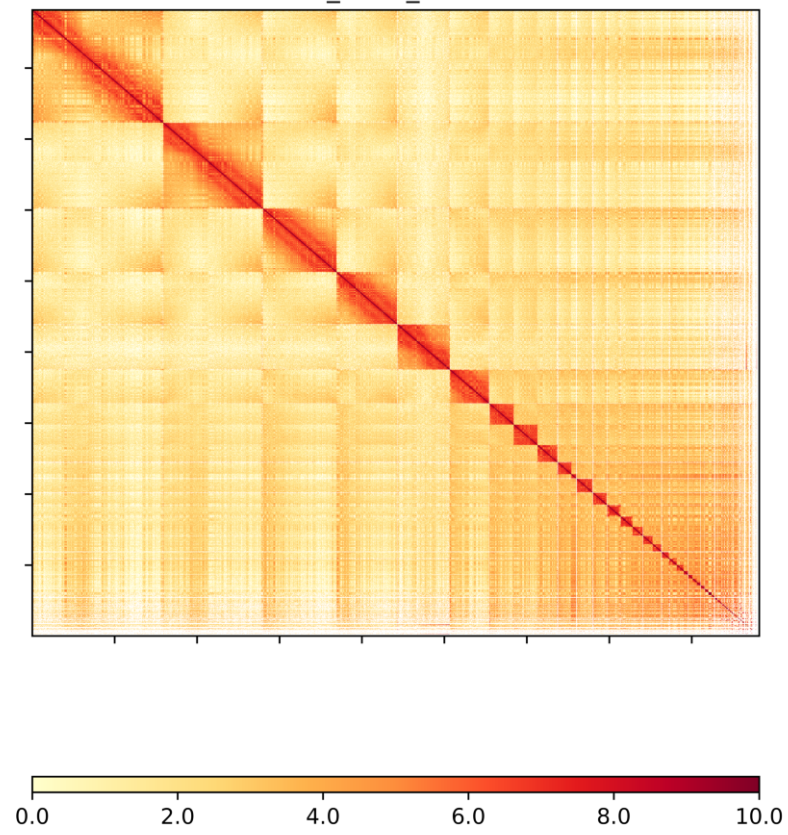
# 全基因组作图
python HiCPlotter/HiCPlotter.py -f \
hic/6a_rep1_cut9bp/hic_results/matrix/sample1/iced/1000000/sample1_1000000_iced.matrix(对应分辨率的标准化矩阵)\
-o 6a_rep_cut9bp(输出文件名前缀) -r 1000000(分辨率) -tri 1 -bed \
hic/6a_rep1_cut9bp/hic_results/matrix/sample1/raw/1000000/sample1_1000000_abs.bed(对应分辨率的互作绝对值矩阵)\
-n 6a_rep(图中标题) -wg 1(是否绘制全基因组) -chr NC_006088.5(全基因组按顺序的最后一个染色体/scaffold)
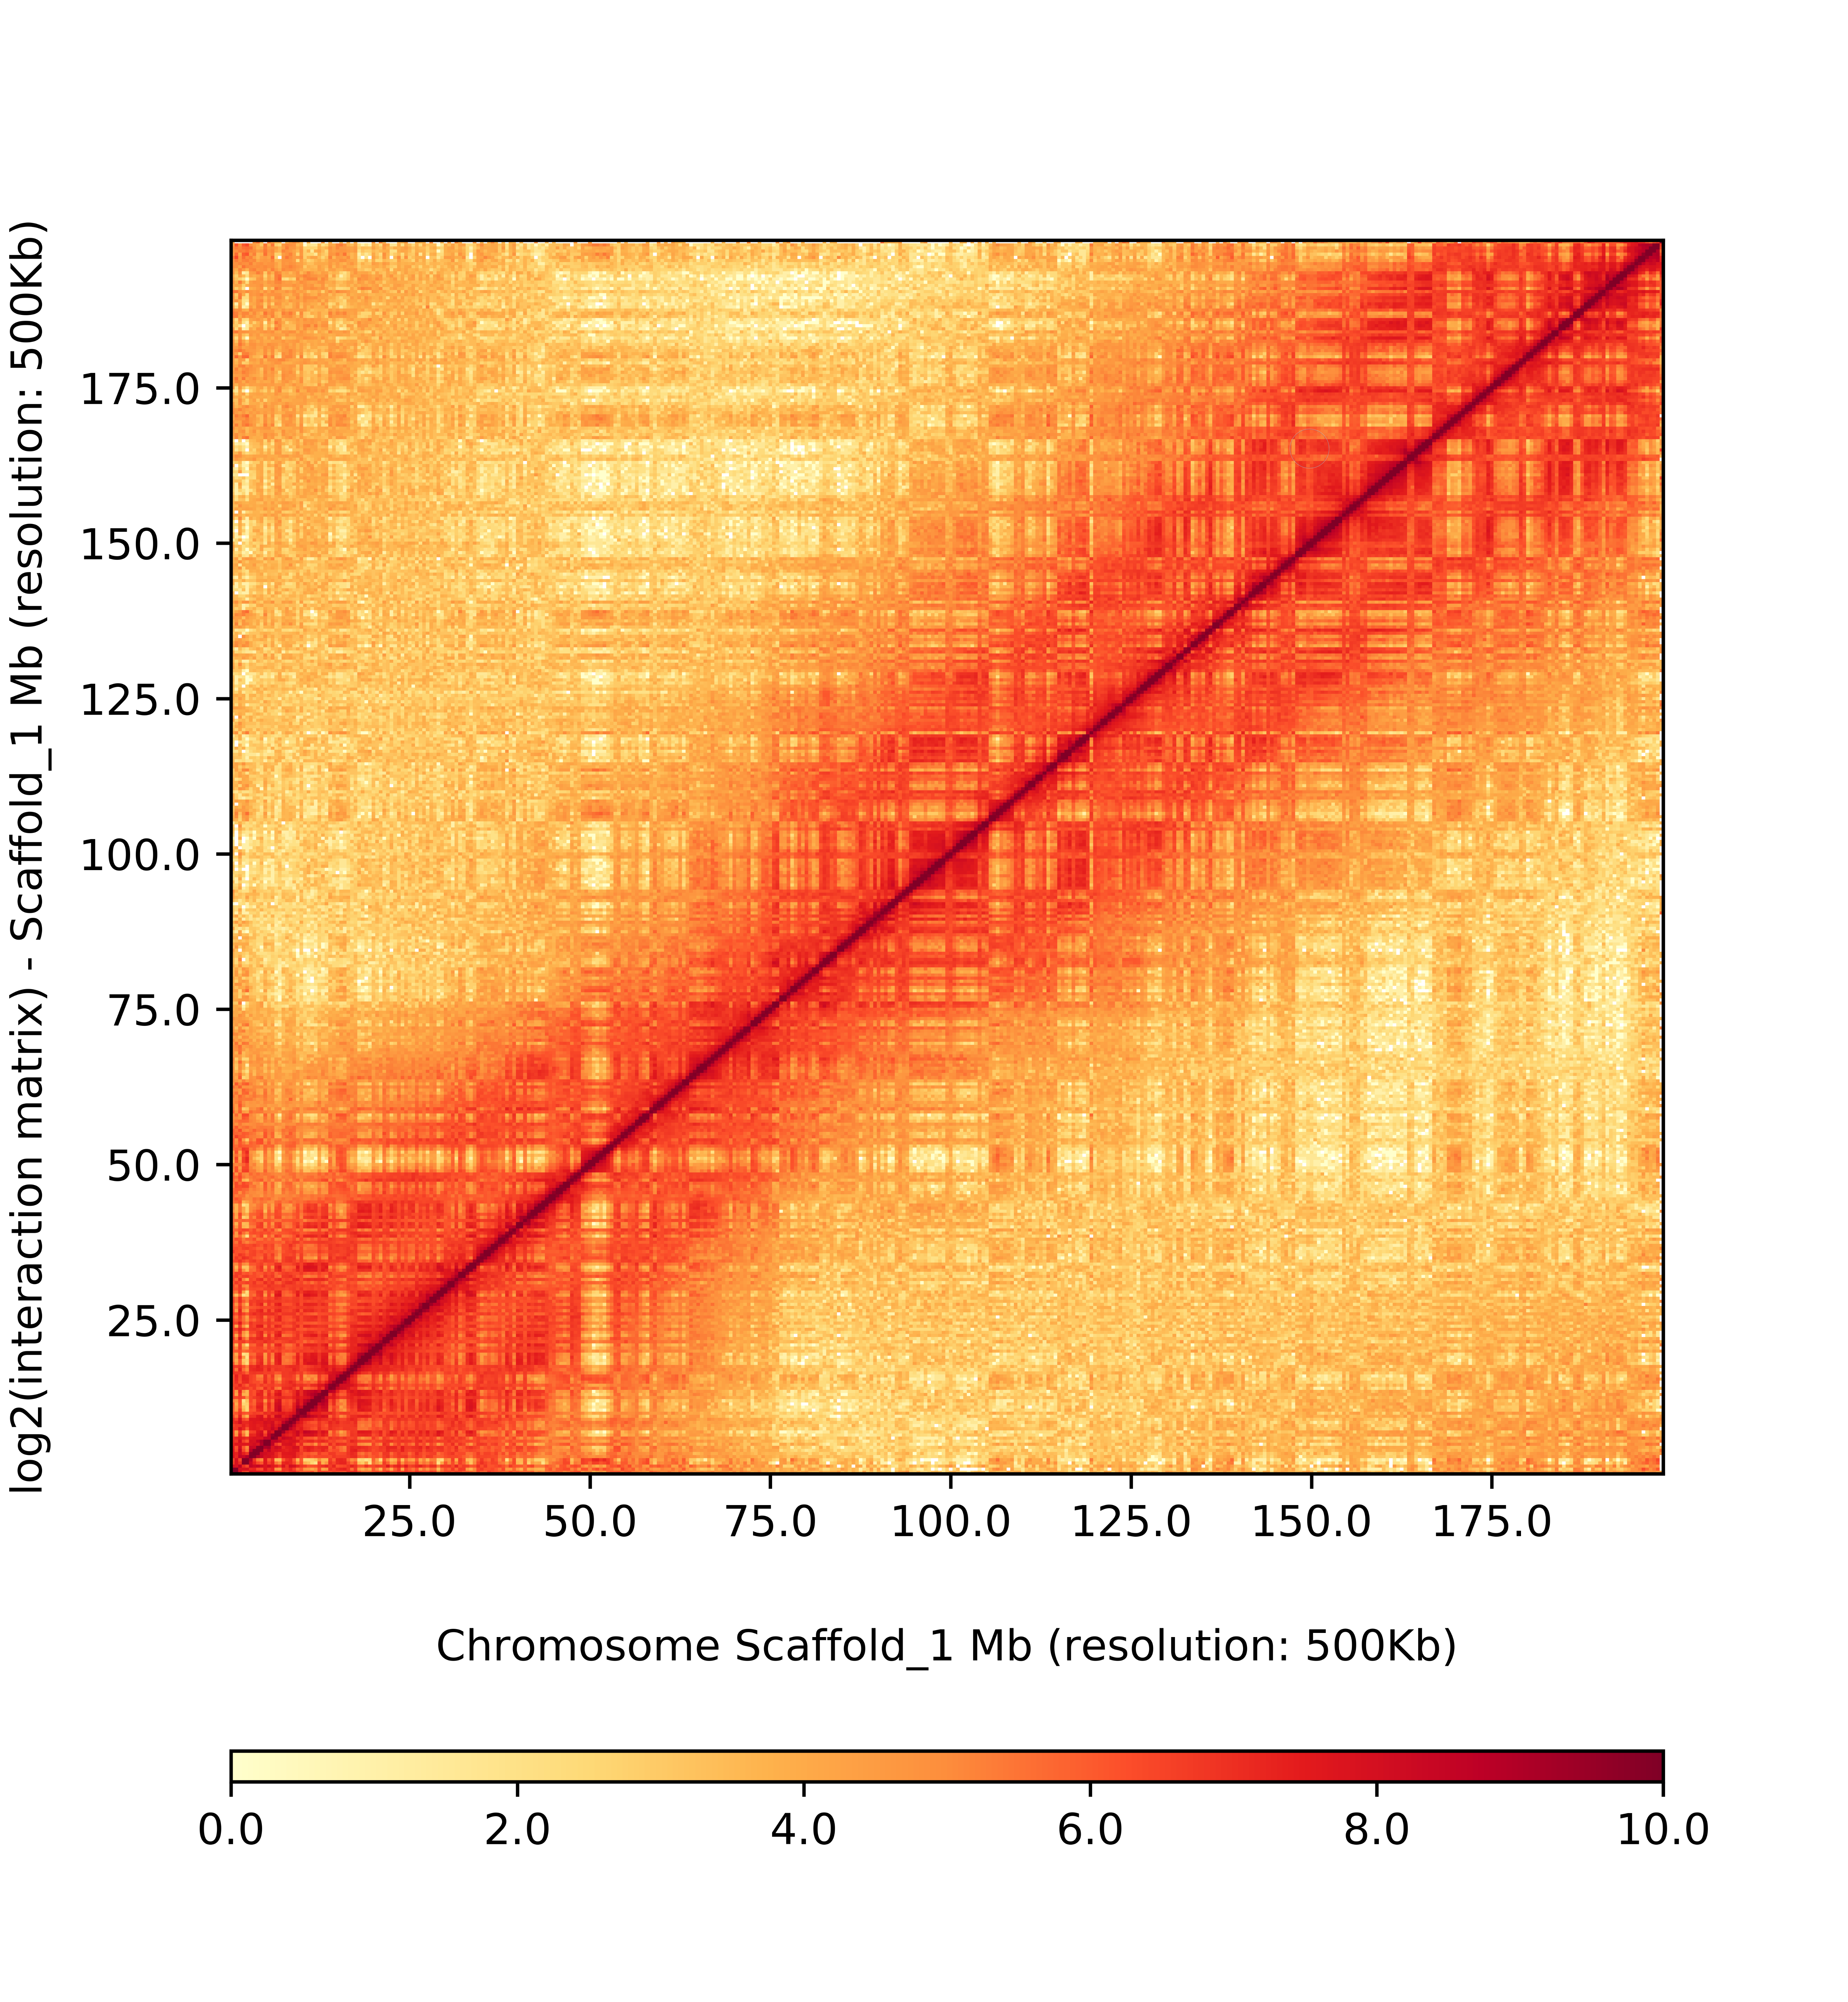
# 个别染色体作图
python HiCPlotter/HiCPlotter.py -f \
hic/cau_silkie/hic_results/matrix/3sampleIn1_notreat/iced/500000/3sampleIn1_notreat_500000_iced.matrix \
-o silkie_chr1 -r 500000 -tri 1 -bed \
hic/cau_silkie/hic_results/matrix/3sampleIn1_notreat/raw/500000/3sampleIn1_notreat_500000_abs.bed \
-n silkie_chicken_chr1 -chr Scaffold_1
出图
全基因组

个别染色体


