


简介
import pandas as pd
import numpy as np
data = pd.read_csv('zgpa_train.csv')
data.head()
price = data.loc[:,'close']
price.head()
# 归一化处理
price_norm = price/max(price)
print(price_norm)
from matplotlib import pyplot as plt
fig1 = plt.figure(figsize=(8,5))
plt.plot(price)
plt.title('close price')
plt.xlabel('time')
plt.ylabel('price')
plt.show()
# define X and y
# define method to extract X and y
def extract_data(data,time_step):
X=[]
y=[]
# 0,1,2...9:10个样本: time_step=8;0,1...7;1,2...8;2,3
for i in range(len(data) - time_step):
X.append([a for a in data[i:i+time_step]])
y.append(data[i+time_step])
X=np.array(X)
X=X.reshape(X.shape[0],X.shape[1],1)
return X,y
time_step=8
# define X and y
X,y = extract_data(price_norm,time_step)
print(X)
# set up the model
from tensorflow.keras.models import Sequential
from tensorflow.keras.layers import Dense, SimpleRNN
model = Sequential()
#input_shape 训练长度 每个数据的维度
model.add(SimpleRNN(units=5,input_shape=(time_step,1),activation="relu"))
#输出层
#输出数值 units =1 1个神经元 "linear"线性模型
model.add(Dense(units=1, activation="linear"))
#配置模型 回归模型y
model.compile(optimizer="adam",loss="mean_squared_error")
model.summary()
y = np.array(y)
# train the model
model.fit(X,y,batch_size=30,epochs=200)
# make prediction based on the training data
y_train_predict = model.predict(X)*max(price)
y_train = y*max(price)
print(y_train_predict,y_train)
fig2 = plt.figure(figsize=(10,5))
plt.plot(y_train,label = "real price")
plt.plot(y_train_predict,label = "predict price")
plt.title("price")
plt.xlabel("time")
plt.ylabel("price")
plt.legend()
plt.show()
data_test = pd.read_csv('zgpa_test.csv')
data_test.head()
price_test=data_test.loc[:,'close']
price_test.head()
price_test_norm = price_test/max(price)
#extract X_test and y_test
X_test_norm,y_test_norm = extract_data(price_test_norm,time_step)
print(X_test_norm.shape,len(y_test_norm))
# make prediction based on the test data
y_test_predict = model.predict(X_test_norm)*max(price)
y_test = [i*max(price) for i in y_test_norm]
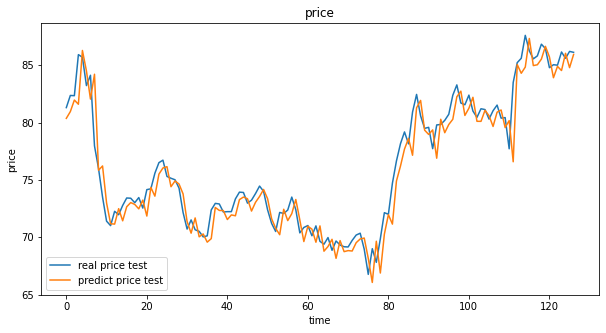
fig3 = plt.figure(figsize=(10,5))
plt.plot(y_test,label = "real price test")
plt.plot(y_test_predict,label = "predict price test")
plt.title("price")
plt.xlabel("time")
plt.ylabel("price")
plt.legend()
plt.show()
# result_y_test = y_test.reshap(-1,1)
result_y_test = np.array(y_test).reshape(-1,1)
result_y_test_predict = np.array(y_test_predict).reshape(-1,1)
print(result_y_test.shape,result_y_test_predict.shape)
result = np.concatenate((result_y_test,result_y_test_predict),axis=1)
print(result.shape)
reslut = pd.DataFrame(result,columns=['real_price_test','predict_price_test'])
reslut.to_csv('zgpa_predict_test.csv')
image
参考链接
---------------------------我的天空里没有太阳,总是黑夜,但并不暗,因为有东西代替了太阳。虽然没有太阳那么明亮,但对我来说已经足够。凭借着这份光,我便能把黑夜当成白天。我从来就没有太阳,所以不怕失去。
--------《白夜行》


【推荐】国内首个AI IDE,深度理解中文开发场景,立即下载体验Trae
【推荐】编程新体验,更懂你的AI,立即体验豆包MarsCode编程助手
【推荐】抖音旗下AI助手豆包,你的智能百科全书,全免费不限次数
【推荐】轻量又高性能的 SSH 工具 IShell:AI 加持,快人一步
· TypeScript + Deepseek 打造卜卦网站:技术与玄学的结合
· 阿里巴巴 QwQ-32B真的超越了 DeepSeek R-1吗?
· 【译】Visual Studio 中新的强大生产力特性
· 10年+ .NET Coder 心语 ── 封装的思维:从隐藏、稳定开始理解其本质意义
· 【设计模式】告别冗长if-else语句:使用策略模式优化代码结构