简介
将多个 逻辑回归 网络 层叠起来 构建 多层感知器
在不增加高次项数据的情况下,如何通过MLP实现非线性分类预测。 + MNIST 数据集的MLP模型
参考链接
推荐安装 李沐 的 cuda 还有GPU版本 https://www.bilibili.com/video/BV18K411w7Vs?spm_id_from=333.337.search-card.all.click
推荐安装 tensorflow.keras gpu版本 参考链接 https://blog.csdn.net/weixin_45092662/article/details/106980282 pip install tensorflow-gpu==2.2.0 -i https://pypi.tuna.tsinghua.edu.cn/simple
https://blog.csdn.net/weixin_46344368/article/details/107305700?spm=1001.2014.3001.5502 数据集
code
# load the data
import pandas as pd
import numpy as np
data = pd.read_csv('data.csv')
data.head()

# define the X and y
X = data.drop(['y'],axis=1)
y = data.loc[:,'y']
X.head()

# visualiza the data
from matplotlib import pyplot as plt
fig1 = plt.figure(figsize=(5,5))
passed = plt.scatter(X.loc[:,'x1'][y==1], X.loc[:,'x2'][y==1])
failed = plt.scatter(X.loc[:,'x1'][y==0], X.loc[:,'x2'][y==0])
plt.legend((passed,failed),('passed','failed'))
plt.xlabel('x1')
plt.ylabel('x2')
plt.show()

# split the data
from sklearn.model_selection import train_test_split
X_train,X_test, y_train, y_test = train_test_split(X,y,test_size=0.33, random_state=10)
print(X_train.shape,X_test.shape,X.shape)

# set up the model
from tensorflow.keras.models import Sequential
from tensorflow.keras.layers import Dense, Activation
mlp = Sequential()
mlp.add(Dense(units=20, activation='sigmoid', input_dim=2))
mlp.add(Dense(units=1, activation='sigmoid'))
mlp.summary()


# compile the model
mlp.compile(optimizer='adam',loss='binary_crossentropy')

# train the model
mlp.fit(X_train,y_train,epochs=5000)


# make prediction and calculate the accuracy
y_train_predict = mlp.predict_classes(X_train)
from sklearn.metrics import accuracy_score
accuracy_train = accuracy_score(y_train, y_train_predict)
print(accuracy_train)


# make prediction based on the test data
y_test_predict = mlp.predict_classes(X_test)
accuracy_test = accuracy_score(y_test, y_test_predict)
print(accuracy_test)


print(y_train_predict)
y_train_predict_form = pd.Series(i[0] for i in y_train_predict)
print(y_train_predict_form)


# generate new data for plot
xx,yy = np.meshgrid(np.arange(0,1,0.01), np.arange(0,1,0.01))
x_range = np.c_[xx.ravel(), yy.ravel()]
y_range_predict = mlp.predict_classes(x_range)
print(type(y_range_predict))

y_range_predict_form = pd.Series(i[0] for i in y_range_predict)
print(y_range_predict_form)


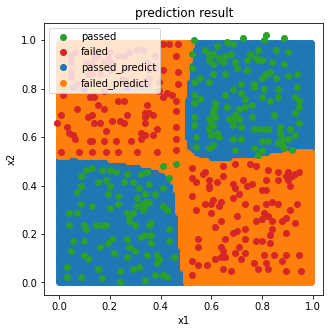
# visualiza the data
fig2 = plt.figure(figsize=(5,5))
passed_predict = plt.scatter(x_range[:,0][y_range_predict_form==1],x_range[:,1][y_range_predict_form==1])
failed_predict = plt.scatter(x_range[:,0][y_range_predict_form==0],x_range[:,1][y_range_predict_form==0])
passed = plt.scatter(X.loc[:,'x1'][y==1], X.loc[:,'x2'][y==1])
failed = plt.scatter(X.loc[:,'x1'][y==0], X.loc[:,'x2'][y==0])
plt.legend((passed,failed,passed_predict,failed_predict),('passed','failed','passed_predict','failed_predict'))
plt.xlabel('x1')
plt.ylabel('x2')
plt.title('prediction result')
plt.show()
# load the mnist data
from tensorflow.keras.datasets import mnist
(X_train, y_train),(X_test, y_test) = mnist.load_data()
print(type(X_train), X_train.shape)
# visualize the data
img1 = X_train[0]
from matplotlib import pyplot as plt
fig1 = plt.figure(figsize=(5,5))
plt.imshow(img1)
plt.title(y_train[0])
plt.show()


img1.shape


# format the input data
feature_size = img1.shape[0]*img1.shape[1]
X_train_format = X_train.reshape(X_train.shape[0],feature_size)
X_test_format = X_test.reshape(X_test.shape[0],feature_size)
print(X_train_format.shape)


# normalize the input data
X_train_normal = X_train_format/255
X_test_normal = X_test_format/255
print(X_train_normal[0])


# format the output data(labels)
from tensorflow.keras.utils import to_categorical
y_train_format = to_categorical(y_train)
y_test_format = to_categorical(y_test)
print(y_train[0])


# set up the model
from tensorflow.keras.models import Sequential
from tensorflow.keras.layers import Dense, Activation
mlp = Sequential()
mlp.add(Dense(units=392,activation='sigmoid', input_dim=feature_size))
mlp.add(Dense(units=392,activation='sigmoid'))
mlp.add(Dense(units=10,activation='softmax'))
mlp.summary()

# configure the model
mlp.compile(loss='categorical_crossentropy',optimizer='adam')

# train the model
mlp.fit(X_train_normal, y_train_format,epochs=20)


# evaluate the model
y_train_predict = mlp.predict_classes(X_train_normal)
print(y_train_predict)
from sklearn.metrics import accuracy_score
accuracy_train = accuracy_score(y_train,y_train_predict)
print(accuracy_train)


# evaluate the model
y_test_predict = mlp.predict_classes(X_test_normal)
print(y_test_predict)
from sklearn.metrics import accuracy_score
accuracy_test = accuracy_score(y_test,y_test_predict)
print(accuracy_test)

img2 = X_test[100]
fig2 = plt.figure(figsize=(3,3))
plt.imshow(img2)
plt.title(y_test_predict[100])
plt.show()
image

---------------------------我的天空里没有太阳,总是黑夜,但并不暗,因为有东西代替了太阳。虽然没有太阳那么明亮,但对我来说已经足够。凭借着这份光,我便能把黑夜当成白天。我从来就没有太阳,所以不怕失去。
--------《白夜行》


【推荐】国内首个AI IDE,深度理解中文开发场景,立即下载体验Trae
【推荐】编程新体验,更懂你的AI,立即体验豆包MarsCode编程助手
【推荐】抖音旗下AI助手豆包,你的智能百科全书,全免费不限次数
【推荐】轻量又高性能的 SSH 工具 IShell:AI 加持,快人一步
· TypeScript + Deepseek 打造卜卦网站:技术与玄学的结合
· Manus的开源复刻OpenManus初探
· AI 智能体引爆开源社区「GitHub 热点速览」
· 从HTTP原因短语缺失研究HTTP/2和HTTP/3的设计差异
· 三行代码完成国际化适配,妙~啊~
2020-04-26 平行坐标
2017-04-26 terminal 终端 linux 快捷键 很有用