Matrix报表是分析数据的绝佳工具。实质上,分析报表中的矩阵是一个汇总表。“条件分配”通常用于促进分析。这是FastReport.Net中的常规工具。条件突出显示意味着使用颜色,字体或图标突出显示数据单元格,具体取决于给定条件。但是,条件突出显示适用于个人但是如果我们想根据标题中的值选择整个列呢?例如,要突出显示周末。在这种情况下,您将不得不诉诸报表的“无所不能”脚本,常规颜色突出显示在这里没有帮助。
使用基于nwind.xml演示数据库中的MatrixDemo表的矩阵创建模板:

我们的想法是在标题中找到满足条件的值。在这个矩阵中,我们按年度计算员工的收入。
让我们突出显示标题为2012和2014的列。要执行此操作,我们需要突出显示此列中的标题以及所有后续单元格,包括总计。为矩阵创建BeforePrint事件:
// List of selected columns
 private List<int> markedColumns;
// Counter for columns in the first row
 private int firstLineColumn;
 // Counter for columns in the following lines
 private int secondLineColumn;


// Matrix event handler
 private void Matrix2_BeforePrint(object sender, EventArgs e)
 {
// Create a new list for selected columns
 markedColumns = new List<int>();
// Reset the first row counter
 firstLineColumn = 0;
// Reset the next row count
 secondLineColumn = 0;
 }
最初,我们添加了几个我们将在事件处理程序中使用的变量。这些变量存储行的标记列。此外,在显示矩阵之前,我们初始化变量。
为值为[Year]的单元格的BeforePrint事件创建另一个处理程序:
 // Event handler for cells in the first row of the matrix
 private void Cell18_BeforePrint(object sender, EventArgs e)
 {
 // Use sender as TableCell
 TableCell cell = sender as TableCell;
 // Check the required value in the cell
 if (cell.Text == "2012" || cell.Text == "2014")
 {
 // Sets the fill color for this cell.
 cell.FillColor = Color.Brown;
 // Save to selected list of columns
 markedColumns.Add(firstLineColumn);
 }
 // Increase column count for first row
 firstLineColumn++;
 }
在这里,我需要做一个小的评论,以便你了解正在发生的事情的本质。关键是在FastReport中构建报表时的矩阵输出是逐行完成的。因此,我们保存矩阵第一行的列号。在我们的例子中,2个值将落入标记列的列表中。
现在为值为[Revenue]的单元格添加事件处理程序:
// The event handler for the cells in the following rows of the matrix. You need to set it for the second row and the totals.
 private void Cell21_BeforePrint(object sender, EventArgs e)
 {
 // Use sender as TableCell
 TableCell cell = sender as TableCell;
 // Find the current index in the markedColumns list
 if (markedColumns.IndexOf(secondLineColumn) != -1)
 {
 // Sets the fill color for this cell.
 cell.FillColor = Color.Red;
 }
 // Increase counter
 secondLineColumn++;
 // Reset counter for next row
 if (secondLineColumn >= firstLineColumn)
 secondLineColumn = 0;
在此处理程序中,我们找到与第一行中所选列对应的列,并将其单元格绘制为红色。到达最后一列后,重置下一行的变量。如您所知,在构建报表时,矩阵的第二行是动态的。这意味着它将显示在源中的每行数据。因此,我们需要检查每一行并为正确列中的单元格着色。
脚本中给出的解决方案是不寻常的,但对于这种情况唯一可能的解决方案,因为矩阵是动态构建的,并且不存储单元格的最终结构,坐标和位置,直到它直接在工作表上绘制。只有模板(我们在设计器中看到的模板)和矩阵标题的文本值存储在内存中。
因此,我们必须遍历所有行并记住列以进行着色。
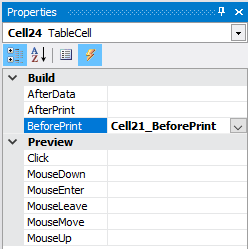
根据脚本,我们必须为矩阵创建三个事件处理程序BeforePrint,单元格[Year]和单元格[Revenue]。但是,在我们的矩阵中还有另一个第三行。它显示结果,根据所选列绘制它们也是很好的。为此,对于位于[Revenue]下的单元格,只需从同一[Revenue]挂钩BeforeFrint事件处理程序:

现在,运行报表:

如果要以不同的颜色绘制总计,则必须为总计的单元格创建自己的BeforePrint事件处理程序,类似于[Revenue]单元格的处理程序。


