CCS - Baseband Digital Transmission - Optimum Receiver for the AWGN Channel - The Detector
The Detector
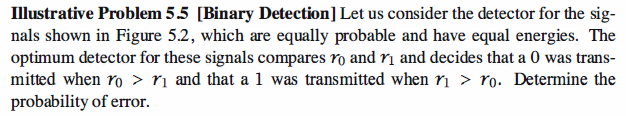
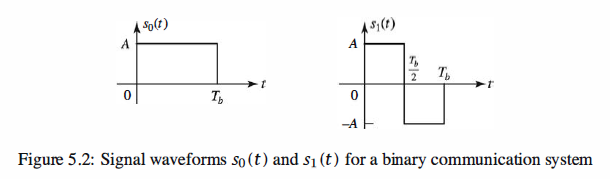
The detector observes the correlator or matched filter outputs ro and r1 and decides
on whether the transmitted signal waveform is s0 ( t) or s1 ( t) , which correspond to the
transmission of either a 0 or a 1, respectively. The optimum detector is defined as the
detector that minimizes the probability of error.
Note that, https://en.wikipedia.org/wiki/Q-function
In statistics, the Q-function is the tail distribution function of the standard normal distribution.[1][2] In other words, {\displaystyle Q(x)}

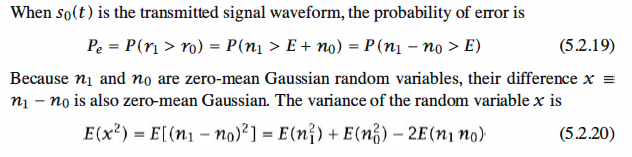
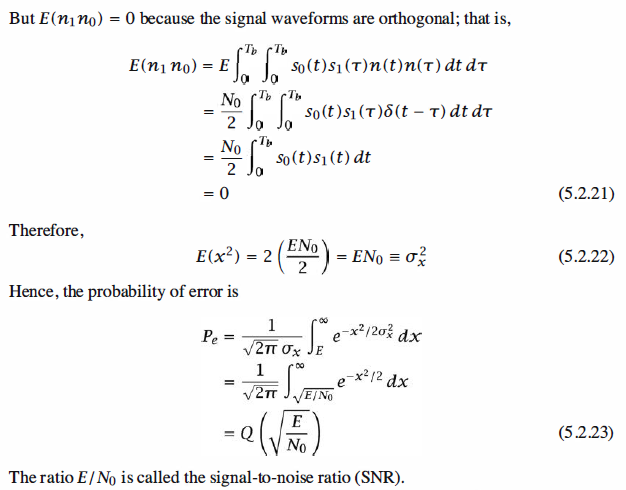
The derivation of the detector performance given in the example was based on the
transmission of the signal waveform s0 ( t). The reader may verify that the probability
of error that is obtained when s1 ( t) is transmitted is identical to that obtained when
so (t) is transmitted. Because the 0's and 1 's in the data sequence are equally probable,
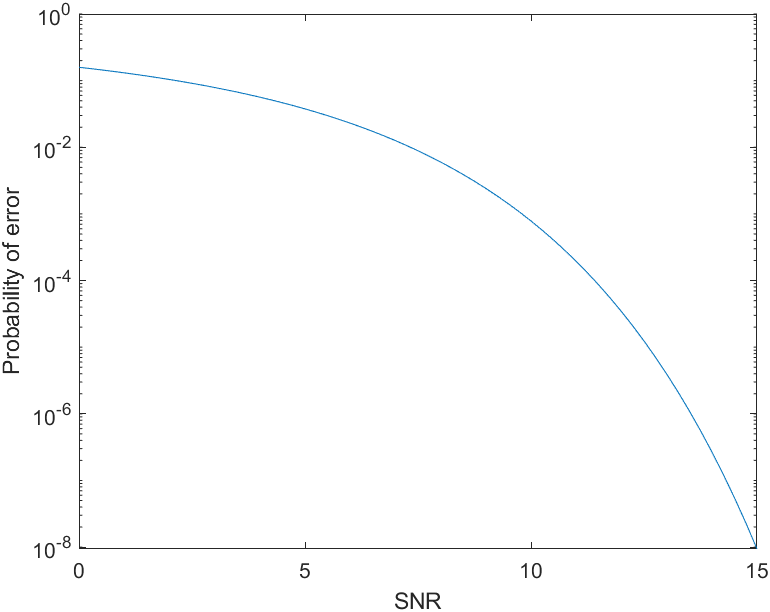
the average probability of error is that given by (5.2.23). The probability of error decreases exponentially as the SNR increases.
Matlab Coding
 1 % The Matlab script that generates the probability of error versus the
 2 % signal-to-noise ratio.
 3
 4 initial_snr = 0;
 5 final_snr = 15;
 6 snr_step = 0.25;
 7 snr_in_dB = initial_snr:snr_step:final_snr;
 8 for i = 1:length(snr_in_dB),
 9     snr = 10^(snr_in_dB(i)/10);
10     Pe(i) = Qfunct(sqrt(snr));
11     echo off;
12 end
13 echo on;
14 semilogy(snr_in_dB,Pe)
15 xlabel('SNR')
16 ylabel('Probability of error')

Simulation Result
Reference,
1. <<Contemporary Communication System using MATLAB>> - John G. Proakis

 浙公网安备 33010602011771号