


一点关于使用FusionCharts的体会与总结
2010-03-23 17:23 ☆冷枫☆ 阅读(1843) 评论(2) 编辑 收藏 举报最初使用FusionCharts 是在最近的一次项目中,要求生成图表展示数据。最终选择了FusionCharts ,感觉有必要对此总结一下。FusionCharts是InfoSoft Global公司的一款产品,FusionCharts提供了一个免费版本,虽然免费,功能依然强大,图形类型依然是很丰富的。 同时它也 是一个跨平台,跨浏览器的flash图表组件解决方案,能够被 ASP.NET, ASP, PHP, JSP, ColdFusion, Ruby on Rails, 简单 HTML 页面甚至PPT调用。你不需要知道任何关于flash编程的知识,你只需要知道你所用的编程语言就可以了。
大致图片样式如下:
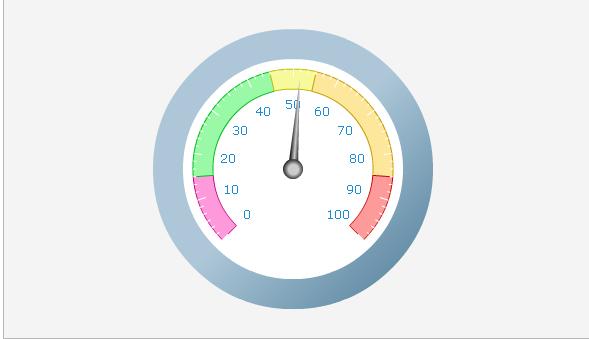
等等,图形库十分的丰富,更多的图形库以及demo演示可以查看 FusionCharts的官方网站http://www.fusioncharts.com/ 。介绍了这么多,现在来具体看看FusionCharts在asp.net中的使用吧。
首先,要使用FusionCharts 需要在其官方网站将其下载下来,下载后放在自己程序的目录中。如图所示:
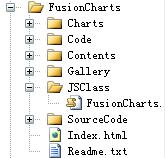
其中,charts目录里面是存放的需要使用到的.swf文件,code目录里面是各种不同语言的使用demo,contents目录里面则是以html形式的一些demo,能够比较直观的看见一些图表的详细信息以及数据源。主要的还是JsClass目录里面的fusioncharts.js文件。
下载完成并将其放置在程序目录中后,下面我们需要在程序中将下载的js引用到程序中来, 例如:
<script language="JavaScript" src="../JSClass/FusionCharts.js"></script> 具体路径视具体情况而定。
第二步,就是在后台程序中调取相应的图表flash了。当然,我这里指的是asp.net程序,html等地方的调用方法可以参考下载下来的文件,里面有详细的示例。
/// <summary>
/// 行业排名图表
/// </summary>
/// <param name="rankpe"></param>
/// <returns></returns>
public string thpm(string rankpe)
{
string xmlstr = "";
xmlstr += "<Chart upperLimit='100' lowerLimit='0' bgColor='E9E9E9' gaugeRoundRadius='7' borderColor='DCCEA1' chartTopMargin='17' chartBottomMargin='10' ticksBelowGauge='0' valuePadding='0' majorTMColor='323433' majorTMNumber='10' minorTMNumber='4' minorTMHeight='-4' majorTMHeight='-8' placeValuesInside='1' showShadow='0' pointerRadius='5' pointerBgColor='E00000' pointerBorderColor='E00000' showGaugeBorder='0' baseFontColor='FFFFFF' gaugeFillMix='' gaugeFillAlpha='0,0,0,0,0,0' sgaugeFillMix='{09DBFE},{32A6CF},{C1DFEA}' gaugeFillRatio='20,40,40' gaugeFillAngle='90' chartLeftMargin='30' chartRightMargin='30' animation='0'>";
xmlstr += "<ColorRange>";
xmlstr += "<Color minValue='0' maxValue='9' alpha='0'/>";
xmlstr += "</ColorRange>";
xmlstr += "<value>" + rankpe + "</value>";
xmlstr += "<annotations>";
xmlstr += "<annotationGroup id='Grp1' showBelow='1' >";
xmlstr += "<annotation type='rectangle' x='13' y='15' toX='574' toY='70' radius='8' color='004D69' />";
xmlstr += "<annotation type='rectangle' x='13' y='54' toX='574' toY='70' radius='8' color='055472,1D89AF' fillAngle='90'/>";
xmlstr += "<annotation type='rectangle' x='13' y='13' toX='574' toY='52' radius='8' color='09DBFE,32A6CF,0177A7' fillRatio='20,40,40' fillAngle='90'/>";
xmlstr += "<annotation type='rectangle' x='15' y='15' toX='574' toY='50' radius='8' color='09DBFE,32A6CF,C1DFEA' fillRatio='20,40,40' fillAngle='90'/>";
xmlstr += "</annotationGroup>";
xmlstr += "<annotationGroup id='Grp2' showBelow='1'>";
xmlstr += "<annotation type='text' label='' color='004D69' bold='1' x='190' y='43'/>";
xmlstr += "</annotationGroup>";
xmlstr += "</annotations>";
xmlstr += "<styles>";
xmlstr += "<definition>";
xmlstr += "<style name='TTipFont' type='Font' color='FFFFFF' bgColor='004D69' borderColor='004D69'/>";
xmlstr += "</definition>";
xmlstr += "<application>";
xmlstr += "<apply toObject='TOOLTIP' styles='TTipFont' />";
xmlstr += "</application>";
xmlstr += "</styles>";
xmlstr += "</Chart>";
string reval = FusionCharts.RenderChart("../FusionCharts/Charts/HLinearGauge.swf", "", xmlstr, "yjpm_myNext", "588", "80", false, false);
return reval;
}
这是一个行业排名图表的调用方法,封装好方法直接调用显示就可以了。如:this.Literal1.Text = thpm("参数"); 进行到这里一个简单的图表就生成出来了。里面的一些参数当然也是可以自己传递进去的,不过这里有一点是需要注意的,就是 封装的标签格式以及名称必须严格按照官方提供的数据格式,否则会出现图表不能正常生成的情况。
FusionCharts的功能是十分强大的,这里只是算抛砖引玉吧。更多神奇强大的效果还需要你进一步去尝试、发掘!
励志博客园--优秀的阅读、励志、交流学习平台。您的网上心灵家园!

