

prometheus监控mariadb
创建数据库账号
create user 'mysql_exporter'@'localhost' IDENTIFIED BY 'imnot007*';
GRANT PROCESS, REPLICATION CLIENT, SELECT ON *.* TO 'mysql_exporter'@'localhost';
下载mysql_exporter
wget https://github.com/prometheus/mysqld_exporter/releases/download/v0.14.0/mysqld_exporter-0.14.0.linux-amd64.tar.gz准备mysqld_exporter环境
[root@k8s-master ~]# tar -zxvf mysqld_exporter-0.14.0.linux-amd64.tar.gz

[root@k8s-master ~]# cp mysqld_exporter-0.14.0.linux-amd64/mysqld_exporter /usr/local/bin/

[root@k8s-master ~]# cat /root/.my.cnf
[client]
user=mysql_exporter
password=imnot007*

[root@k8s-master ~]# cat /etc/systemd/system/mysqld_exporter.service
[unit]
Description=Prometheus Node Exporter
After=network.target

[Service]
ExecStart=/usr/local/bin/mysqld_exporter --config.my-cnf=/root/.my.cnf

[install]
WantedBy=multi-user.target
配置prometheus
# vim prometheus.yml
- job_name: "prometheus-mysql-metrics"
static_configs:
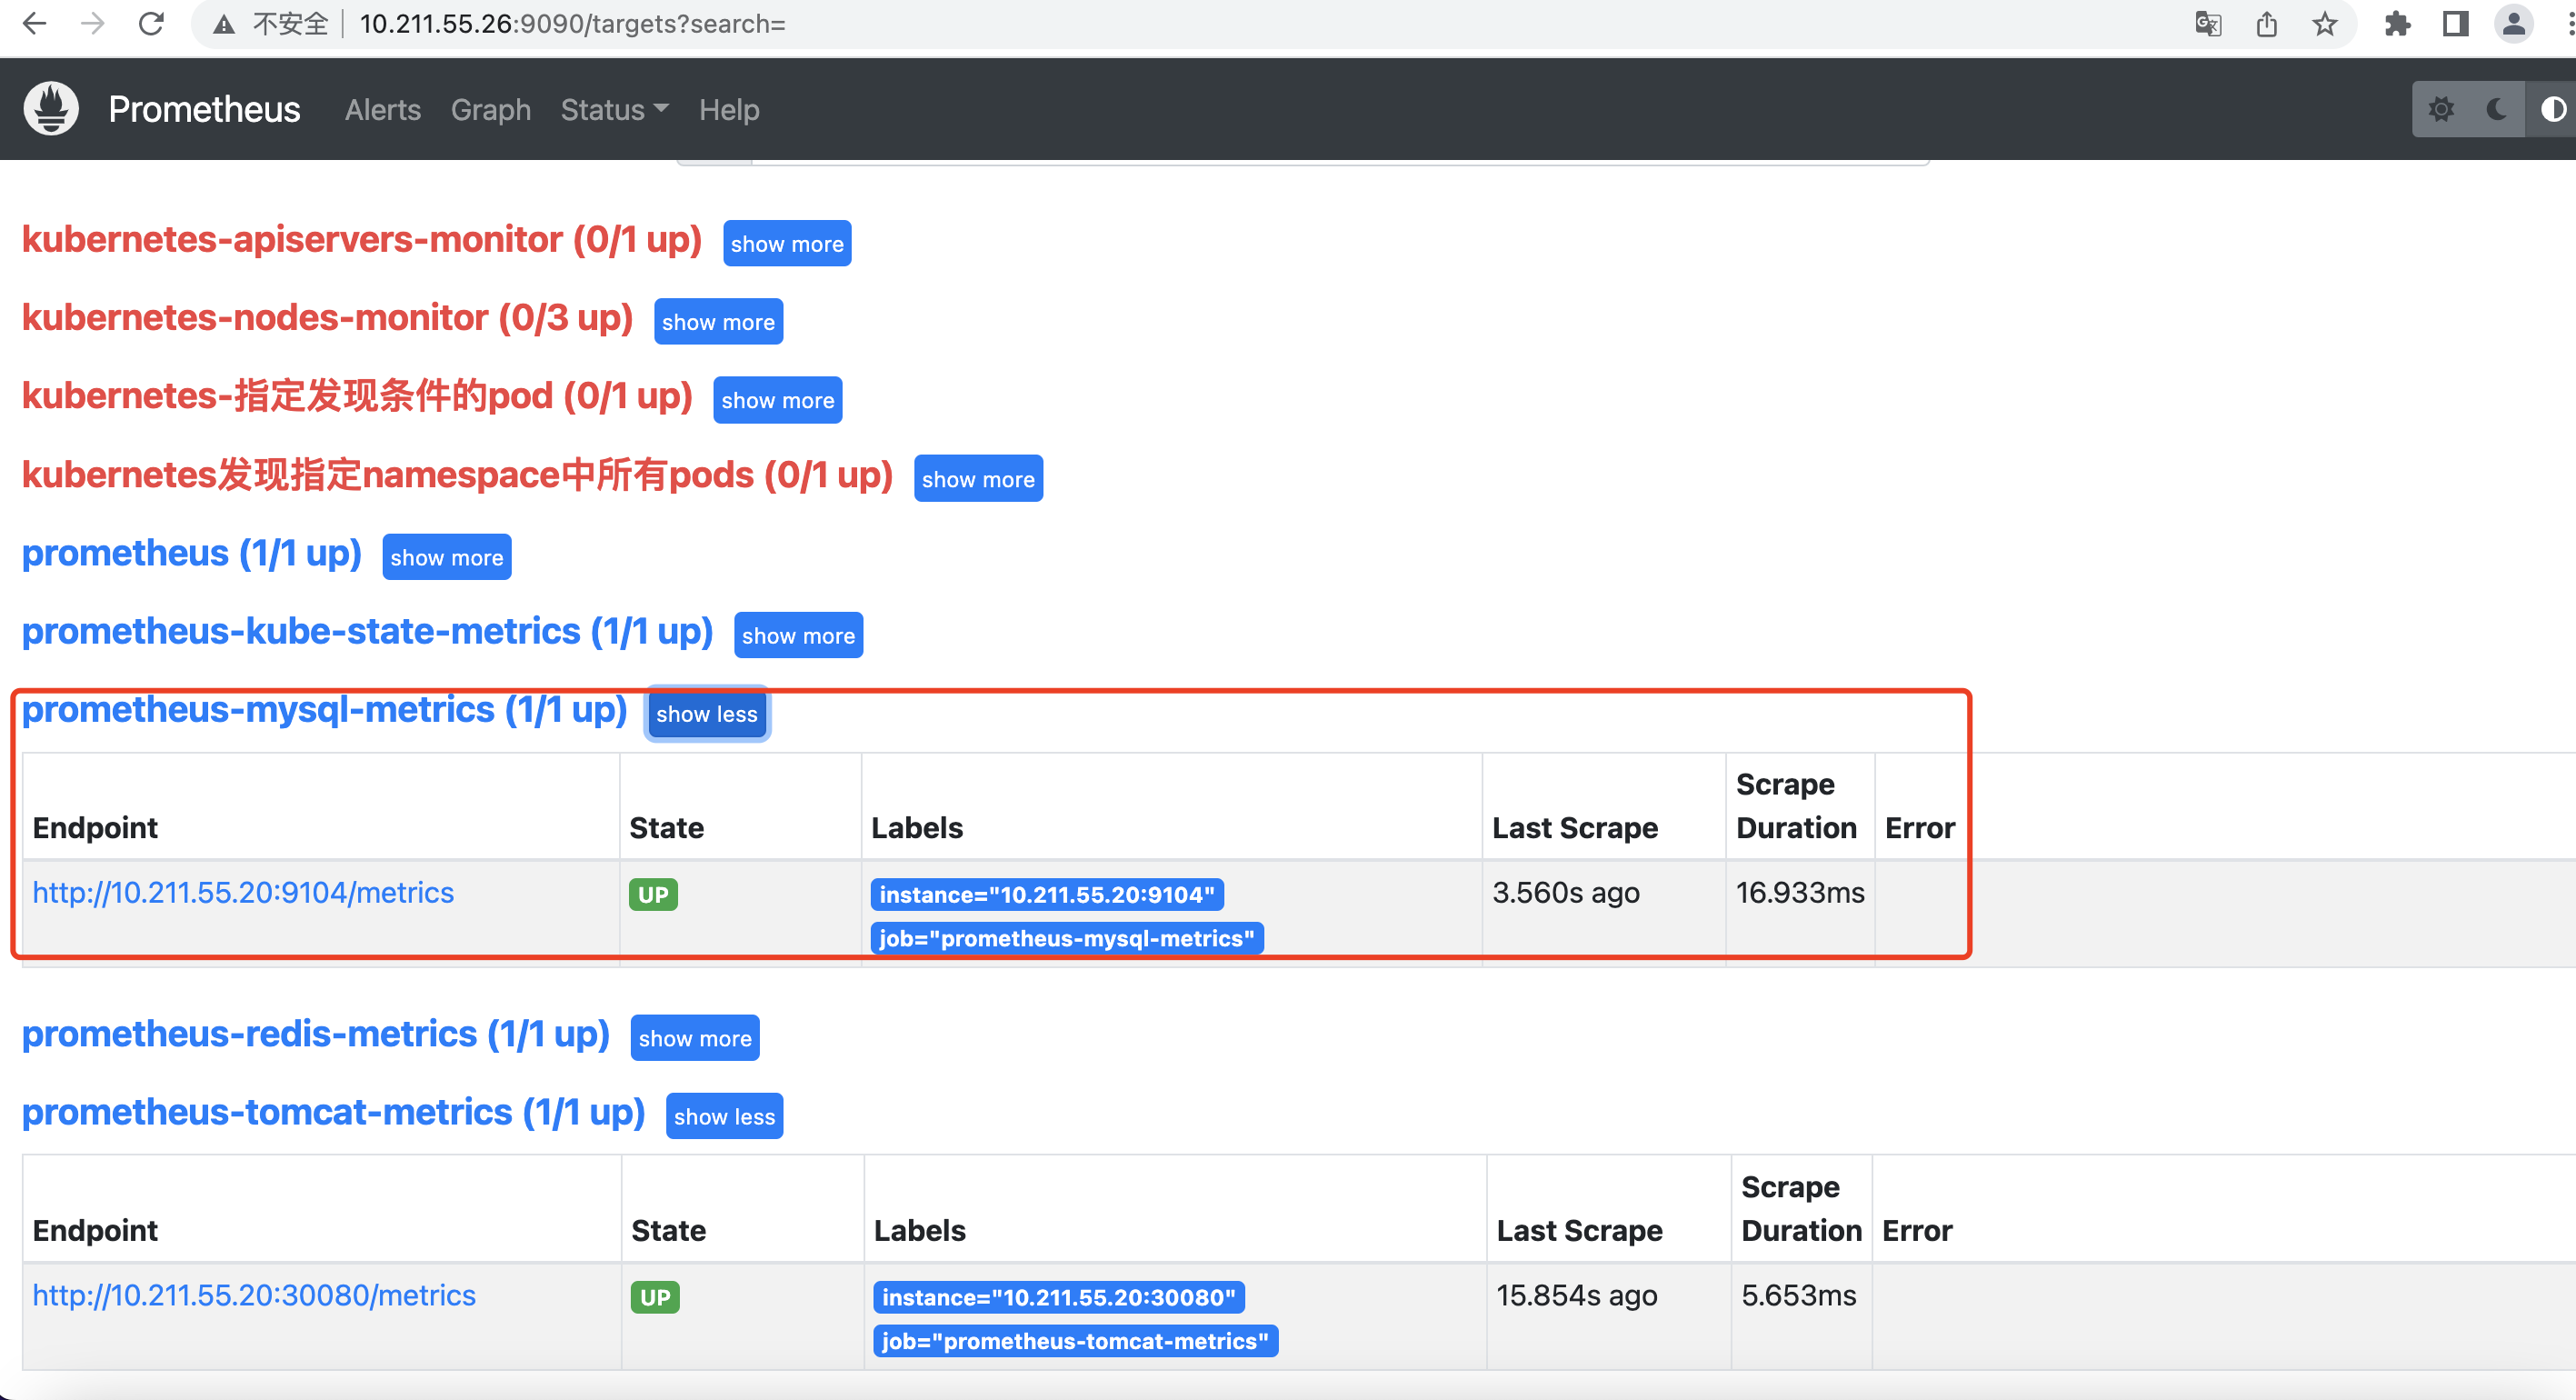
- targets: ["10.211.55.20:9104"]产看prometheus
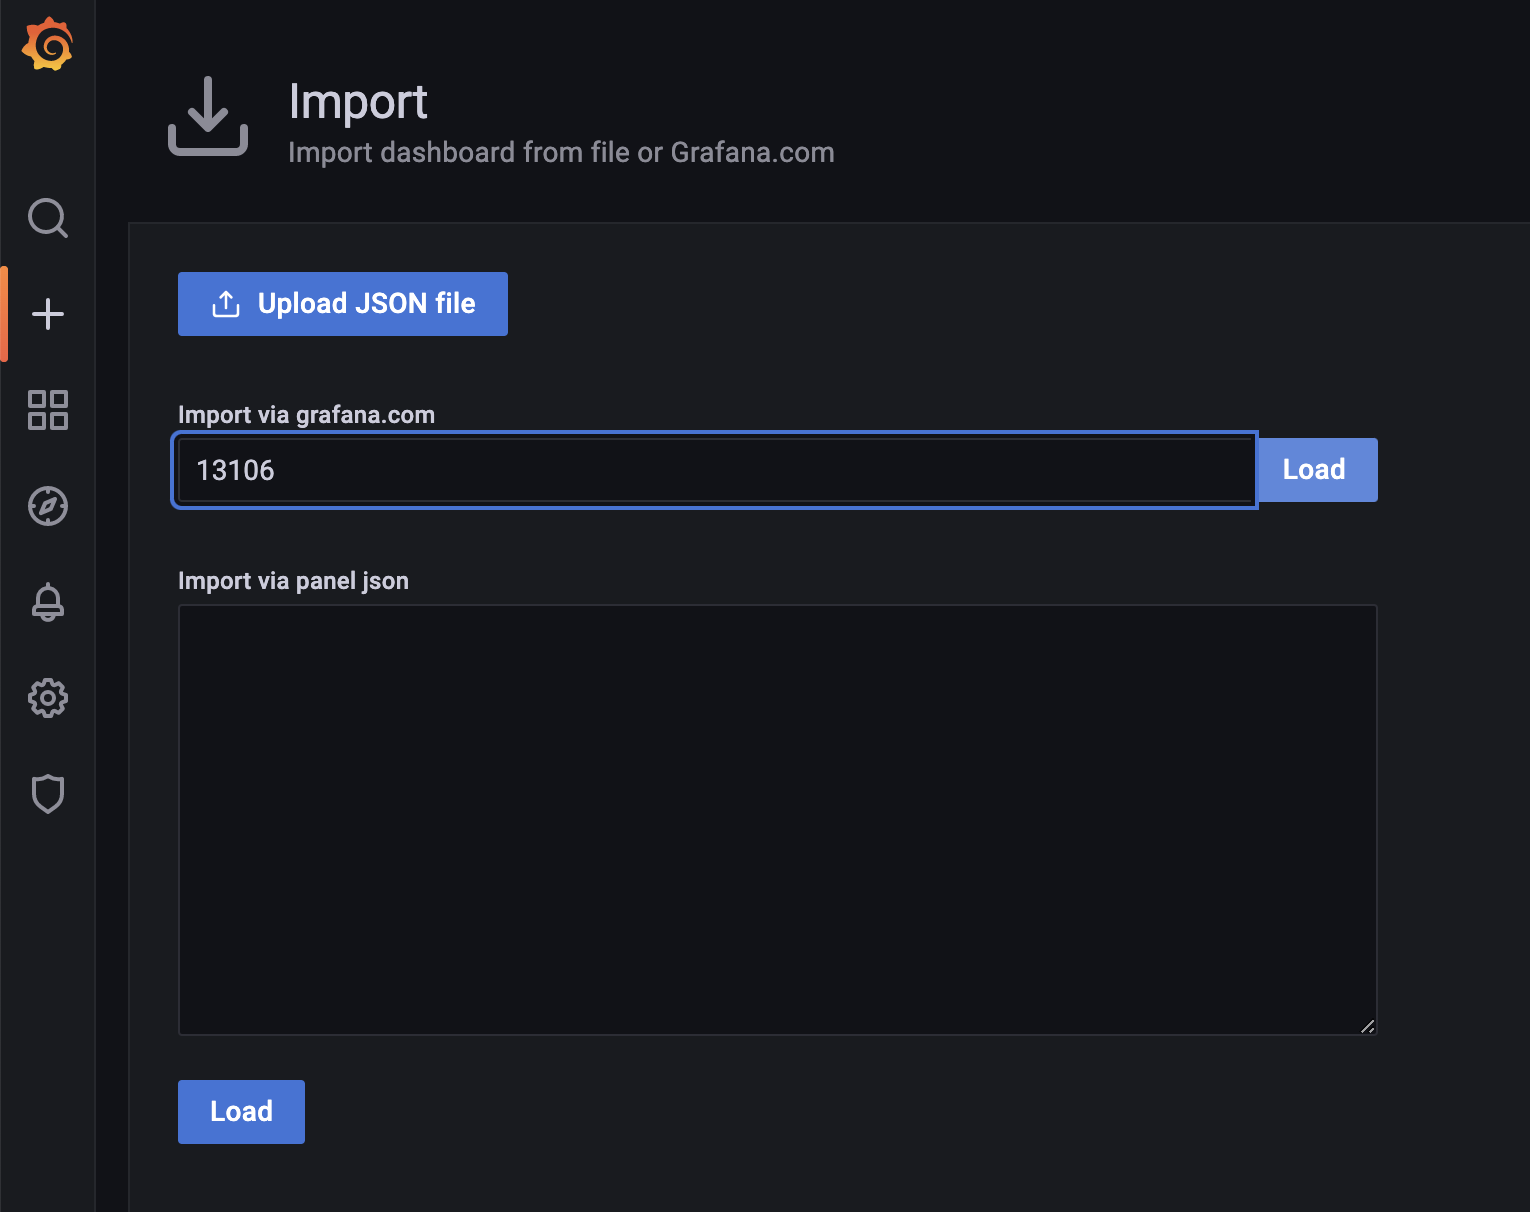
Grafana导入模板
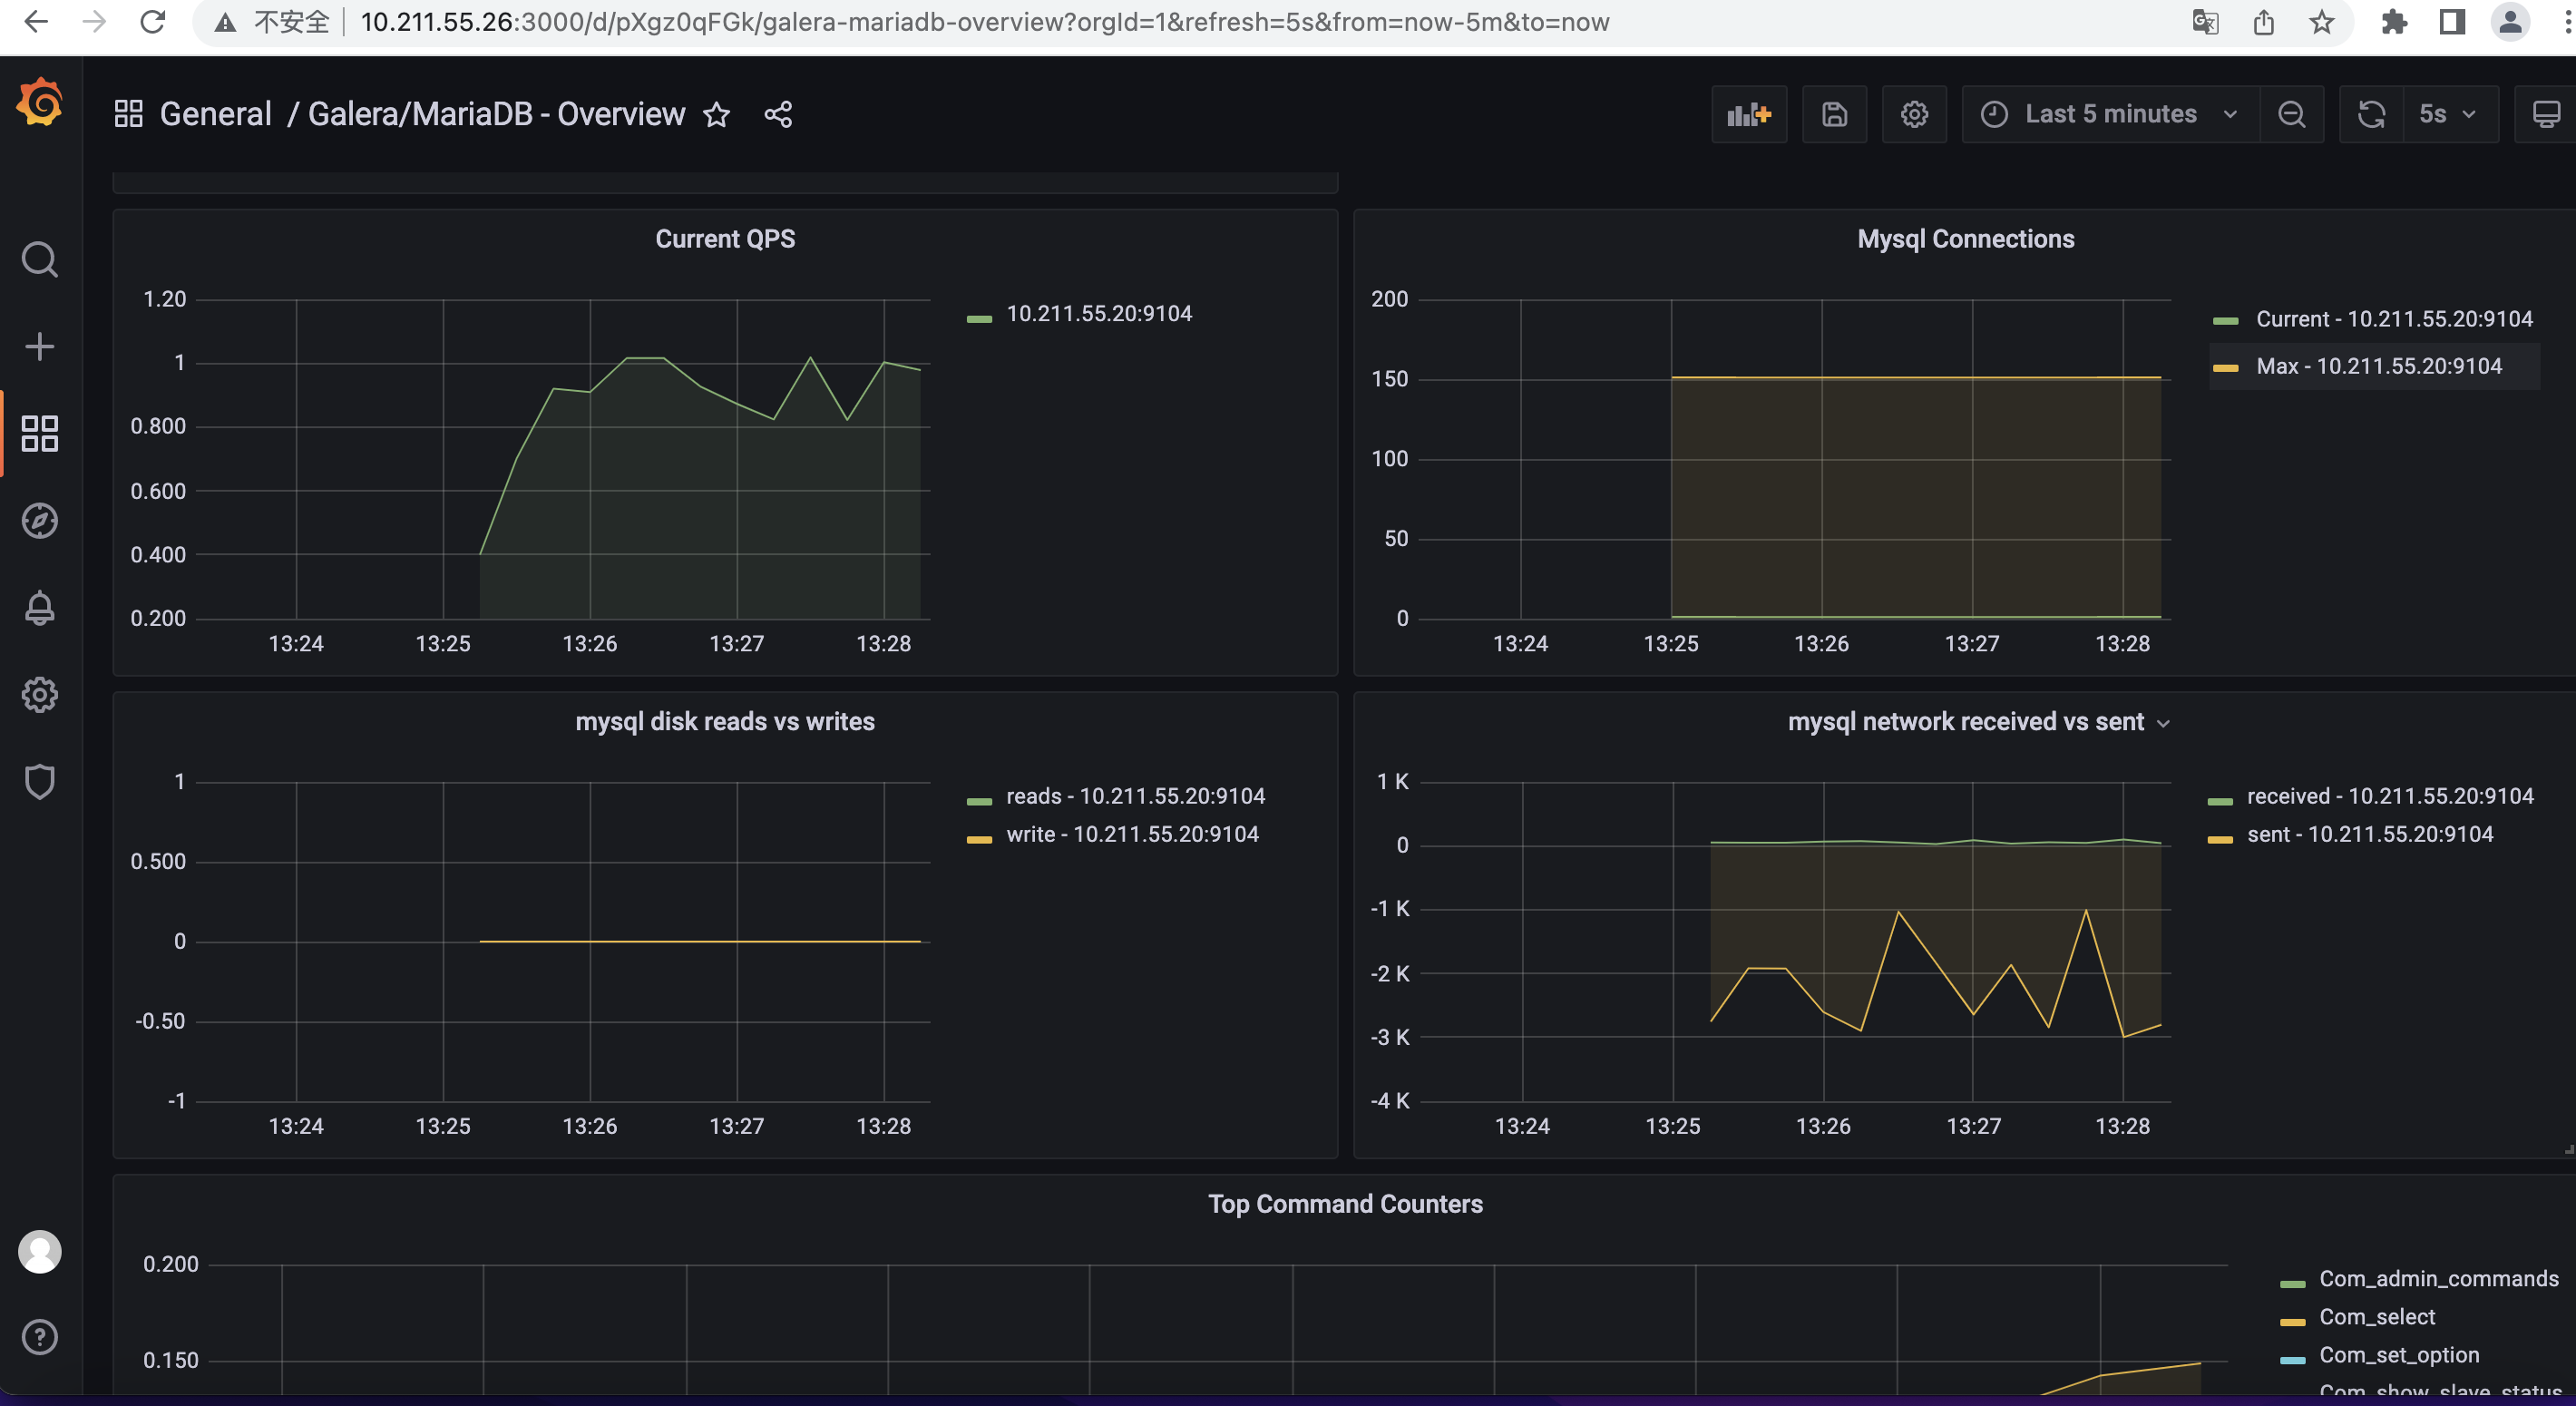
grafana查看监控
分类:
Prometheus


【推荐】国内首个AI IDE,深度理解中文开发场景,立即下载体验Trae
【推荐】编程新体验,更懂你的AI,立即体验豆包MarsCode编程助手
【推荐】抖音旗下AI助手豆包,你的智能百科全书,全免费不限次数
【推荐】轻量又高性能的 SSH 工具 IShell:AI 加持,快人一步
· 无需6万激活码!GitHub神秘组织3小时极速复刻Manus,手把手教你使用OpenManus搭建本
· C#/.NET/.NET Core优秀项目和框架2025年2月简报
· Manus爆火,是硬核还是营销?
· 终于写完轮子一部分:tcp代理 了,记录一下
· 【杭电多校比赛记录】2025“钉耙编程”中国大学生算法设计春季联赛(1)