

prometheus监控tomcat
制作tomcat镜像
[root@k8s-master tomcat-image]# ll
total 473764
-rwxr-xr-x 1 root root       126 Aug 11 18:06 build-command.sh
-rw-r--r-- 1 root root       697 Jun 12 15:59 Dockerfile
-rw-r--r-- 1 root root      3405 Dec 17  2021 metrics.war
drwxr-xr-x 2 root root      4096 Jun 12 15:51 myapp
-rw-r--r-- 1 root root       175 Jul 16  2021 myapp.tar.gz
-rwxr-xr-x 1 root root       125 Jul 16  2021 run_tomcat.sh
-rw-r--r-- 1 root root      7592 Jul 16  2021 server.xml
-rw-r--r-- 1 root root     59477 Dec 17  2021 simpleclient-0.8.0.jar
-rw-r--r-- 1 root root      5840 Dec 17  2021 simpleclient_common-0.8.0.jar
-rw-r--r-- 1 root root     21767 Dec 17  2021 simpleclient_hotspot-0.8.0.jar
-rw-r--r-- 1 root root      7104 Dec 17  2021 simpleclient_servlet-0.8.0.jar
-rw-r--r-- 1 root root 484967424 Dec 17  2021 tomcat-8.5.73-jdk11-corretto.tar.gz
-rw-r--r-- 1 root root     19582 Dec 17  2021 tomcat_exporter_client-0.0.12.jar
-rw-r--r-- 1 root root      3405 Dec 17  2021 tomcat_exporter_servlet-0.0.12.war
[root@k8s-master tomcat-image]# cat build-command.sh
#!/bin/bash

docker build -t harbor.yangzhenyu.com/yzy/tomcat-app1:v1 .

docker push harbor.yangzhenyu.com/yzy/tomcat-app1:v1
[root@k8s-master tomcat-image]# cat Dockerfile
#FROM tomcat:8.5.73-jdk11-corretto
FROM tomcat:8.5.73

LABEL maintainer="jack 2973707860@qq.com"

ADD server.xml /usr/local/tomcat/conf/server.xml

RUN mkdir /data/tomcat/webapps -p
ADD myapp /data/tomcat/webapps/myapp
ADD metrics.war /data/tomcat/webapps
ADD simpleclient-0.8.0.jar  /usr/local/tomcat/lib/
ADD simpleclient_common-0.8.0.jar /usr/local/tomcat/lib/
ADD simpleclient_hotspot-0.8.0.jar /usr/local/tomcat/lib/
ADD simpleclient_servlet-0.8.0.jar /usr/local/tomcat/lib/
ADD tomcat_exporter_client-0.0.12.jar /usr/local/tomcat/lib/


#ADD run_tomcat.sh /apps/tomcat/bin/

EXPOSE 8080 8443 8009

CMD ["/usr/local/tomcat/bin/catalina.sh","run"]

#CMD ["/apps/tomcat/bin/run_tomcat.sh"]
制作镜像将镜像传输到自己的harbor
bash build-command.sh在k8s中启动tomcat
[root@k8s-master yaml]# cat tomcat-deploy.yaml
apiVersion: apps/v1
kind: Deployment
metadata:
  name: tomcat-deployment
  namespace: yangzhenyu
spec:
  selector:
    matchLabels:
     app: tomcat
  replicas: 1 # tells deployment to run 2 pods matching the template
  template: # create pods using pod definition in this template
    metadata:
      labels:
        app: tomcat
      annotations:
        prometheus.io/scrape: 'true'
    spec:
      containers:
      - name: tomcat
        image: harbor.yangzhenyu.com/yzy/tomcat-app1:v1
        ports:
        - containerPort: 8080
        securityContext:
          privileged: true
[root@k8s-master yaml]# cat tomcat-svc.yaml
kind: Service  #service 类型
apiVersion: v1
metadata:
  annotations:
    prometheus.io/scrape: 'true'
  name: tomcat-service
  namespace: yangzhenyu
spec:
  selector:
    app: tomcat
  ports:
  - nodePort: 30080
    port: 80
    protocol: TCP
    targetPort: 8080
  type: NodePort
浏览器访问http://10.211.55.20:30080/metrics/,如果有数据就是正常的
看下是否正常 http://10.211.55.20:30080/myapp/
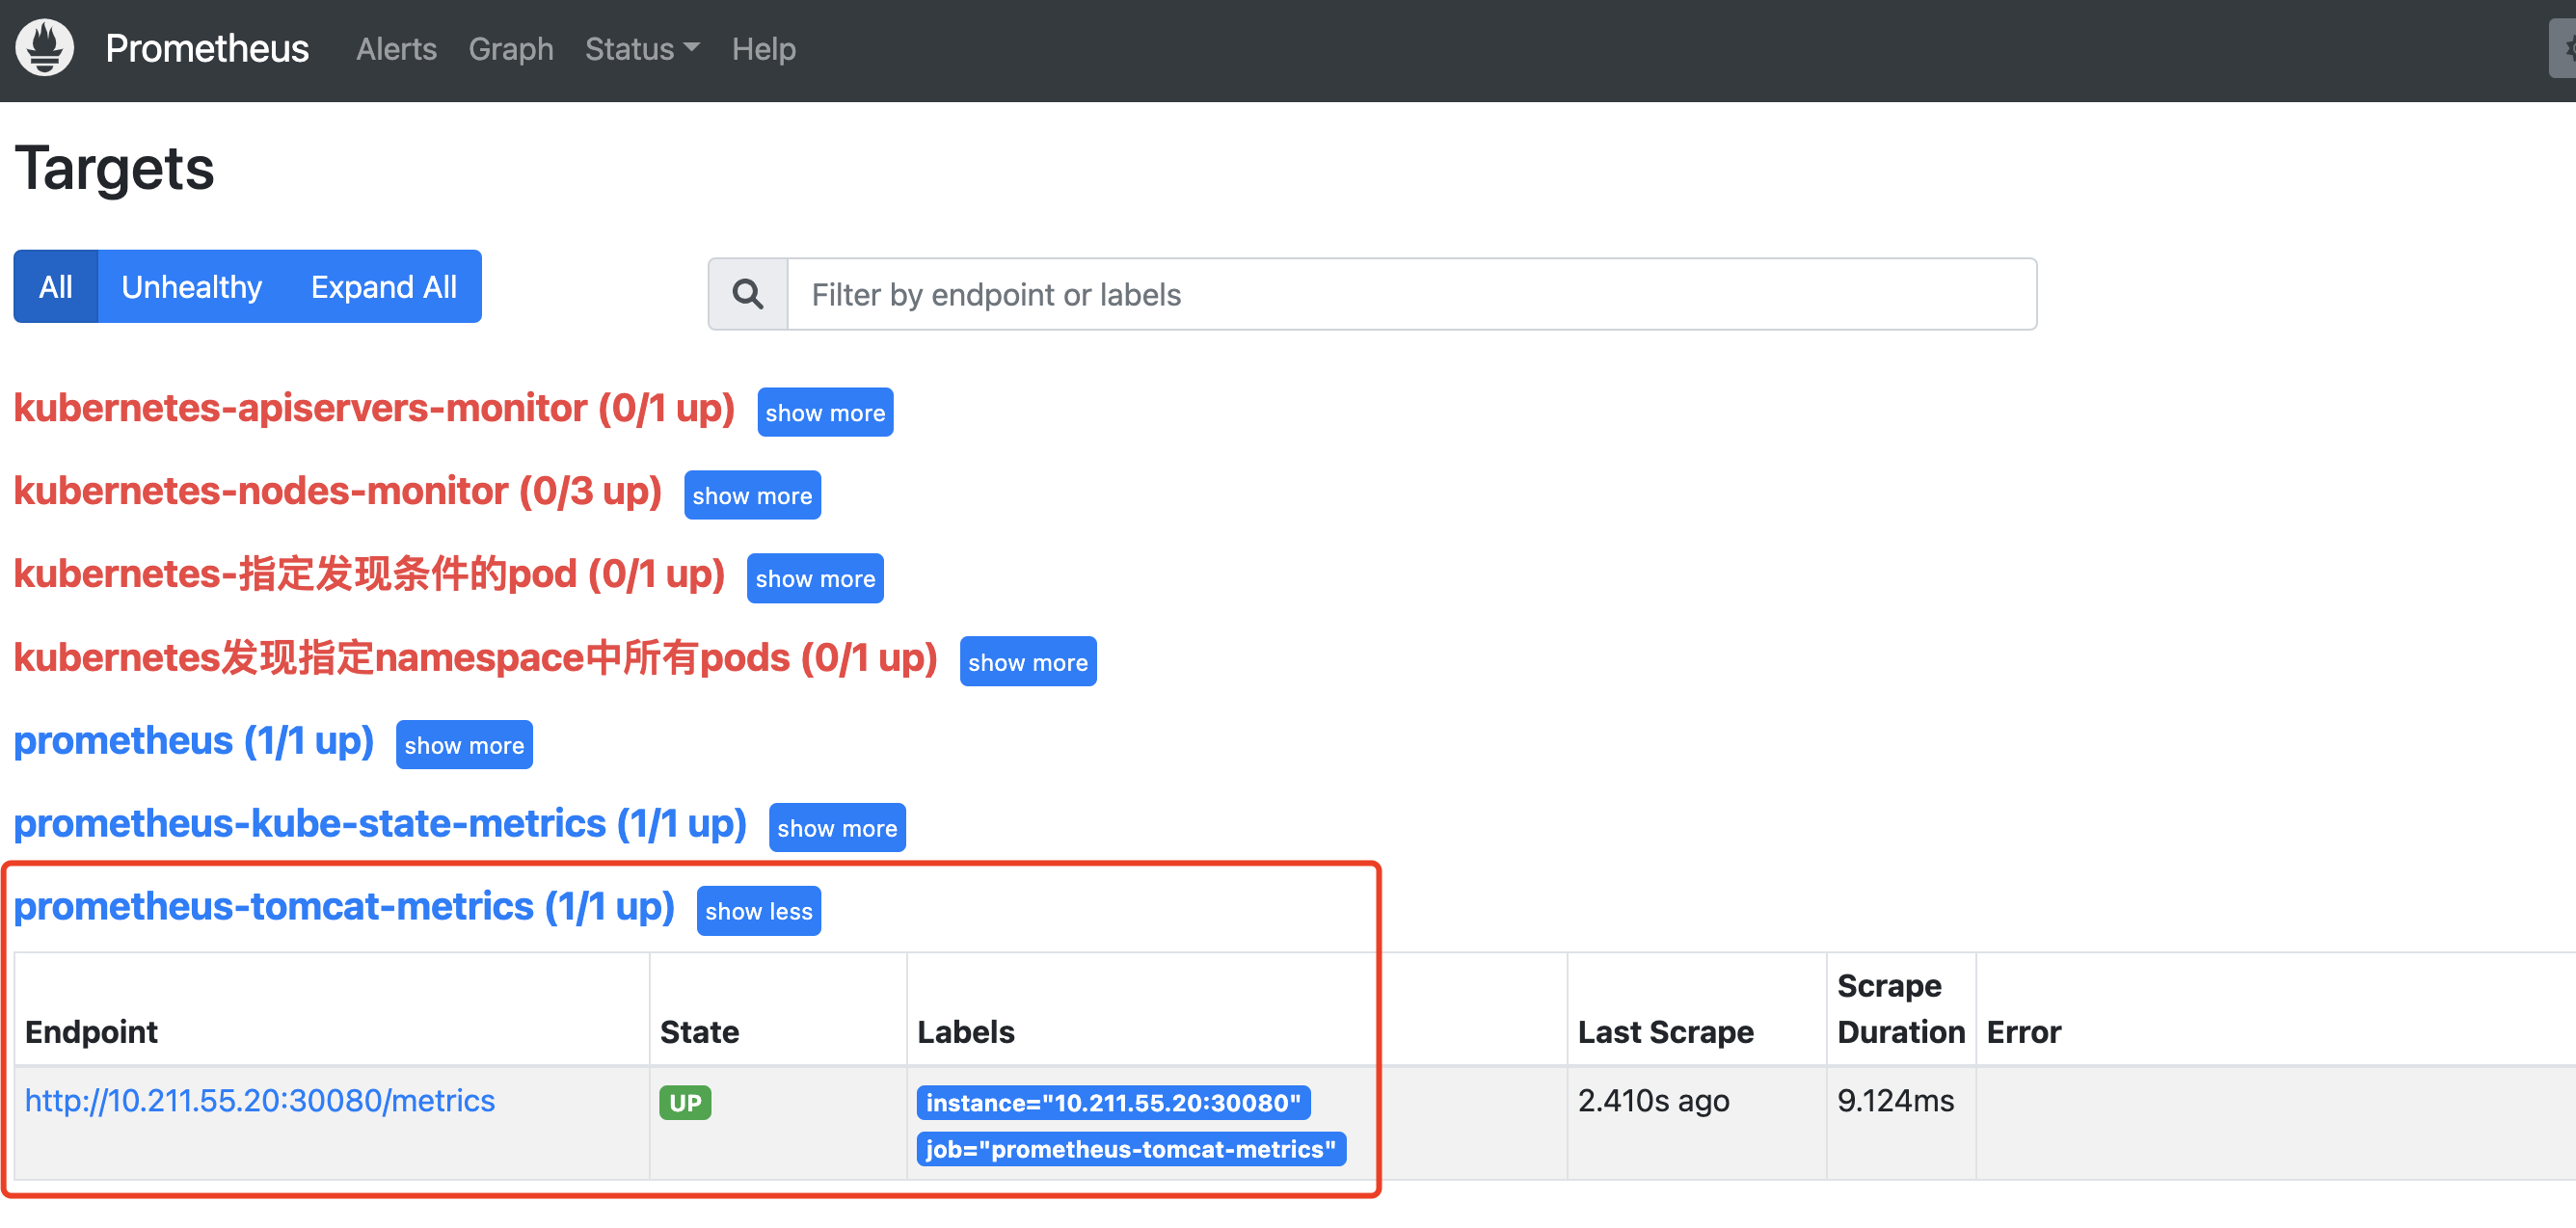
编辑prometheus.yml
  - job_name: "prometheus-tomcat-metrics"
    static_configs:
      - targets: ["10.211.55.20:30080"]
重启prometheus
systemctl restart prometheus访问prometheus可以看到tomcat监控数据了
Grafana导入模板
copy下面地址json文件
https://github.com/nlighten/tomcat_exporter/blob/master/dashboard/example.json
查看代码
{
"__inputs": [
{
"name": "DS_PROMETHEUS",
"label": "Prometheus",
"description": "",
"type": "datasource",
"pluginId": "prometheus",
"pluginName": "Prometheus"
}
],
"__requires": [
{
"type": "grafana",
"id": "grafana",
"name": "Grafana",
"version": "7.3.6"
},
{
"type": "panel",
"id": "graph",
"name": "Graph",
"version": ""
},
{
"type": "panel",
"id": "heatmap",
"name": "Heatmap",
"version": ""
},
{
"type": "datasource",
"id": "prometheus",
"name": "Prometheus",
"version": "1.0.0"
},
{
"type": "panel",
"id": "stat",
"name": "Stat",
"version": ""
},
{
"type": "panel",
"id": "table",
"name": "Table",
"version": ""
},
{
"type": "panel",
"id": "text",
"name": "Text",
"version": ""
}
],
"annotations": {
"list": [
{
"builtIn": 1,
"datasource": "-- Grafana --",
"enable": true,
"hide": true,
"iconColor": "rgba(0, 211, 255, 1)",
"name": "Annotations & Alerts",
"type": "dashboard"
}
]
},
"editable": true,
"gnetId": null,
"graphTooltip": 1,
"id": null,
"iteration": 1633634435078,
"links": [],
"panels": [
{
"collapsed": false,
"datasource": "${DS_PROMETHEUS}",
"gridPos": {
"h": 1,
"w": 24,
"x": 0,
"y": 0
},
"id": 25,
"panels": [],
"title": "General Info",
"type": "row"
},
{
"datasource": "${DS_PROMETHEUS}",
"fieldConfig": {
"defaults": {
"custom": {},
"mappings": [
{
"from": "-999999999999999",
"id": 1,
"text": "N/A",
"to": "0",
"type": 2,
"value": "<0"
}
],
"thresholds": {
"mode": "absolute",
"steps": [
{
"color": "green",
"value": null
}
]
}
},
"overrides": []
},
"gridPos": {
"h": 3,
"w": 3,
"x": 0,
"y": 1
},
"id": 51,
"options": {
"colorMode": "value",
"graphMode": "area",
"justifyMode": "auto",
"orientation": "auto",
"reduceOptions": {
"calcs": [
"mean"
],
"fields": "",
"values": false
},
"textMode": "name"
},
"pluginVersion": "7.3.6",
"targets": [
{
"expr": "jvm_info{instance=\"$node\",job=\"$job\"}",
"format": "time_series",
"instant": true,
"interval": "",
"legendFormat": "{{vendor}}",
"refId": "A"
}
],
"timeFrom": null,
"timeShift": null,
"title": "JVM Runtime Vendor",
"type": "stat"
},
{
"datasource": "${DS_PROMETHEUS}",
"fieldConfig": {
"defaults": {
"custom": {},
"mappings": [
{
"from": "-999999999999999",
"id": 1,
"text": "N/A",
"to": "0",
"type": 2,
"value": "<0"
}
],
"thresholds": {
"mode": "absolute",
"steps": [
{
"color": "green",
"value": null
}
]
}
},
"overrides": []
},
"gridPos": {
"h": 3,
"w": 6,
"x": 3,
"y": 1
},
"id": 49,
"options": {
"colorMode": "value",
"graphMode": "area",
"justifyMode": "auto",
"orientation": "auto",
"reduceOptions": {
"calcs": [
"mean"
],
"fields": "",
"values": false
},
"textMode": "name"
},
"pluginVersion": "7.3.6",
"targets": [
{
"expr": "jvm_info{instance=\"$node\",job=\"$job\"}",
"format": "time_series",
"instant": true,
"interval": "",
"legendFormat": "{{runtime}}",
"refId": "A"
}
],
"timeFrom": null,
"timeShift": null,
"title": "JVM Runtime",
"type": "stat"
},
{
"datasource": "${DS_PROMETHEUS}",
"fieldConfig": {
"defaults": {
"custom": {},
"mappings": [
{
"from": "-999999999999999",
"id": 1,
"text": "N/A",
"to": "0",
"type": 2,
"value": "<0"
}
],
"thresholds": {
"mode": "absolute",
"steps": [
{
"color": "green",
"value": null
}
]
}
},
"overrides": []
},
"gridPos": {
"h": 3,
"w": 3,
"x": 9,
"y": 1
},
"id": 50,
"options": {
"colorMode": "value",
"graphMode": "area",
"justifyMode": "auto",
"orientation": "auto",
"reduceOptions": {
"calcs": [
"mean"
],
"fields": "",
"values": false
},
"textMode": "name"
},
"pluginVersion": "7.3.6",
"targets": [
{
"expr": "jvm_info{instance=\"$node\",job=\"$job\"}",
"format": "time_series",
"instant": true,
"interval": "",
"legendFormat": "{{version}}",
"refId": "A"
}
],
"timeFrom": null,
"timeShift": null,
"title": "JVM Runtime Version",
"type": "stat"
},
{
"datasource": "${DS_PROMETHEUS}",
"fieldConfig": {
"defaults": {
"custom": {},
"mappings": [
{
"from": "-999999999999999",
"id": 1,
"text": "N/A",
"to": "0",
"type": 2,
"value": "<0"
}
],
"thresholds": {
"mode": "absolute",
"steps": [
{
"color": "green",
"value": null
}
]
}
},
"overrides": []
},
"gridPos": {
"h": 3,
"w": 3,
"x": 12,
"y": 1
},
"id": 22,
"options": {
"colorMode": "value",
"graphMode": "area",
"justifyMode": "auto",
"orientation": "auto",
"reduceOptions": {
"calcs": [
"mean"
],
"fields": "",
"values": false
},
"textMode": "auto"
},
"pluginVersion": "7.3.6",
"targets": [
{
"expr": "(time()-(process_start_time_seconds{instance=\"$node\",job=\"$job\"})) /60/60",
"format": "table",
"instant": true,
"interval": "",
"legendFormat": "",
"refId": "A"
}
],
"timeFrom": null,
"timeShift": null,
"title": "JVM Uptime Hrs",
"type": "stat"
},
{
"datasource": "${DS_PROMETHEUS}",
"description": "The number of classes that are currently loaded in the JVM",
"fieldConfig": {
"defaults": {
"custom": {},
"mappings": [
{
"from": "-999999999999999",
"id": 1,
"text": "N/A",
"to": "0",
"type": 2,
"value": "<0"
}
],
"thresholds": {
"mode": "absolute",
"steps": [
{
"color": "green",
"value": null
}
]
}
},
"overrides": []
},
"gridPos": {
"h": 3,
"w": 3,
"x": 15,
"y": 1
},
"id": 46,
"options": {
"colorMode": "value",
"graphMode": "area",
"justifyMode": "auto",
"orientation": "auto",
"reduceOptions": {
"calcs": [
"mean"
],
"fields": "",
"values": false
},
"textMode": "auto"
},
"pluginVersion": "7.3.6",
"targets": [
{
"expr": "jvm_classes_loaded{instance=\"$node\",job=\"$job\"}",
"format": "table",
"instant": true,
"interval": "",
"legendFormat": "",
"refId": "A"
}
],
"timeFrom": null,
"timeShift": null,
"title": "JVM Classes Loaded",
"type": "stat"
},
{
"aliasColors": {},
"bars": false,
"dashLength": 10,
"dashes": false,
"datasource": "${DS_PROMETHEUS}",
"description": "Indication if the lifecycle state of this context is STARTED",
"fieldConfig": {
"defaults": {
"custom": {}
},
"overrides": []
},
"fill": 1,
"fillGradient": 0,
"gridPos": {
"h": 8,
"w": 12,
"x": 0,
"y": 4
},
"hiddenSeries": false,
"id": 34,
"legend": {
"avg": false,
"current": false,
"max": false,
"min": false,
"show": true,
"total": false,
"values": false
},
"lines": true,
"linewidth": 1,
"nullPointMode": "null",
"options": {
"alertThreshold": true
},
"percentage": false,
"pluginVersion": "7.3.6",
"pointradius": 2,
"points": false,
"renderer": "flot",
"seriesOverrides": [],
"spaceLength": 10,
"stack": false,
"steppedLine": false,
"targets": [
{
"expr": "tomcat_context_state_started{instance=\"$node\",job=\"$job\"}",
"interval": "",
"intervalFactor": 1,
"legendFormat": "{{context}}",
"refId": "A"
}
],
"thresholds": [],
"timeFrom": null,
"timeRegions": [],
"timeShift": null,
"title": "Application Contexts Started",
"tooltip": {
"shared": true,
"sort": 0,
"value_type": "individual"
},
"type": "graph",
"xaxis": {
"buckets": null,
"mode": "time",
"name": null,
"show": true,
"values": []
},
"yaxes": [
{
"format": "short",
"label": null,
"logBase": 1,
"max": null,
"min": null,
"show": true
},
{
"format": "short",
"label": null,
"logBase": 1,
"max": null,
"min": null,
"show": true
}
],
"yaxis": {
"align": false,
"alignLevel": null
}
},
{
"aliasColors": {},
"bars": false,
"dashLength": 10,
"dashes": false,
"datasource": "${DS_PROMETHEUS}",
"description": "Count of JVM garbage collector runs",
"fieldConfig": {
"defaults": {
"custom": {}
},
"overrides": []
},
"fill": 1,
"fillGradient": 0,
"gridPos": {
"h": 8,
"w": 12,
"x": 0,
"y": 12
},
"hiddenSeries": false,
"id": 47,
"legend": {
"avg": false,
"current": false,
"max": false,
"min": false,
"show": true,
"total": false,
"values": false
},
"lines": true,
"linewidth": 1,
"nullPointMode": "null",
"options": {
"alertThreshold": true
},
"percentage": false,
"pluginVersion": "7.3.6",
"pointradius": 2,
"points": false,
"renderer": "flot",
"seriesOverrides": [],
"spaceLength": 10,
"stack": false,
"steppedLine": false,
"targets": [
{
"expr": "rate(jvm_gc_collection_seconds_count{instance=\"$node\",job=\"$job\"}[1m])*100",
"interval": "",
"intervalFactor": 1,
"legendFormat": "{{gc}}",
"refId": "A"
}
],
"thresholds": [],
"timeFrom": null,
"timeRegions": [],
"timeShift": null,
"title": "Garbage Collection Runs /sec over 1 min",
"tooltip": {
"shared": true,
"sort": 0,
"value_type": "individual"
},
"type": "graph",
"xaxis": {
"buckets": null,
"mode": "time",
"name": null,
"show": true,
"values": []
},
"yaxes": [
{
"format": "short",
"label": null,
"logBase": 1,
"max": null,
"min": null,
"show": true
},
{
"format": "short",
"label": null,
"logBase": 1,
"max": null,
"min": null,
"show": true
}
],
"yaxis": {
"align": false,
"alignLevel": null
}
},
{
"aliasColors": {},
"bars": false,
"dashLength": 10,
"dashes": false,
"datasource": "${DS_PROMETHEUS}",
"description": "Time spent in a given JVM garbage collector in seconds.",
"fieldConfig": {
"defaults": {
"custom": {}
},
"overrides": []
},
"fill": 1,
"fillGradient": 0,
"gridPos": {
"h": 8,
"w": 12,
"x": 0,
"y": 20
},
"hiddenSeries": false,
"id": 48,
"legend": {
"avg": false,
"current": false,
"max": false,
"min": false,
"show": true,
"total": false,
"values": false
},
"lines": true,
"linewidth": 1,
"nullPointMode": "null",
"options": {
"alertThreshold": true
},
"percentage": false,
"pluginVersion": "7.3.6",
"pointradius": 2,
"points": false,
"renderer": "flot",
"seriesOverrides": [],
"spaceLength": 10,
"stack": false,
"steppedLine": false,
"targets": [
{
"expr": "rate(jvm_gc_collection_seconds_sum{instance=\"$node\",job=\"$job\"}[1m])*100",
"interval": "",
"intervalFactor": 1,
"legendFormat": "{{gc}}",
"refId": "A"
}
],
"thresholds": [],
"timeFrom": null,
"timeRegions": [],
"timeShift": null,
"title": "GC time in sec over 1 min",
"tooltip": {
"shared": true,
"sort": 0,
"value_type": "individual"
},
"type": "graph",
"xaxis": {
"buckets": null,
"mode": "time",
"name": null,
"show": true,
"values": []
},
"yaxes": [
{
"format": "short",
"label": null,
"logBase": 1,
"max": null,
"min": null,
"show": true
},
{
"format": "short",
"label": null,
"logBase": 1,
"max": null,
"min": null,
"show": true
}
],
"yaxis": {
"align": false,
"alignLevel": null
}
},
{
"cards": {
"cardPadding": null,
"cardRound": null
},
"color": {
"cardColor": "#b4ff00",
"colorScale": "sqrt",
"colorScheme": "interpolateOranges",
"exponent": 0.5,
"mode": "spectrum"
},
"dataFormat": "timeseries",
"datasource": "${DS_PROMETHEUS}",
"description": "JVM garbage run times",
"fieldConfig": {
"defaults": {
"custom": {
"align": null,
"filterable": false
},
"mappings": [],
"thresholds": {
"mode": "absolute",
"steps": [
{
"color": "green",
"value": null
},
{
"color": "red",
"value": 80
}
]
}
},
"overrides": []
},
"gridPos": {
"h": 8,
"w": 12,
"x": 0,
"y": 28
},
"heatmap": {},
"hideZeroBuckets": false,
"highlightCards": true,
"id": 52,
"legend": {
"show": false
},
"pluginVersion": "7.3.6",
"reverseYBuckets": false,
"targets": [
{
"expr": "(rate(jvm_gc_collection_seconds_sum{instance=\"$node\",job=\"$job\"}[1m])*100 / rate(jvm_gc_collection_seconds_count{instance=\"$node\",job=\"$job\"}[1m])*100)",
"instant": false,
"interval": "",
"intervalFactor": 1,
"legendFormat": "{{gc}}",
"refId": "A"
}
],
"timeFrom": null,
"timeShift": null,
"title": "Avg Time (ms) / GC 1 minute rate",
"tooltip": {
"show": true,
"showHistogram": false
},
"type": "heatmap",
"xAxis": {
"show": true
},
"xBucketNumber": null,
"xBucketSize": null,
"yAxis": {
"decimals": null,
"format": "short",
"logBase": 1,
"max": null,
"min": null,
"show": true,
"splitFactor": null
},
"yBucketBound": "auto",
"yBucketNumber": null,
"yBucketSize": null
},
{
"collapsed": true,
"datasource": "${DS_PROMETHEUS}",
"gridPos": {
"h": 1,
"w": 24,
"x": 0,
"y": 36
},
"id": 5,
"panels": [
{
"datasource": "${DS_PROMETHEUS}",
"description": "Started thread count of a JVM",
"fieldConfig": {
"defaults": {
"custom": {},
"mappings": [
{
"from": "-999999999999999",
"id": 1,
"text": "N/A",
"to": "0",
"type": 2,
"value": "<0"
}
],
"thresholds": {
"mode": "absolute",
"steps": [
{
"color": "green",
"value": null
}
]
}
},
"overrides": []
},
"gridPos": {
"h": 4,
"w": 3,
"x": 0,
"y": 37
},
"id": 18,
"options": {
"colorMode": "value",
"graphMode": "area",
"justifyMode": "auto",
"orientation": "auto",
"reduceOptions": {
"calcs": [
"mean"
],
"fields": "",
"values": false
},
"textMode": "auto"
},
"pluginVersion": "7.3.6",
"targets": [
{
"expr": "jvm_threads_started_total{instance=\"$node\",job=\"$job\"}",
"format": "table",
"instant": true,
"interval": "",
"legendFormat": "",
"refId": "A"
}
],
"timeFrom": null,
"timeShift": null,
"title": "JVM Threads Started Total",
"type": "stat"
},
{
"datasource": "${DS_PROMETHEUS}",
"description": "Current thread count of a JVM",
"fieldConfig": {
"defaults": {
"custom": {},
"mappings": [
{
"from": "-999999999999999",
"id": 1,
"text": "N/A",
"to": "0",
"type": 2,
"value": "<0"
}
],
"thresholds": {
"mode": "absolute",
"steps": [
{
"color": "green",
"value": null
}
]
}
},
"overrides": []
},
"gridPos": {
"h": 4,
"w": 3,
"x": 3,
"y": 37
},
"id": 20,
"options": {
"colorMode": "value",
"graphMode": "area",
"justifyMode": "auto",
"orientation": "auto",
"reduceOptions": {
"calcs": [
"mean"
],
"fields": "",
"values": false
},
"textMode": "auto"
},
"pluginVersion": "7.3.6",
"targets": [
{
"expr": "jvm_threads_current{instance=\"$node\",job=\"$job\"}",
"format": "table",
"instant": true,
"interval": "",
"legendFormat": "",
"refId": "A"
}
],
"timeFrom": null,
"timeShift": null,
"title": "JVM Threads Current",
"type": "stat"
},
{
"datasource": "${DS_PROMETHEUS}",
"description": "Peak thread count of a JVM",
"fieldConfig": {
"defaults": {
"custom": {},
"mappings": [
{
"from": "-999999999999999",
"id": 1,
"text": "N/A",
"to": "0",
"type": 2,
"value": "<0"
}
],
"thresholds": {
"mode": "absolute",
"steps": [
{
"color": "green",
"value": null
}
]
}
},
"overrides": []
},
"gridPos": {
"h": 4,
"w": 3,
"x": 6,
"y": 37
},
"id": 19,
"options": {
"colorMode": "value",
"graphMode": "area",
"justifyMode": "auto",
"orientation": "auto",
"reduceOptions": {
"calcs": [
"mean"
],
"fields": "",
"values": false
},
"textMode": "auto"
},
"pluginVersion": "7.3.6",
"targets": [
{
"expr": "jvm_threads_peak{instance=\"$node\",job=\"$job\"}",
"format": "table",
"instant": true,
"interval": "",
"legendFormat": "",
"refId": "A"
}
],
"timeFrom": null,
"timeShift": null,
"title": "JVM Threads Peak",
"type": "stat"
},
{
"datasource": "${DS_PROMETHEUS}",
"description": "Cycles of JVM-threads that are in deadlock waiting to acquire object monitors or ownable synchronizers",
"fieldConfig": {
"defaults": {
"custom": {},
"mappings": [
{
"from": "-999999999999999",
"id": 1,
"text": "N/A",
"to": "0",
"type": 2,
"value": "<0"
}
],
"thresholds": {
"mode": "absolute",
"steps": [
{
"color": "green",
"value": null
}
]
}
},
"overrides": []
},
"gridPos": {
"h": 4,
"w": 3,
"x": 9,
"y": 37
},
"id": 21,
"options": {
"colorMode": "value",
"graphMode": "area",
"justifyMode": "auto",
"orientation": "auto",
"reduceOptions": {
"calcs": [
"mean"
],
"fields": "",
"values": false
},
"textMode": "auto"
},
"pluginVersion": "7.3.6",
"targets": [
{
"expr": "jvm_threads_deadlocked{instance=\"$node\",job=\"$job\"}",
"format": "table",
"instant": true,
"interval": "",
"legendFormat": "",
"refId": "A"
}
],
"timeFrom": null,
"timeShift": null,
"title": "JVM Threads Deadlocked",
"type": "stat"
},
{
"aliasColors": {},
"bars": false,
"dashLength": 10,
"dashes": false,
"datasource": "${DS_PROMETHEUS}",
"description": "Current count of threads by state",
"fieldConfig": {
"defaults": {
"custom": {}
},
"overrides": []
},
"fill": 1,
"fillGradient": 0,
"gridPos": {
"h": 8,
"w": 12,
"x": 0,
"y": 41
},
"hiddenSeries": false,
"id": 2,
"legend": {
"avg": false,
"current": false,
"max": false,
"min": false,
"show": true,
"total": false,
"values": false
},
"lines": true,
"linewidth": 1,
"nullPointMode": "null",
"options": {
"alertThreshold": true
},
"percentage": false,
"pluginVersion": "7.3.6",
"pointradius": 2,
"points": false,
"renderer": "flot",
"seriesOverrides": [],
"spaceLength": 10,
"stack": false,
"steppedLine": false,
"targets": [
{
"expr": "jvm_threads_state{instance=\"$node\",job=\"$job\"}",
"interval": "",
"intervalFactor": 1,
"legendFormat": "{{state}}",
"refId": "A"
}
],
"thresholds": [],
"timeFrom": null,
"timeRegions": [],
"timeShift": null,
"title": "Thread State",
"tooltip": {
"shared": true,
"sort": 0,
"value_type": "individual"
},
"type": "graph",
"xaxis": {
"buckets": null,
"mode": "time",
"name": null,
"show": true,
"values": []
},
"yaxes": [
{
"format": "short",
"label": null,
"logBase": 1,
"max": null,
"min": null,
"show": true
},
{
"format": "short",
"label": null,
"logBase": 1,
"max": null,
"min": null,
"show": true
}
],
"yaxis": {
"align": false,
"alignLevel": null
}
}
],
"title": "Threads",
"type": "row"
},
{
"collapsed": true,
"datasource": "${DS_PROMETHEUS}",
"gridPos": {
"h": 1,
"w": 24,
"x": 0,
"y": 37
},
"id": 7,
"panels": [
{
"datasource": "${DS_PROMETHEUS}",
"description": "Max (bytes) of a given JVM memory area.",
"fieldConfig": {
"defaults": {
"custom": {},
"mappings": [
{
"from": "-99999999999999",
"id": 1,
"text": "N/A",
"to": "0",
"type": 2
}
],
"thresholds": {
"mode": "absolute",
"steps": [
{
"color": "green",
"value": null
}
]
}
},
"overrides": []
},
"gridPos": {
"h": 4,
"w": 3,
"x": 0,
"y": 38
},
"id": 10,
"options": {
"colorMode": "value",
"graphMode": "area",
"justifyMode": "auto",
"orientation": "auto",
"reduceOptions": {
"calcs": [
"mean"
],
"fields": "",
"values": false
},
"textMode": "auto"
},
"pluginVersion": "7.3.6",
"targets": [
{
"expr": "jvm_memory_bytes_max{instance=\"$node\",job=\"$job\",area=\"heap\"} /1024/1024",
"format": "table",
"instant": true,
"interval": "",
"legendFormat": "",
"refId": "A"
}
],
"timeFrom": null,
"timeShift": null,
"title": "Heap Max (MB)",
"type": "stat"
},
{
"datasource": "${DS_PROMETHEUS}",
"description": "Max (bytes) of a given JVM memory area.",
"fieldConfig": {
"defaults": {
"custom": {},
"mappings": [
{
"from": "-999999999999999",
"id": 1,
"text": "N/A",
"to": "0",
"type": 2,
"value": "<0"
}
],
"thresholds": {
"mode": "absolute",
"steps": [
{
"color": "green",
"value": null
}
]
}
},
"overrides": []
},
"gridPos": {
"h": 4,
"w": 3,
"x": 3,
"y": 38
},
"id": 11,
"options": {
"colorMode": "value",
"graphMode": "area",
"justifyMode": "auto",
"orientation": "auto",
"reduceOptions": {
"calcs": [
"mean"
],
"fields": "",
"values": false
},
"textMode": "auto"
},
"pluginVersion": "7.3.6",
"targets": [
{
"expr": "jvm_memory_bytes_max{instance=\"$node\",job=\"$job\",area=\"nonheap\"} /1024/1024",
"format": "table",
"instant": true,
"interval": "",
"legendFormat": "",
"refId": "A"
}
],
"timeFrom": null,
"timeShift": null,
"title": "NonHeap Max (MB)",
"type": "stat"
},
{
"datasource": "${DS_PROMETHEUS}",
"fieldConfig": {
"defaults": {
"custom": {}
},
"overrides": []
},
"gridPos": {
"h": 1,
"w": 20,
"x": 0,
"y": 42
},
"id": 13,
"options": {
"content": "",
"mode": "markdown"
},
"pluginVersion": "7.3.6",
"timeFrom": null,
"timeShift": null,
"title": "Total JVM Memory",
"type": "text"
},
{
"aliasColors": {},
"bars": false,
"dashLength": 10,
"dashes": false,
"datasource": "${DS_PROMETHEUS}",
"description": "Committed (bytes) of a given JVM memory area.",
"fieldConfig": {
"defaults": {
"custom": {}
},
"overrides": []
},
"fill": 1,
"fillGradient": 0,
"gridPos": {
"h": 8,
"w": 10,
"x": 0,
"y": 43
},
"hiddenSeries": false,
"id": 8,
"legend": {
"avg": false,
"current": false,
"max": false,
"min": false,
"show": true,
"total": false,
"values": false
},
"lines": true,
"linewidth": 1,
"nullPointMode": "null",
"options": {
"alertThreshold": true
},
"percentage": false,
"pluginVersion": "7.3.6",
"pointradius": 2,
"points": false,
"renderer": "flot",
"seriesOverrides": [],
"spaceLength": 10,
"stack": false,
"steppedLine": false,
"targets": [
{
"expr": "jvm_memory_bytes_committed{instance=\"$node\",job=\"$job\"} /1024/1024",
"interval": "",
"intervalFactor": 1,
"legendFormat": "{{area}}",
"refId": "A"
}
],
"thresholds": [],
"timeFrom": null,
"timeRegions": [],
"timeShift": null,
"title": "JVM Total Memory Committed (MB)",
"tooltip": {
"shared": true,
"sort": 0,
"value_type": "individual"
},
"type": "graph",
"xaxis": {
"buckets": null,
"mode": "time",
"name": null,
"show": true,
"values": []
},
"yaxes": [
{
"format": "short",
"label": null,
"logBase": 1,
"max": null,
"min": null,
"show": true
},
{
"format": "short",
"label": null,
"logBase": 1,
"max": null,
"min": null,
"show": true
}
],
"yaxis": {
"align": false,
"alignLevel": null
}
},
{
"aliasColors": {},
"bars": false,
"dashLength": 10,
"dashes": false,
"datasource": "${DS_PROMETHEUS}",
"description": "Used bytes of a given JVM memory area.",
"fieldConfig": {
"defaults": {
"custom": {}
},
"overrides": []
},
"fill": 1,
"fillGradient": 0,
"gridPos": {
"h": 8,
"w": 10,
"x": 10,
"y": 43
},
"hiddenSeries": false,
"id": 3,
"legend": {
"avg": false,
"current": false,
"max": false,
"min": false,
"show": true,
"total": false,
"values": false
},
"lines": true,
"linewidth": 1,
"nullPointMode": "null",
"options": {
"alertThreshold": true
},
"percentage": false,
"pluginVersion": "7.3.6",
"pointradius": 2,
"points": false,
"renderer": "flot",
"seriesOverrides": [],
"spaceLength": 10,
"stack": false,
"steppedLine": false,
"targets": [
{
"expr": "jvm_memory_bytes_used{instance=\"$node\",job=\"$job\"} /1024/1024",
"interval": "",
"intervalFactor": 1,
"legendFormat": "{{area}}",
"refId": "A"
}
],
"thresholds": [],
"timeFrom": null,
"timeRegions": [],
"timeShift": null,
"title": "JVM Total Memory Used (MB)",
"tooltip": {
"shared": true,
"sort": 0,
"value_type": "individual"
},
"type": "graph",
"xaxis": {
"buckets": null,
"mode": "time",
"name": null,
"show": true,
"values": []
},
"yaxes": [
{
"format": "short",
"label": null,
"logBase": 1,
"max": null,
"min": null,
"show": true
},
{
"format": "short",
"label": null,
"logBase": 1,
"max": null,
"min": null,
"show": true
}
],
"yaxis": {
"align": false,
"alignLevel": null
}
},
{
"datasource": "${DS_PROMETHEUS}",
"fieldConfig": {
"defaults": {
"custom": {}
},
"overrides": []
},
"gridPos": {
"h": 1,
"w": 20,
"x": 0,
"y": 51
},
"id": 14,
"options": {
"content": "",
"mode": "markdown"
},
"pluginVersion": "7.3.6",
"timeFrom": null,
"timeShift": null,
"title": "JVM Memory Pool",
"type": "text"
},
{
"aliasColors": {},
"bars": false,
"dashLength": 10,
"dashes": false,
"datasource": "${DS_PROMETHEUS}",
"description": "Committed bytes of a given JVM memory pool.",
"fieldConfig": {
"defaults": {
"custom": {}
},
"overrides": []
},
"fill": 1,
"fillGradient": 0,
"gridPos": {
"h": 8,
"w": 10,
"x": 0,
"y": 52
},
"hiddenSeries": false,
"id": 15,
"legend": {
"avg": false,
"current": false,
"max": false,
"min": false,
"show": true,
"total": false,
"values": false
},
"lines": true,
"linewidth": 1,
"nullPointMode": "null",
"options": {
"alertThreshold": true
},
"percentage": false,
"pluginVersion": "7.3.6",
"pointradius": 2,
"points": false,
"renderer": "flot",
"seriesOverrides": [],
"spaceLength": 10,
"stack": false,
"steppedLine": false,
"targets": [
{
"expr": "jvm_memory_pool_bytes_committed{instance=\"$node\",job=\"$job\"} /1024/1024",
"interval": "",
"intervalFactor": 1,
"legendFormat": "{{pool}}",
"refId": "A"
}
],
"thresholds": [],
"timeFrom": null,
"timeRegions": [],
"timeShift": null,
"title": "JVM Memory Pool Committed (MB)",
"tooltip": {
"shared": true,
"sort": 0,
"value_type": "individual"
},
"type": "graph",
"xaxis": {
"buckets": null,
"mode": "time",
"name": null,
"show": true,
"values": []
},
"yaxes": [
{
"format": "short",
"label": null,
"logBase": 1,
"max": null,
"min": null,
"show": true
},
{
"format": "short",
"label": null,
"logBase": 1,
"max": null,
"min": null,
"show": true
}
],
"yaxis": {
"align": false,
"alignLevel": null
}
},
{
"aliasColors": {},
"bars": false,
"dashLength": 10,
"dashes": false,
"datasource": "${DS_PROMETHEUS}",
"description": "Used bytes of a given JVM memory pool.",
"fieldConfig": {
"defaults": {
"custom": {}
},
"overrides": []
},
"fill": 1,
"fillGradient": 0,
"gridPos": {
"h": 8,
"w": 10,
"x": 10,
"y": 52
},
"hiddenSeries": false,
"id": 16,
"legend": {
"avg": false,
"current": false,
"max": false,
"min": false,
"show": true,
"total": false,
"values": false
},
"lines": true,
"linewidth": 1,
"nullPointMode": "null",
"options": {
"alertThreshold": true
},
"percentage": false,
"pluginVersion": "7.3.6",
"pointradius": 2,
"points": false,
"renderer": "flot",
"seriesOverrides": [],
"spaceLength": 10,
"stack": false,
"steppedLine": false,
"targets": [
{
"expr": "jvm_memory_pool_bytes_used{instance=\"$node\",job=\"$job\"} /1024/1024",
"interval": "",
"intervalFactor": 1,
"legendFormat": "{{pool}}",
"refId": "A"
}
],
"thresholds": [],
"timeFrom": null,
"timeRegions": [],
"timeShift": null,
"title": "JVM Memory Pool Used (MB)",
"tooltip": {
"shared": true,
"sort": 0,
"value_type": "individual"
},
"type": "graph",
"xaxis": {
"buckets": null,
"mode": "time",
"name": null,
"show": true,
"values": []
},
"yaxes": [
{
"format": "short",
"label": null,
"logBase": 1,
"max": null,
"min": null,
"show": true
},
{
"format": "short",
"label": null,
"logBase": 1,
"max": null,
"min": null,
"show": true
}
],
"yaxis": {
"align": false,
"alignLevel": null
}
},
{
"aliasColors": {},
"bars": false,
"dashLength": 10,
"dashes": false,
"datasource": "${DS_PROMETHEUS}",
"description": "Max bytes of a given JVM memory pool.\n",
"fieldConfig": {
"defaults": {
"custom": {}
},
"overrides": []
},
"fill": 1,
"fillGradient": 0,
"gridPos": {
"h": 8,
"w": 10,
"x": 0,
"y": 60
},
"hiddenSeries": false,
"id": 17,
"legend": {
"avg": false,
"current": false,
"max": false,
"min": false,
"show": true,
"total": false,
"values": false
},
"lines": true,
"linewidth": 1,
"nullPointMode": "null",
"options": {
"alertThreshold": true
},
"percentage": false,
"pluginVersion": "7.3.6",
"pointradius": 2,
"points": false,
"renderer": "flot",
"seriesOverrides": [],
"spaceLength": 10,
"stack": false,
"steppedLine": false,
"targets": [
{
"expr": "jvm_memory_pool_bytes_max{instance=\"$node\",job=\"$job\"} /1024/1024",
"interval": "",
"intervalFactor": 1,
"legendFormat": "{{pool}}",
"refId": "A"
}
],
"thresholds": [],
"timeFrom": null,
"timeRegions": [],
"timeShift": null,
"title": "JVM Memory Pool Max (MB)",
"tooltip": {
"shared": true,
"sort": 0,
"value_type": "individual"
},
"type": "graph",
"xaxis": {
"buckets": null,
"mode": "time",
"name": null,
"show": true,
"values": []
},
"yaxes": [
{
"format": "short",
"label": null,
"logBase": 1,
"max": null,
"min": null,
"show": true
},
{
"format": "short",
"label": null,
"logBase": 1,
"max": null,
"min": null,
"show": true
}
],
"yaxis": {
"align": false,
"alignLevel": null
}
}
],
"title": "JVM Memory",
"type": "row"
},
{
"collapsed": false,
"datasource": "${DS_PROMETHEUS}",
"gridPos": {
"h": 1,
"w": 24,
"x": 0,
"y": 38
},
"id": 54,
"panels": [],
"title": "Servlet Responses (if enabled)",
"type": "row"
},
{
"aliasColors": {},
"bars": false,
"dashLength": 10,
"dashes": false,
"datasource": "${DS_PROMETHEUS}",
"description": "Number of requests for given context and status code",
"fieldConfig": {
"defaults": {
"custom": {}
},
"overrides": []
},
"fill": 1,
"fillGradient": 0,
"gridPos": {
"h": 8,
"w": 12,
"x": 0,
"y": 39
},
"hiddenSeries": false,
"id": 56,
"legend": {
"avg": false,
"current": false,
"max": false,
"min": false,
"show": true,
"total": false,
"values": false
},
"lines": true,
"linewidth": 1,
"nullPointMode": "null",
"options": {
"alertThreshold": true
},
"percentage": false,
"pluginVersion": "7.3.6",
"pointradius": 2,
"points": false,
"renderer": "flot",
"seriesOverrides": [],
"spaceLength": 10,
"stack": false,
"steppedLine": false,
"targets": [
{
"expr": "rate(servlet_response_status_total{instance=\"$node\",job=\"$job\"}[5m])",
"interval": "",
"legendFormat": "{{context}} HTTP {{status}}",
"refId": "A"
}
],
"thresholds": [],
"timeFrom": null,
"timeRegions": [],
"timeShift": null,
"title": "Servlet Response Status /s over 5 min",
"tooltip": {
"shared": true,
"sort": 0,
"value_type": "individual"
},
"type": "graph",
"xaxis": {
"buckets": null,
"mode": "time",
"name": null,
"show": true,
"values": []
},
"yaxes": [
{
"format": "short",
"label": null,
"logBase": 1,
"max": null,
"min": null,
"show": true
},
{
"format": "short",
"label": null,
"logBase": 1,
"max": null,
"min": null,
"show": true
}
],
"yaxis": {
"align": false,
"alignLevel": null
}
},
{
"collapsed": true,
"datasource": "${DS_PROMETHEUS}",
"gridPos": {
"h": 1,
"w": 24,
"x": 0,
"y": 47
},
"id": 27,
"panels": [
{
"aliasColors": {},
"bars": false,
"dashLength": 10,
"dashes": false,
"datasource": "${DS_PROMETHEUS}",
"description": "Number of sessions created",
"fieldConfig": {
"defaults": {
"custom": {}
},
"overrides": []
},
"fill": 1,
"fillGradient": 0,
"gridPos": {
"h": 8,
"w": 10,
"x": 0,
"y": 40
},
"hiddenSeries": false,
"id": 28,
"legend": {
"avg": false,
"current": false,
"max": false,
"min": false,
"show": true,
"total": false,
"values": false
},
"lines": true,
"linewidth": 1,
"nullPointMode": "null",
"options": {
"alertThreshold": true
},
"percentage": false,
"pluginVersion": "7.3.6",
"pointradius": 2,
"points": false,
"renderer": "flot",
"seriesOverrides": [],
"spaceLength": 10,
"stack": false,
"steppedLine": false,
"targets": [
{
"expr": "rate(tomcat_session_created_total{instance=\"$node\",job=\"$job\"}[1m])*100",
"interval": "",
"intervalFactor": 1,
"legendFormat": "{{context}}",
"refId": "A"
}
],
"thresholds": [],
"timeFrom": null,
"timeRegions": [],
"timeShift": null,
"title": "Sessions Created Total /sec over 1 min",
"tooltip": {
"shared": true,
"sort": 0,
"value_type": "individual"
},
"type": "graph",
"xaxis": {
"buckets": null,
"mode": "time",
"name": null,
"show": true,
"values": []
},
"yaxes": [
{
"format": "short",
"label": null,
"logBase": 1,
"max": null,
"min": null,
"show": true
},
{
"format": "short",
"label": null,
"logBase": 1,
"max": null,
"min": null,
"show": true
}
],
"yaxis": {
"align": false,
"alignLevel": null
}
},
{
"aliasColors": {},
"bars": false,
"dashLength": 10,
"dashes": false,
"datasource": "${DS_PROMETHEUS}",
"description": "Number of active sessions",
"fieldConfig": {
"defaults": {
"custom": {}
},
"overrides": []
},
"fill": 1,
"fillGradient": 0,
"gridPos": {
"h": 8,
"w": 10,
"x": 10,
"y": 40
},
"hiddenSeries": false,
"id": 31,
"legend": {
"avg": false,
"current": false,
"max": false,
"min": false,
"show": true,
"total": false,
"values": false
},
"lines": true,
"linewidth": 1,
"nullPointMode": "null",
"options": {
"alertThreshold": true
},
"percentage": false,
"pluginVersion": "7.3.6",
"pointradius": 2,
"points": false,
"renderer": "flot",
"seriesOverrides": [],
"spaceLength": 10,
"stack": false,
"steppedLine": false,
"targets": [
{
"expr": "rate(tomcat_session_active_total{instance=\"$node\",job=\"$job\"}[1m])*100",
"interval": "",
"intervalFactor": 1,
"legendFormat": "{{context}}",
"refId": "A"
}
],
"thresholds": [],
"timeFrom": null,
"timeRegions": [],
"timeShift": null,
"title": "Sessions Active Total /sec over 1 min",
"tooltip": {
"shared": true,
"sort": 0,
"value_type": "individual"
},
"type": "graph",
"xaxis": {
"buckets": null,
"mode": "time",
"name": null,
"show": true,
"values": []
},
"yaxes": [
{
"format": "short",
"label": null,
"logBase": 1,
"max": null,
"min": null,
"show": true
},
{
"format": "short",
"label": null,
"logBase": 1,
"max": null,
"min": null,
"show": true
}
],
"yaxis": {
"align": false,
"alignLevel": null
}
},
{
"aliasColors": {},
"bars": false,
"dashLength": 10,
"dashes": false,
"datasource": "${DS_PROMETHEUS}",
"description": "Number of sessions rejected due to maxActive being reached",
"fieldConfig": {
"defaults": {
"custom": {}
},
"overrides": []
},
"fill": 1,
"fillGradient": 0,
"gridPos": {
"h": 8,
"w": 10,
"x": 0,
"y": 48
},
"hiddenSeries": false,
"id": 30,
"legend": {
"avg": false,
"current": false,
"max": false,
"min": false,
"show": true,
"total": false,
"values": false
},
"lines": true,
"linewidth": 1,
"nullPointMode": "null",
"options": {
"alertThreshold": true
},
"percentage": false,
"pluginVersion": "7.3.6",
"pointradius": 2,
"points": false,
"renderer": "flot",
"seriesOverrides": [],
"spaceLength": 10,
"stack": false,
"steppedLine": false,
"targets": [
{
"expr": "rate(tomcat_session_rejected_total{instance=\"$node\",job=\"$job\"}[1m]) *100",
"interval": "",
"intervalFactor": 1,
"legendFormat": "{{context}}",
"refId": "A"
}
],
"thresholds": [],
"timeFrom": null,
"timeRegions": [],
"timeShift": null,
"title": "Sessions Rejected Total /sec over 1 min",
"tooltip": {
"shared": true,
"sort": 0,
"value_type": "individual"
},
"type": "graph",
"xaxis": {
"buckets": null,
"mode": "time",
"name": null,
"show": true,
"values": []
},
"yaxes": [
{
"format": "short",
"label": null,
"logBase": 1,
"max": null,
"min": null,
"show": true
},
{
"format": "short",
"label": null,
"logBase": 1,
"max": null,
"min": null,
"show": true
}
],
"yaxis": {
"align": false,
"alignLevel": null
}
},
{
"aliasColors": {},
"bars": false,
"dashLength": 10,
"dashes": false,
"datasource": "${DS_PROMETHEUS}",
"description": "Number of sessions that expired",
"fieldConfig": {
"defaults": {
"custom": {}
},
"overrides": []
},
"fill": 1,
"fillGradient": 0,
"gridPos": {
"h": 8,
"w": 10,
"x": 10,
"y": 48
},
"hiddenSeries": false,
"id": 29,
"legend": {
"avg": false,
"current": false,
"max": false,
"min": false,
"show": true,
"total": false,
"values": false
},
"lines": true,
"linewidth": 1,
"nullPointMode": "null",
"options": {
"alertThreshold": true
},
"percentage": false,
"pluginVersion": "7.3.6",
"pointradius": 2,
"points": false,
"renderer": "flot",
"seriesOverrides": [],
"spaceLength": 10,
"stack": false,
"steppedLine": false,
"targets": [
{
"expr": "rate(tomcat_session_expired_total{instance=\"$node\",job=\"$job\"}[1m])*100",
"interval": "",
"intervalFactor": 1,
"legendFormat": "{{context}}",
"refId": "A"
}
],
"thresholds": [],
"timeFrom": null,
"timeRegions": [],
"timeShift": null,
"title": "Sessions Expired Total /sec over 1 min",
"tooltip": {
"shared": true,
"sort": 0,
"value_type": "individual"
},
"type": "graph",
"xaxis": {
"buckets": null,
"mode": "time",
"name": null,
"show": true,
"values": []
},
"yaxes": [
{
"format": "short",
"label": null,
"logBase": 1,
"max": null,
"min": null,
"show": true
},
{
"format": "short",
"label": null,
"logBase": 1,
"max": null,
"min": null,
"show": true
}
],
"yaxis": {
"align": false,
"alignLevel": null
}
},
{
"aliasColors": {},
"bars": false,
"dashLength": 10,
"dashes": false,
"datasource": "${DS_PROMETHEUS}",
"description": "Maximum time an expired session had been alive",
"fieldConfig": {
"defaults": {
"custom": {}
},
"overrides": []
},
"fill": 1,
"fillGradient": 0,
"gridPos": {
"h": 8,
"w": 10,
"x": 0,
"y": 56
},
"hiddenSeries": false,
"id": 32,
"legend": {
"avg": false,
"current": false,
"max": false,
"min": false,
"show": true,
"total": false,
"values": false
},
"lines": true,
"linewidth": 1,
"nullPointMode": "null",
"options": {
"alertThreshold": true
},
"percentage": false,
"pluginVersion": "7.3.6",
"pointradius": 2,
"points": false,
"renderer": "flot",
"seriesOverrides": [],
"spaceLength": 10,
"stack": false,
"steppedLine": false,
"targets": [
{
"expr": "rate(tomcat_session_alivetime_seconds_max{instance=\"$node\",job=\"$job\"}[5m])",
"interval": "",
"intervalFactor": 1,
"legendFormat": "{{context}}",
"refId": "A"
}
],
"thresholds": [],
"timeFrom": null,
"timeRegions": [],
"timeShift": null,
"title": "Sessions Alive Time Max over 5 min (in seconds)",
"tooltip": {
"shared": true,
"sort": 0,
"value_type": "individual"
},
"type": "graph",
"xaxis": {
"buckets": null,
"mode": "time",
"name": null,
"show": true,
"values": []
},
"yaxes": [
{
"format": "short",
"label": null,
"logBase": 1,
"max": null,
"min": null,
"show": true
},
{
"format": "short",
"label": null,
"logBase": 1,
"max": null,
"min": null,
"show": true
}
],
"yaxis": {
"align": false,
"alignLevel": null
}
},
{
"aliasColors": {},
"bars": false,
"dashLength": 10,
"dashes": false,
"datasource": "${DS_PROMETHEUS}",
"description": "Average time an expired session had been alive",
"fieldConfig": {
"defaults": {
"custom": {}
},
"overrides": []
},
"fill": 1,
"fillGradient": 0,
"gridPos": {
"h": 8,
"w": 10,
"x": 10,
"y": 56
},
"hiddenSeries": false,
"id": 33,
"legend": {
"avg": false,
"current": false,
"max": false,
"min": false,
"show": true,
"total": false,
"values": false
},
"lines": true,
"linewidth": 1,
"nullPointMode": "null",
"options": {
"alertThreshold": true
},
"percentage": false,
"pluginVersion": "7.3.6",
"pointradius": 2,
"points": false,
"renderer": "flot",
"seriesOverrides": [],
"spaceLength": 10,
"stack": false,
"steppedLine": false,
"targets": [
{
"expr": "rate(tomcat_session_alivetime_seconds_avg{instance=\"$node\",job=\"$job\"}[5m])",
"interval": "",
"intervalFactor": 1,
"legendFormat": "{{context}}",
"refId": "A"
}
],
"thresholds": [],
"timeFrom": null,
"timeRegions": [],
"timeShift": null,
"title": "Sessions Alive Time Avg /sec over 5 min",
"tooltip": {
"shared": true,
"sort": 0,
"value_type": "individual"
},
"type": "graph",
"xaxis": {
"buckets": null,
"mode": "time",
"name": null,
"show": true,
"values": []
},
"yaxes": [
{
"format": "short",
"label": null,
"logBase": 1,
"max": null,
"min": null,
"show": true
},
{
"format": "short",
"label": null,
"logBase": 1,
"max": null,
"min": null,
"show": true
}
],
"yaxis": {
"align": false,
"alignLevel": null
}
}
],
"title": "Tomcat Sessions",
"type": "row"
},
{
"collapsed": true,
"datasource": "${DS_PROMETHEUS}",
"gridPos": {
"h": 1,
"w": 24,
"x": 0,
"y": 48
},
"id": 36,
"panels": [
{
"aliasColors": {},
"bars": false,
"dashLength": 10,
"dashes": false,
"datasource": "${DS_PROMETHEUS}",
"description": "Maximum number of concurrent connections served by this pool.",
"fieldConfig": {
"defaults": {
"custom": {}
},
"overrides": []
},
"fill": 1,
"fillGradient": 0,
"gridPos": {
"h": 8,
"w": 10,
"x": 0,
"y": 41
},
"hiddenSeries": false,
"id": 37,
"legend": {
"avg": false,
"current": false,
"max": false,
"min": false,
"show": true,
"total": false,
"values": false
},
"lines": true,
"linewidth": 1,
"nullPointMode": "null",
"options": {
"alertThreshold": true
},
"percentage": false,
"pluginVersion": "7.3.6",
"pointradius": 2,
"points": false,
"renderer": "flot",
"seriesOverrides": [],
"spaceLength": 10,
"stack": false,
"steppedLine": false,
"targets": [
{
"expr": "tomcat_connections_active_max{instance=\"$node\",job=\"$job\"}",
"interval": "",
"intervalFactor": 1,
"legendFormat": "{{name}}",
"refId": "A"
}
],
"thresholds": [],
"timeFrom": null,
"timeRegions": [],
"timeShift": null,
"title": "Tomcat Connections Active Max",
"tooltip": {
"shared": true,
"sort": 0,
"value_type": "individual"
},
"type": "graph",
"xaxis": {
"buckets": null,
"mode": "time",
"name": null,
"show": true,
"values": []
},
"yaxes": [
{
"format": "short",
"label": null,
"logBase": 1,
"max": null,
"min": null,
"show": true
},
{
"format": "short",
"label": null,
"logBase": 1,
"max": null,
"min": null,
"show": true
}
],
"yaxis": {
"align": false,
"alignLevel": null
}
},
{
"aliasColors": {},
"bars": false,
"dashLength": 10,
"dashes": false,
"datasource": "${DS_PROMETHEUS}",
"description": "Number of connections served by this pool.",
"fieldConfig": {
"defaults": {
"custom": {}
},
"overrides": []
},
"fill": 1,
"fillGradient": 0,
"gridPos": {
"h": 8,
"w": 10,
"x": 10,
"y": 41
},
"hiddenSeries": false,
"id": 38,
"legend": {
"avg": false,
"current": false,
"max": false,
"min": false,
"show": true,
"total": false,
"values": false
},
"lines": true,
"linewidth": 1,
"nullPointMode": "null",
"options": {
"alertThreshold": true
},
"percentage": false,
"pluginVersion": "7.3.6",
"pointradius": 2,
"points": false,
"renderer": "flot",
"seriesOverrides": [],
"spaceLength": 10,
"stack": false,
"steppedLine": false,
"targets": [
{
"expr": "tomcat_connections_active_total{instance=\"$node\",job=\"$job\"}",
"interval": "",
"intervalFactor": 1,
"legendFormat": "{{name}}",
"refId": "A"
}
],
"thresholds": [],
"timeFrom": null,
"timeRegions": [],
"timeShift": null,
"title": "Tomcat Connections Active Total",
"tooltip": {
"shared": true,
"sort": 0,
"value_type": "individual"
},
"type": "graph",
"xaxis": {
"buckets": null,
"mode": "time",
"name": null,
"show": true,
"values": []
},
"yaxes": [
{
"format": "short",
"label": null,
"logBase": 1,
"max": null,
"min": null,
"show": true
},
{
"format": "short",
"label": null,
"logBase": 1,
"max": null,
"min": null,
"show": true
}
],
"yaxis": {
"align": false,
"alignLevel": null
}
}
],
"title": "Tomcat Connections",
"type": "row"
},
{
"collapsed": true,
"datasource": "${DS_PROMETHEUS}",
"gridPos": {
"h": 1,
"w": 24,
"x": 0,
"y": 49
},
"id": 40,
"panels": [
{
"aliasColors": {},
"bars": false,
"dashLength": 10,
"dashes": false,
"datasource": "${DS_PROMETHEUS}",
"description": "The number of request served by this request processor",
"fieldConfig": {
"defaults": {
"custom": {}
},
"overrides": []
},
"fill": 1,
"fillGradient": 0,
"gridPos": {
"h": 8,
"w": 10,
"x": 0,
"y": 42
},
"hiddenSeries": false,
"id": 41,
"legend": {
"avg": false,
"current": false,
"max": false,
"min": false,
"show": true,
"total": false,
"values": false
},
"lines": true,
"linewidth": 1,
"nullPointMode": "null",
"options": {
"alertThreshold": true
},
"percentage": false,
"pluginVersion": "7.3.6",
"pointradius": 2,
"points": false,
"renderer": "flot",
"seriesOverrides": [],
"spaceLength": 10,
"stack": false,
"steppedLine": false,
"targets": [
{
"expr": "rate(tomcat_requestprocessor_request_count{instance=\"$node\",job=\"$job\"}[5m])",
"format": "time_series",
"interval": "",
"intervalFactor": 1,
"legendFormat": "{{name}}",
"refId": "A"
}
],
"thresholds": [],
"timeFrom": null,
"timeRegions": [],
"timeShift": null,
"title": "Requests /sec per 5 minutes",
"tooltip": {
"shared": true,
"sort": 0,
"value_type": "individual"
},
"type": "graph",
"xaxis": {
"buckets": null,
"mode": "time",
"name": null,
"show": true,
"values": []
},
"yaxes": [
{
"format": "short",
"label": null,
"logBase": 1,
"max": null,
"min": null,
"show": true
},
{
"format": "short",
"label": null,
"logBase": 1,
"max": null,
"min": null,
"show": true
}
],
"yaxis": {
"align": false,
"alignLevel": null
}
},
{
"aliasColors": {},
"bars": false,
"dashLength": 10,
"dashes": false,
"datasource": "${DS_PROMETHEUS}",
"description": "The number of error request served by this request processor",
"fieldConfig": {
"defaults": {
"custom": {}
},
"overrides": []
},
"fill": 1,
"fillGradient": 0,
"gridPos": {
"h": 8,
"w": 10,
"x": 10,
"y": 42
},
"hiddenSeries": false,
"id": 42,
"legend": {
"avg": false,
"current": false,
"max": false,
"min": false,
"show": true,
"total": false,
"values": false
},
"lines": true,
"linewidth": 1,
"nullPointMode": "null",
"options": {
"alertThreshold": true
},
"percentage": false,
"pluginVersion": "7.3.6",
"pointradius": 2,
"points": false,
"renderer": "flot",
"seriesOverrides": [],
"spaceLength": 10,
"stack": false,
"steppedLine": false,
"targets": [
{
"expr": "rate(tomcat_requestprocessor_error_count{instance=\"$node\",job=\"$job\"}[5m])",
"interval": "",
"intervalFactor": 1,
"legendFormat": "{{name}}",
"refId": "A"
}
],
"thresholds": [],
"timeFrom": null,
"timeRegions": [],
"timeShift": null,
"title": "Request Errors /sec per 5 minutes",
"tooltip": {
"shared": true,
"sort": 0,
"value_type": "individual"
},
"type": "graph",
"xaxis": {
"buckets": null,
"mode": "time",
"name": null,
"show": true,
"values": []
},
"yaxes": [
{
"format": "short",
"label": null,
"logBase": 1,
"max": null,
"min": null,
"show": true
},
{
"format": "short",
"label": null,
"logBase": 1,
"max": null,
"min": null,
"show": true
}
],
"yaxis": {
"align": false,
"alignLevel": null
}
},
{
"aliasColors": {},
"bars": false,
"dashLength": 10,
"dashes": false,
"datasource": "${DS_PROMETHEUS}",
"description": "Rate of errors compared to total requests for the request processor",
"fieldConfig": {
"defaults": {
"custom": {}
},
"overrides": []
},
"fill": 1,
"fillGradient": 0,
"gridPos": {
"h": 8,
"w": 10,
"x": 0,
"y": 50
},
"hiddenSeries": false,
"id": 43,
"legend": {
"avg": false,
"current": false,
"max": false,
"min": false,
"show": true,
"total": false,
"values": false
},
"lines": true,
"linewidth": 1,
"nullPointMode": "null",
"options": {
"alertThreshold": true
},
"percentage": false,
"pluginVersion": "7.3.6",
"pointradius": 2,
"points": false,
"renderer": "flot",
"seriesOverrides": [],
"spaceLength": 10,
"stack": false,
"steppedLine": false,
"targets": [
{
"expr": "sum(rate(tomcat_requestprocessor_error_count{instance=\"$node\",job=\"$job\"}[1m])) by (instance,name) \n/ sum(rate(tomcat_requestprocessor_request_count{instance=\"$node\",job=\"$job\"}[1m])) by (instance,name) *100",
"interval": "",
"intervalFactor": 1,
"legendFormat": "{{name}}",
"refId": "A"
}
],
"thresholds": [],
"timeFrom": null,
"timeRegions": [],
"timeShift": null,
"title": "Percent Errors/Requests",
"tooltip": {
"shared": true,
"sort": 0,
"value_type": "individual"
},
"type": "graph",
"xaxis": {
"buckets": null,
"mode": "time",
"name": null,
"show": true,
"values": []
},
"yaxes": [
{
"format": "short",
"label": null,
"logBase": 1,
"max": null,
"min": null,
"show": true
},
{
"format": "short",
"label": null,
"logBase": 1,
"max": null,
"min": null,
"show": true
}
],
"yaxis": {
"align": false,
"alignLevel": null
}
},
{
"aliasColors": {},
"bars": false,
"dashLength": 10,
"dashes": false,
"datasource": "${DS_PROMETHEUS}",
"description": "Number of bytes received by this request processor",
"fieldConfig": {
"defaults": {
"custom": {}
},
"overrides": []
},
"fill": 1,
"fillGradient": 0,
"gridPos": {
"h": 8,
"w": 10,
"x": 10,
"y": 50
},
"hiddenSeries": false,
"id": 44,
"legend": {
"avg": false,
"current": false,
"max": false,
"min": false,
"show": true,
"total": false,
"values": false
},
"lines": true,
"linewidth": 1,
"nullPointMode": "null",
"options": {
"alertThreshold": true
},
"percentage": false,
"pluginVersion": "7.3.6",
"pointradius": 2,
"points": false,
"renderer": "flot",
"seriesOverrides": [],
"spaceLength": 10,
"stack": false,
"steppedLine": false,
"targets": [
{
"expr": "rate(tomcat_requestprocessor_received_bytes{instance=\"$node\",job=\"$job\"}[5m]) /1024/1024",
"interval": "",
"intervalFactor": 1,
"legendFormat": "{{name}}",
"refId": "A"
}
],
"thresholds": [],
"timeFrom": null,
"timeRegions": [],
"timeShift": null,
"title": "Request Received Bytes (MB) /sec over 5 min",
"tooltip": {
"shared": true,
"sort": 0,
"value_type": "individual"
},
"type": "graph",
"xaxis": {
"buckets": null,
"mode": "time",
"name": null,
"show": true,
"values": []
},
"yaxes": [
{
"format": "short",
"label": null,
"logBase": 1,
"max": null,
"min": null,
"show": true
},
{
"format": "short",
"label": null,
"logBase": 1,
"max": null,
"min": null,
"show": true
}
],
"yaxis": {
"align": false,
"alignLevel": null
}
},
{
"aliasColors": {},
"bars": false,
"dashLength": 10,
"dashes": false,
"datasource": "${DS_PROMETHEUS}",
"description": "Number of bytes sent by this request processor",
"fieldConfig": {
"defaults": {
"custom": {}
},
"overrides": []
},
"fill": 1,
"fillGradient": 0,
"gridPos": {
"h": 8,
"w": 10,
"x": 0,
"y": 58
},
"hiddenSeries": false,
"id": 45,
"legend": {
"avg": false,
"current": false,
"max": false,
"min": false,
"show": true,
"total": false,
"values": false
},
"lines": true,
"linewidth": 1,
"nullPointMode": "null",
"options": {
"alertThreshold": true
},
"percentage": false,
"pluginVersion": "7.3.6",
"pointradius": 2,
"points": false,
"renderer": "flot",
"seriesOverrides": [],
"spaceLength": 10,
"stack": false,
"steppedLine": false,
"targets": [
{
"expr": "rate(tomcat_requestprocessor_sent_bytes{instance=\"$node\",job=\"$job\"}[5m]) /1024/1024 ",
"interval": "",
"intervalFactor": 1,
"legendFormat": "{{name}}",
"refId": "A"
}
],
"thresholds": [],
"timeFrom": null,
"timeRegions": [],
"timeShift": null,
"title": "Request Sent Bytes (MB) /sec over 5 min",
"tooltip": {
"shared": true,
"sort": 0,
"value_type": "individual"
},
"type": "graph",
"xaxis": {
"buckets": null,
"mode": "time",
"name": null,
"show": true,
"values": []
},
"yaxes": [
{
"format": "short",
"label": null,
"logBase": 1,
"max": null,
"min": null,
"show": true
},
{
"format": "short",
"label": null,
"logBase": 1,
"max": null,
"min": null,
"show": true
}
],
"yaxis": {
"align": false,
"alignLevel": null
}
}
],
"title": "Tomcat Request Processor",
"type": "row"
},
{
"collapsed": false,
"datasource": "${DS_PROMETHEUS}",
"gridPos": {
"h": 1,
"w": 24,
"x": 0,
"y": 50
},
"id": 58,
"panels": [],
"title": "Tomcat JDBC (if enabled)",
"type": "row"
},
{
"datasource": "${DS_PROMETHEUS}",
"description": "Maximum number of active connections that can be allocated from this pool at the same time",
"fieldConfig": {
"defaults": {
"custom": {
"align": null,
"filterable": false
},
"mappings": [],
"thresholds": {
"mode": "absolute",
"steps": [
{
"color": "green",
"value": null
}
]
}
},
"overrides": []
},
"gridPos": {
"h": 3,
"w": 18,
"x": 0,
"y": 51
},
"id": 60,
"options": {
"colorMode": "value",
"graphMode": "none",
"justifyMode": "auto",
"orientation": "auto",
"reduceOptions": {
"calcs": [
"mean"
],
"fields": "",
"values": false
},
"textMode": "auto"
},
"pluginVersion": "7.3.6",
"targets": [
{
"expr": "tomcat_jdbc_connections_max{instance=\"$node\",job=\"$job\"}",
"instant": true,
"interval": "",
"legendFormat": "{{pool}}",
"refId": "A"
}
],
"timeFrom": null,
"timeShift": null,
"title": "JDBC Max Connections",
"type": "stat"
},
{
"aliasColors": {},
"bars": false,
"dashLength": 10,
"dashes": false,
"datasource": "${DS_PROMETHEUS}",
"description": "Total number of connections in this pool",
"fieldConfig": {
"defaults": {
"custom": {
"align": null,
"filterable": false
},
"mappings": [],
"thresholds": {
"mode": "absolute",
"steps": [
{
"color": "green",
"value": null
}
]
}
},
"overrides": []
},
"fill": 1,
"fillGradient": 0,
"gridPos": {
"h": 7,
"w": 9,
"x": 0,
"y": 54
},
"hiddenSeries": false,
"id": 63,
"legend": {
"avg": false,
"current": false,
"max": false,
"min": false,
"show": true,
"total": false,
"values": false
},
"lines": true,
"linewidth": 1,
"nullPointMode": "null",
"options": {
"alertThreshold": true
},
"percentage": false,
"pluginVersion": "7.3.6",
"pointradius": 2,
"points": false,
"renderer": "flot",
"seriesOverrides": [],
"spaceLength": 10,
"stack": false,
"steppedLine": false,
"targets": [
{
"expr": "tomcat_jdbc_connections_total{instance=\"$node\",job=\"$job\"}",
"instant": false,
"interval": "",
"legendFormat": "{{pool}}",
"refId": "A"
}
],
"thresholds": [],
"timeFrom": null,
"timeRegions": [],
"timeShift": null,
"title": "JDBC Total Connections",
"tooltip": {
"shared": true,
"sort": 0,
"value_type": "individual"
},
"type": "graph",
"xaxis": {
"buckets": null,
"mode": "time",
"name": null,
"show": true,
"values": []
},
"yaxes": [
{
"format": "short",
"label": null,
"logBase": 1,
"max": null,
"min": null,
"show": true
},
{
"format": "short",
"label": null,
"logBase": 1,
"max": null,
"min": null,
"show": true
}
],
"yaxis": {
"align": false,
"alignLevel": null
}
},
{
"aliasColors": {},
"bars": false,
"dashLength": 10,
"dashes": false,
"datasource": "${DS_PROMETHEUS}",
"description": "Number of active connections allocated from this pool",
"fieldConfig": {
"defaults": {
"custom": {
"align": null,
"filterable": false
},
"mappings": [],
"thresholds": {
"mode": "absolute",
"steps": [
{
"color": "green",
"value": null
}
]
}
},
"overrides": []
},
"fill": 1,
"fillGradient": 0,
"gridPos": {
"h": 7,
"w": 9,
"x": 9,
"y": 54
},
"hiddenSeries": false,
"id": 61,
"legend": {
"avg": false,
"current": false,
"max": false,
"min": false,
"show": true,
"total": false,
"values": false
},
"lines": true,
"linewidth": 1,
"nullPointMode": "null",
"options": {
"alertThreshold": true
},
"percentage": false,
"pluginVersion": "7.3.6",
"pointradius": 2,
"points": false,
"renderer": "flot",
"seriesOverrides": [],
"spaceLength": 10,
"stack": false,
"steppedLine": false,
"targets": [
{
"expr": "tomcat_jdbc_connections_active_total{instance=\"$node\",job=\"$job\"}",
"instant": false,
"interval": "",
"legendFormat": "{{pool}}",
"refId": "A"
}
],
"thresholds": [],
"timeFrom": null,
"timeRegions": [],
"timeShift": null,
"title": "JDBC Active Connections",
"tooltip": {
"shared": true,
"sort": 0,
"value_type": "individual"
},
"type": "graph",
"xaxis": {
"buckets": null,
"mode": "time",
"name": null,
"show": true,
"values": []
},
"yaxes": [
{
"format": "short",
"label": null,
"logBase": 1,
"max": null,
"min": null,
"show": true
},
{
"format": "short",
"label": null,
"logBase": 1,
"max": null,
"min": null,
"show": true
}
],
"yaxis": {
"align": false,
"alignLevel": null
}
},
{
"aliasColors": {},
"bars": false,
"dashLength": 10,
"dashes": false,
"datasource": "${DS_PROMETHEUS}",
"description": "Number of idle connections in this pool",
"fieldConfig": {
"defaults": {
"custom": {
"align": null,
"filterable": false
},
"mappings": [],
"thresholds": {
"mode": "absolute",
"steps": [
{
"color": "green",
"value": null
}
]
}
},
"overrides": []
},
"fill": 1,
"fillGradient": 0,
"gridPos": {
"h": 7,
"w": 9,
"x": 0,
"y": 61
},
"hiddenSeries": false,
"id": 62,
"legend": {
"avg": false,
"current": false,
"max": false,
"min": false,
"show": true,
"total": false,
"values": false
},
"lines": true,
"linewidth": 1,
"nullPointMode": "null",
"options": {
"alertThreshold": true
},
"percentage": false,
"pluginVersion": "7.3.6",
"pointradius": 2,
"points": false,
"renderer": "flot",
"seriesOverrides": [],
"spaceLength": 10,
"stack": false,
"steppedLine": false,
"targets": [
{
"expr": "tomcat_jdbc_connections_idle_total{instance=\"$node\",job=\"$job\"}",
"instant": false,
"interval": "",
"legendFormat": "{{pool}}",
"refId": "A"
}
],
"thresholds": [],
"timeFrom": null,
"timeRegions": [],
"timeShift": null,
"title": "JDBC Idle Connections",
"tooltip": {
"shared": true,
"sort": 0,
"value_type": "individual"
},
"type": "graph",
"xaxis": {
"buckets": null,
"mode": "time",
"name": null,
"show": true,
"values": []
},
"yaxes": [
{
"format": "short",
"label": null,
"logBase": 1,
"max": null,
"min": null,
"show": true
},
{
"format": "short",
"label": null,
"logBase": 1,
"max": null,
"min": null,
"show": true
}
],
"yaxis": {
"align": false,
"alignLevel": null
}
},
{
"aliasColors": {},
"bars": false,
"dashLength": 10,
"dashes": false,
"datasource": "${DS_PROMETHEUS}",
"description": "Number of threads waiting for connections from this pool",
"fieldConfig": {
"defaults": {
"custom": {
"align": null,
"filterable": false
},
"mappings": [],
"thresholds": {
"mode": "absolute",
"steps": [
{
"color": "green",
"value": null
}
]
}
},
"overrides": []
},
"fill": 1,
"fillGradient": 0,
"gridPos": {
"h": 7,
"w": 9,
"x": 9,
"y": 61
},
"hiddenSeries": false,
"id": 64,
"legend": {
"avg": false,
"current": false,
"max": false,
"min": false,
"show": true,
"total": false,
"values": false
},
"lines": true,
"linewidth": 1,
"nullPointMode": "null",
"options": {
"alertThreshold": true
},
"percentage": false,
"pluginVersion": "7.3.6",
"pointradius": 2,
"points": false,
"renderer": "flot",
"seriesOverrides": [],
"spaceLength": 10,
"stack": false,
"steppedLine": false,
"targets": [
{
"expr": "tomcat_jdbc_waitingthreads_total{instance=\"$node\",job=\"$job\"}",
"instant": false,
"interval": "",
"legendFormat": "{{pool}}",
"refId": "A"
}
],
"thresholds": [],
"timeFrom": null,
"timeRegions": [],
"timeShift": null,
"title": "JDBC Waiting Threads Total",
"tooltip": {
"shared": true,
"sort": 0,
"value_type": "individual"
},
"type": "graph",
"xaxis": {
"buckets": null,
"mode": "time",
"name": null,
"show": true,
"values": []
},
"yaxes": [
{
"format": "short",
"label": null,
"logBase": 1,
"max": null,
"min": null,
"show": true
},
{
"format": "short",
"label": null,
"logBase": 1,
"max": null,
"min": null,
"show": true
}
],
"yaxis": {
"align": false,
"alignLevel": null
}
},
{
"aliasColors": {},
"bars": false,
"dashLength": 10,
"dashes": false,
"datasource": "${DS_PROMETHEUS}",
"description": "Number of connections borrowed from this pool",
"fieldConfig": {
"defaults": {
"custom": {
"align": null,
"filterable": false
},
"mappings": [],
"thresholds": {
"mode": "absolute",
"steps": [
{
"color": "green",
"value": null
}
]
}
},
"overrides": []
},
"fill": 1,
"fillGradient": 0,
"gridPos": {
"h": 7,
"w": 9,
"x": 0,
"y": 68
},
"hiddenSeries": false,
"id": 65,
"legend": {
"avg": false,
"current": false,
"max": false,
"min": false,
"show": true,
"total": false,
"values": false
},
"lines": true,
"linewidth": 1,
"nullPointMode": "null",
"options": {
"alertThreshold": true
},
"percentage": false,
"pluginVersion": "7.3.6",
"pointradius": 2,
"points": false,
"renderer": "flot",
"seriesOverrides": [],
"spaceLength": 10,
"stack": false,
"steppedLine": false,
"targets": [
{
"expr": "rate(tomcat_jdbc_connections_borrowed_total{instance=\"$node\",job=\"$job\"}[5m])",
"instant": false,
"interval": "",
"legendFormat": "{{pool}}",
"refId": "A"
}
],
"thresholds": [],
"timeFrom": null,
"timeRegions": [],
"timeShift": null,
"title": "JDBC Connections Borrowed /s over 5 min",
"tooltip": {
"shared": true,
"sort": 0,
"value_type": "individual"
},
"type": "graph",
"xaxis": {
"buckets": null,
"mode": "time",
"name": null,
"show": true,
"values": []
},
"yaxes": [
{
"format": "short",
"label": null,
"logBase": 1,
"max": null,
"min": null,
"show": true
},
{
"format": "short",
"label": null,
"logBase": 1,
"max": null,
"min": null,
"show": true
}
],
"yaxis": {
"align": false,
"alignLevel": null
}
},
{
"aliasColors": {},
"bars": false,
"dashLength": 10,
"dashes": false,
"datasource": "${DS_PROMETHEUS}",
"description": "Number of connections returned to this pool",
"fieldConfig": {
"defaults": {
"custom": {
"align": null,
"filterable": false
},
"mappings": [],
"thresholds": {
"mode": "absolute",
"steps": [
{
"color": "green",
"value": null
}
]
}
},
"overrides": []
},
"fill": 1,
"fillGradient": 0,
"gridPos": {
"h": 7,
"w": 9,
"x": 9,
"y": 68
},
"hiddenSeries": false,
"id": 66,
"legend": {
"avg": false,
"current": false,
"max": false,
"min": false,
"show": true,
"total": false,
"values": false
},
"lines": true,
"linewidth": 1,
"nullPointMode": "null",
"options": {
"alertThreshold": true
},
"percentage": false,
"pluginVersion": "7.3.6",
"pointradius": 2,
"points": false,
"renderer": "flot",
"seriesOverrides": [],
"spaceLength": 10,
"stack": false,
"steppedLine": false,
"targets": [
{
"expr": "rate(tomcat_jdbc_connections_returned_total{instance=\"$node\",job=\"$job\"}[5m])",
"instant": false,
"interval": "",
"legendFormat": "{{pool}}",
"refId": "A"
}
],
"thresholds": [],
"timeFrom": null,
"timeRegions": [],
"timeShift": null,
"title": "JDBC Connections Returned /s over 5 min",
"tooltip": {
"shared": true,
"sort": 0,
"value_type": "individual"
},
"type": "graph",
"xaxis": {
"buckets": null,
"mode": "time",
"name": null,
"show": true,
"values": []
},
"yaxes": [
{
"format": "short",
"label": null,
"logBase": 1,
"max": null,
"min": null,
"show": true
},
{
"format": "short",
"label": null,
"logBase": 1,
"max": null,
"min": null,
"show": true
}
],
"yaxis": {
"align": false,
"alignLevel": null
}
},
{
"aliasColors": {},
"bars": false,
"dashLength": 10,
"dashes": false,
"datasource": "${DS_PROMETHEUS}",
"description": "Number of connections created by this pool",
"fieldConfig": {
"defaults": {
"custom": {
"align": null,
"filterable": false
},
"mappings": [],
"thresholds": {
"mode": "absolute",
"steps": [
{
"color": "green",
"value": null
}
]
}
},
"overrides": []
},
"fill": 1,
"fillGradient": 0,
"gridPos": {
"h": 7,
"w": 9,
"x": 0,
"y": 75
},
"hiddenSeries": false,
"id": 67,
"legend": {
"avg": false,
"current": false,
"max": false,
"min": false,
"show": true,
"total": false,
"values": false
},
"lines": true,
"linewidth": 1,
"nullPointMode": "null",
"options": {
"alertThreshold": true
},
"percentage": false,
"pluginVersion": "7.3.6",
"pointradius": 2,
"points": false,
"renderer": "flot",
"seriesOverrides": [],
"spaceLength": 10,
"stack": false,
"steppedLine": false,
"targets": [
{
"expr": "rate(tomcat_jdbc_connections_created_total{instance=\"$node\",job=\"$job\"}[5m])",
"instant": false,
"interval": "",
"legendFormat": "{{pool}}",
"refId": "A"
}
],
"thresholds": [],
"timeFrom": null,
"timeRegions": [],
"timeShift": null,
"title": "JDBC Connections Created /s over 5 min",
"tooltip": {
"shared": true,
"sort": 0,
"value_type": "individual"
},
"type": "graph",
"xaxis": {
"buckets": null,
"mode": "time",
"name": null,
"show": true,
"values": []
},
"yaxes": [
{
"format": "short",
"label": null,
"logBase": 1,
"max": null,
"min": null,
"show": true
},
{
"format": "short",
"label": null,
"logBase": 1,
"max": null,
"min": null,
"show": true
}
],
"yaxis": {
"align": false,
"alignLevel": null
}
},
{
"aliasColors": {},
"bars": false,
"dashLength": 10,
"dashes": false,
"datasource": "${DS_PROMETHEUS}",
"description": "Number of connections released by this pool",
"fieldConfig": {
"defaults": {
"custom": {
"align": null,
"filterable": false
},
"mappings": [],
"thresholds": {
"mode": "absolute",
"steps": [
{
"color": "green",
"value": null
}
]
}
},
"overrides": []
},
"fill": 1,
"fillGradient": 0,
"gridPos": {
"h": 7,
"w": 9,
"x": 9,
"y": 75
},
"hiddenSeries": false,
"id": 68,
"legend": {
"avg": false,
"current": false,
"max": false,
"min": false,
"show": true,
"total": false,
"values": false
},
"lines": true,
"linewidth": 1,
"nullPointMode": "null",
"options": {
"alertThreshold": true
},
"percentage": false,
"pluginVersion": "7.3.6",
"pointradius": 2,
"points": false,
"renderer": "flot",
"seriesOverrides": [],
"spaceLength": 10,
"stack": false,
"steppedLine": false,
"targets": [
{
"expr": "rate(tomcat_jdbc_connections_released_total{instance=\"$node\",job=\"$job\"}[5m])",
"instant": false,
"interval": "",
"legendFormat": "{{pool}}",
"refId": "A"
}
],
"thresholds": [],
"timeFrom": null,
"timeRegions": [],
"timeShift": null,
"title": "JDBC Connections Released /s over 5 min",
"tooltip": {
"shared": true,
"sort": 0,
"value_type": "individual"
},
"type": "graph",
"xaxis": {
"buckets": null,
"mode": "time",
"name": null,
"show": true,
"values": []
},
"yaxes": [
{
"format": "short",
"label": null,
"logBase": 1,
"max": null,
"min": null,
"show": true
},
{
"format": "short",
"label": null,
"logBase": 1,
"max": null,
"min": null,
"show": true
}
],
"yaxis": {
"align": false,
"alignLevel": null
}
},
{
"aliasColors": {},
"bars": false,
"dashLength": 10,
"dashes": false,
"datasource": "${DS_PROMETHEUS}",
"description": "Number of reconnected connections by this pool",
"fieldConfig": {
"defaults": {
"custom": {
"align": null,
"filterable": false
},
"mappings": [],
"thresholds": {
"mode": "absolute",
"steps": [
{
"color": "green",
"value": null
}
]
}
},
"overrides": []
},
"fill": 1,
"fillGradient": 0,
"gridPos": {
"h": 7,
"w": 9,
"x": 0,
"y": 82
},
"hiddenSeries": false,
"id": 69,
"legend": {
"avg": false,
"current": false,
"max": false,
"min": false,
"show": true,
"total": false,
"values": false
},
"lines": true,
"linewidth": 1,
"nullPointMode": "null",
"options": {
"alertThreshold": true
},
"percentage": false,
"pluginVersion": "7.3.6",
"pointradius": 2,
"points": false,
"renderer": "flot",
"seriesOverrides": [],
"spaceLength": 10,
"stack": false,
"steppedLine": false,
"targets": [
{
"expr": "rate(tomcat_jdbc_connections_reconnected_total{instance=\"$node\",job=\"$job\"}[5m])",
"instant": false,
"interval": "",
"legendFormat": "{{pool}}",
"refId": "A"
}
],
"thresholds": [],
"timeFrom": null,
"timeRegions": [],
"timeShift": null,
"title": "JDBC Connections Reconnected /s over 5 min",
"tooltip": {
"shared": true,
"sort": 0,
"value_type": "individual"
},
"type": "graph",
"xaxis": {
"buckets": null,
"mode": "time",
"name": null,
"show": true,
"values": []
},
"yaxes": [
{
"format": "short",
"label": null,
"logBase": 1,
"max": null,
"min": null,
"show": true
},
{
"format": "short",
"label": null,
"logBase": 1,
"max": null,
"min": null,
"show": true
}
],
"yaxis": {
"align": false,
"alignLevel": null
}
},
{
"aliasColors": {},
"bars": false,
"dashLength": 10,
"dashes": false,
"datasource": "${DS_PROMETHEUS}",
"description": "Number of abandoned connections that have been removed",
"fieldConfig": {
"defaults": {
"custom": {
"align": null,
"filterable": false
},
"mappings": [],
"thresholds": {
"mode": "absolute",
"steps": [
{
"color": "green",
"value": null
}
]
}
},
"overrides": []
},
"fill": 1,
"fillGradient": 0,
"gridPos": {
"h": 7,
"w": 9,
"x": 9,
"y": 82
},
"hiddenSeries": false,
"id": 70,
"legend": {
"avg": false,
"current": false,
"max": false,
"min": false,
"show": true,
"total": false,
"values": false
},
"lines": true,
"linewidth": 1,
"nullPointMode": "null",
"options": {
"alertThreshold": true
},
"percentage": false,
"pluginVersion": "7.3.6",
"pointradius": 2,
"points": false,
"renderer": "flot",
"seriesOverrides": [],
"spaceLength": 10,
"stack": false,
"steppedLine": false,
"targets": [
{
"expr": "rate(tomcat_jdbc_connections_removeabandoned_total{instance=\"$node\",job=\"$job\"}[5m])",
"instant": false,
"interval": "",
"legendFormat": "{{pool}}",
"refId": "A"
}
],
"thresholds": [],
"timeFrom": null,
"timeRegions": [],
"timeShift": null,
"title": "JDBC Connections Removed/Abandoned /sec over 5 min",
"tooltip": {
"shared": true,
"sort": 0,
"value_type": "individual"
},
"type": "graph",
"xaxis": {
"buckets": null,
"mode": "time",
"name": null,
"show": true,
"values": []
},
"yaxes": [
{
"format": "short",
"label": null,
"logBase": 1,
"max": null,
"min": null,
"show": true
},
{
"format": "short",
"label": null,
"logBase": 1,
"max": null,
"min": null,
"show": true
}
],
"yaxis": {
"align": false,
"alignLevel": null
}
},
{
"aliasColors": {},
"bars": false,
"dashLength": 10,
"dashes": false,
"datasource": "${DS_PROMETHEUS}",
"description": "Number of idle connections that have been released",
"fieldConfig": {
"defaults": {
"custom": {
"align": null,
"filterable": false
},
"mappings": [],
"thresholds": {
"mode": "absolute",
"steps": [
{
"color": "green",
"value": null
}
]
}
},
"overrides": []
},
"fill": 1,
"fillGradient": 0,
"gridPos": {
"h": 7,
"w": 9,
"x": 0,
"y": 89
},
"hiddenSeries": false,
"id": 71,
"legend": {
"avg": false,
"current": false,
"max": false,
"min": false,
"show": true,
"total": false,
"values": false
},
"lines": true,
"linewidth": 1,
"nullPointMode": "null",
"options": {
"alertThreshold": true
},
"percentage": false,
"pluginVersion": "7.3.6",
"pointradius": 2,
"points": false,
"renderer": "flot",
"seriesOverrides": [],
"spaceLength": 10,
"stack": false,
"steppedLine": false,
"targets": [
{
"expr": "rate(tomcat_jdbc_connections_releasedidle_total{instance=\"$node\",job=\"$job\"}[5m])",
"instant": false,
"interval": "",
"legendFormat": "{{pool}}",
"refId": "A"
}
],
"thresholds": [],
"timeFrom": null,
"timeRegions": [],
"timeShift": null,
"title": "JDBC Connections Released/Idle /s over 5 min",
"tooltip": {
"shared": true,
"sort": 0,
"value_type": "individual"
},
"type": "graph",
"xaxis": {
"buckets": null,
"mode": "time",
"name": null,
"show": true,
"values": []
},
"yaxes": [
{
"format": "short",
"label": null,
"logBase": 1,
"max": null,
"min": null,
"show": true
},
{
"format": "short",
"label": null,
"logBase": 1,
"max": null,
"min": null,
"show": true
}
],
"yaxis": {
"align": false,
"alignLevel": null
}
},
{
"datasource": "${DS_PROMETHEUS}",
"description": "Number of errors for give JDBC query",
"fieldConfig": {
"defaults": {
"custom": {
"align": null,
"filterable": false
},
"mappings": [],
"thresholds": {
"mode": "absolute",
"steps": [
{
"color": "green",
"value": null
}
]
}
},
"overrides": []
},
"gridPos": {
"h": 8,
"w": 18,
"x": 0,
"y": 96
},
"id": 72,
"options": {
"showHeader": true
},
"pluginVersion": "7.3.6",
"targets": [
{
"expr": "tomcat_jdbc_failedquery_total{instance=\"$node\",job=\"$job\"}",
"format": "table",
"instant": false,
"interval": "",
"legendFormat": "{{query}}",
"refId": "A"
}
],
"timeFrom": null,
"timeShift": null,
"title": "JDBC Failed Query Totals",
"transformations": [
{
"id": "organize",
"options": {
"excludeByName": {
"Time": false,
"__name__": true,
"env_severity": true,
"hostname": true,
"instance": true,
"job": true
},
"indexByName": {},
"renameByName": {
"__name__": ""
}
}
},
{
"id": "groupBy",
"options": {
"fields": {
"Value": {
"aggregations": [
"sum"
],
"operation": "aggregate"
},
"query": {
"aggregations": [],
"operation": "groupby"
}
}
}
}
],
"type": "table"
},
{
"datasource": "${DS_PROMETHEUS}",
"description": "Number of errors for give JDBC query",
"fieldConfig": {
"defaults": {
"custom": {
"align": null,
"filterable": false
},
"mappings": [],
"thresholds": {
"mode": "absolute",
"steps": [
{
"color": "green",
"value": null
}
]
}
},
"overrides": []
},
"gridPos": {
"h": 8,
"w": 18,
"x": 0,
"y": 104
},
"id": 73,
"options": {
"showHeader": true
},
"pluginVersion": "7.3.6",
"targets": [
{
"expr": "sum by(query) (tomcat_jdbc_failedquery_total{instance=\"$node\",job=\"$job\"})",
"format": "table",
"instant": false,
"interval": "",
"legendFormat": "{{query}}",
"refId": "A"
}
],
"timeFrom": null,
"timeShift": null,
"title": "JDBC Failed Query Details",
"transformations": [
{
"id": "organize",
"options": {
"excludeByName": {
"Time": false,
"__name__": true,
"env_severity": true,
"hostname": true,
"instance": true,
"job": true
},
"indexByName": {},
"renameByName": {
"__name__": ""
}
}
}
],
"type": "table"
},
{
"aliasColors": {},
"bars": false,
"dashLength": 10,
"dashes": false,
"datasource": "${DS_PROMETHEUS}",
"description": "JDBC query duration",
"fieldConfig": {
"defaults": {
"custom": {}
},
"overrides": []
},
"fill": 1,
"fillGradient": 0,
"gridPos": {
"h": 8,
"w": 9,
"x": 0,
"y": 112
},
"hiddenSeries": false,
"id": 75,
"legend": {
"avg": false,
"current": false,
"max": false,
"min": false,
"show": true,
"total": false,
"values": false
},
"lines": true,
"linewidth": 1,
"nullPointMode": "null",
"options": {
"alertThreshold": true
},
"percentage": false,
"pluginVersion": "7.3.6",
"pointradius": 2,
"points": false,
"renderer": "flot",
"seriesOverrides": [],
"spaceLength": 10,
"stack": false,
"steppedLine": false,
"targets": [
{
"expr": "rate(tomcat_jdbc_query_seconds_sum{instance=\"$node\",job=\"$job\"}[1m])",
"format": "time_series",
"instant": false,
"interval": "",
"intervalFactor": 1,
"legendFormat": "{{status}}",
"refId": "A"
}
],
"thresholds": [],
"timeFrom": null,
"timeRegions": [],
"timeShift": null,
"title": "JDBC query total duration /s over 1 min",
"tooltip": {
"shared": true,
"sort": 0,
"value_type": "individual"
},
"type": "graph",
"xaxis": {
"buckets": null,
"mode": "time",
"name": null,
"show": true,
"values": []
},
"yaxes": [
{
"format": "short",
"label": null,
"logBase": 1,
"max": null,
"min": null,
"show": true
},
{
"format": "short",
"label": null,
"logBase": 1,
"max": null,
"min": null,
"show": true
}
],
"yaxis": {
"align": false,
"alignLevel": null
}
},
{
"aliasColors": {},
"bars": false,
"dashLength": 10,
"dashes": false,
"datasource": "${DS_PROMETHEUS}",
"description": "JDBC query counts",
"fieldConfig": {
"defaults": {
"custom": {}
},
"overrides": []
},
"fill": 1,
"fillGradient": 0,
"gridPos": {
"h": 8,
"w": 9,
"x": 9,
"y": 112
},
"hiddenSeries": false,
"id": 76,
"legend": {
"avg": false,
"current": false,
"max": false,
"min": false,
"show": true,
"total": false,
"values": false
},
"lines": true,
"linewidth": 1,
"nullPointMode": "null",
"options": {
"alertThreshold": true
},
"percentage": false,
"pluginVersion": "7.3.6",
"pointradius": 2,
"points": false,
"renderer": "flot",
"seriesOverrides": [],
"spaceLength": 10,
"stack": false,
"steppedLine": false,
"targets": [
{
"expr": "rate(tomcat_jdbc_query_seconds_count{instance=\"$node\",job=\"$job\"}[1m])",
"format": "time_series",
"instant": false,
"interval": "",
"intervalFactor": 1,
"legendFormat": "{{status}}",
"refId": "A"
}
],
"thresholds": [],
"timeFrom": null,
"timeRegions": [],
"timeShift": null,
"title": "JDBC query count /s over 1 min",
"tooltip": {
"shared": true,
"sort": 0,
"value_type": "individual"
},
"type": "graph",
"xaxis": {
"buckets": null,
"mode": "time",
"name": null,
"show": true,
"values": []
},
"yaxes": [
{
"format": "short",
"label": null,
"logBase": 1,
"max": null,
"min": null,
"show": true
},
{
"format": "short",
"label": null,
"logBase": 1,
"max": null,
"min": null,
"show": true
}
],
"yaxis": {
"align": false,
"alignLevel": null
}
},
{
"aliasColors": {},
"bars": false,
"dashLength": 10,
"dashes": false,
"datasource": "${DS_PROMETHEUS}",
"description": "JDBC avg query duration",
"fieldConfig": {
"defaults": {
"custom": {}
},
"overrides": []
},
"fill": 1,
"fillGradient": 0,
"gridPos": {
"h": 8,
"w": 12,
"x": 0,
"y": 120
},
"hiddenSeries": false,
"id": 77,
"legend": {
"avg": false,
"current": false,
"max": false,
"min": false,
"show": true,
"total": false,
"values": false
},
"lines": true,
"linewidth": 1,
"nullPointMode": "null",
"options": {
"alertThreshold": true
},
"percentage": false,
"pluginVersion": "7.3.6",
"pointradius": 2,
"points": false,
"renderer": "flot",
"seriesOverrides": [],
"spaceLength": 10,
"stack": false,
"steppedLine": false,
"targets": [
{
"expr": "rate(tomcat_jdbc_query_seconds_sum{instance=\"$node\",job=\"$job\"}[1m]) / rate(tomcat_jdbc_query_seconds_count{instance=\"$node\",job=\"$job\"}[1m])",
"format": "time_series",
"instant": false,
"interval": "",
"intervalFactor": 1,
"legendFormat": "{{status}}",
"refId": "A"
}
],
"thresholds": [],
"timeFrom": null,
"timeRegions": [],
"timeShift": null,
"title": "JDBC query average query duration over 1 min",
"tooltip": {
"shared": true,
"sort": 0,
"value_type": "individual"
},
"type": "graph",
"xaxis": {
"buckets": null,
"mode": "time",
"name": null,
"show": true,
"values": []
},
"yaxes": [
{
"format": "short",
"label": null,
"logBase": 1,
"max": null,
"min": null,
"show": true
},
{
"format": "short",
"label": null,
"logBase": 1,
"max": null,
"min": null,
"show": true
}
],
"yaxis": {
"align": false,
"alignLevel": null
}
}
],
"schemaVersion": 26,
"style": "dark",
"tags": [],
"templating": {
"list": [
{
"allValue": null,
"current": {},
"datasource": "${DS_PROMETHEUS}",
"definition": "label_values(tomcat_session_active_total, job)",
"error": null,
"hide": 0,
"includeAll": false,
"label": "Job",
"multi": false,
"name": "job",
"options": [],
"query": "label_values(tomcat_session_active_total, job)",
"refresh": 1,
"regex": "",
"skipUrlSync": false,
"sort": 1,
"tagValuesQuery": "",
"tags": [],
"tagsQuery": "",
"type": "query",
"useTags": false
},
{
"allValue": null,
"current": {},
"datasource": "${DS_PROMETHEUS}",
"definition": "label_values(tomcat_session_active_total{job=\"$job\"}, instance)",
"error": null,
"hide": 0,
"includeAll": false,
"label": "Host:",
"multi": false,
"name": "node",
"options": [],
"query": "label_values(tomcat_session_active_total{job=\"$job\"}, instance)",
"refresh": 1,
"regex": "",
"skipUrlSync": false,
"sort": 1,
"tagValuesQuery": "",
"tags": [],
"tagsQuery": "",
"type": "query",
"useTags": false
}
]
},
"time": {
"from": "now-5m",
"to": "now"
},
"timepicker": {},
"timezone": "",
"title": "Tomcat Exporter",
"uid": "DVWnyqH7z",
"version": 227
}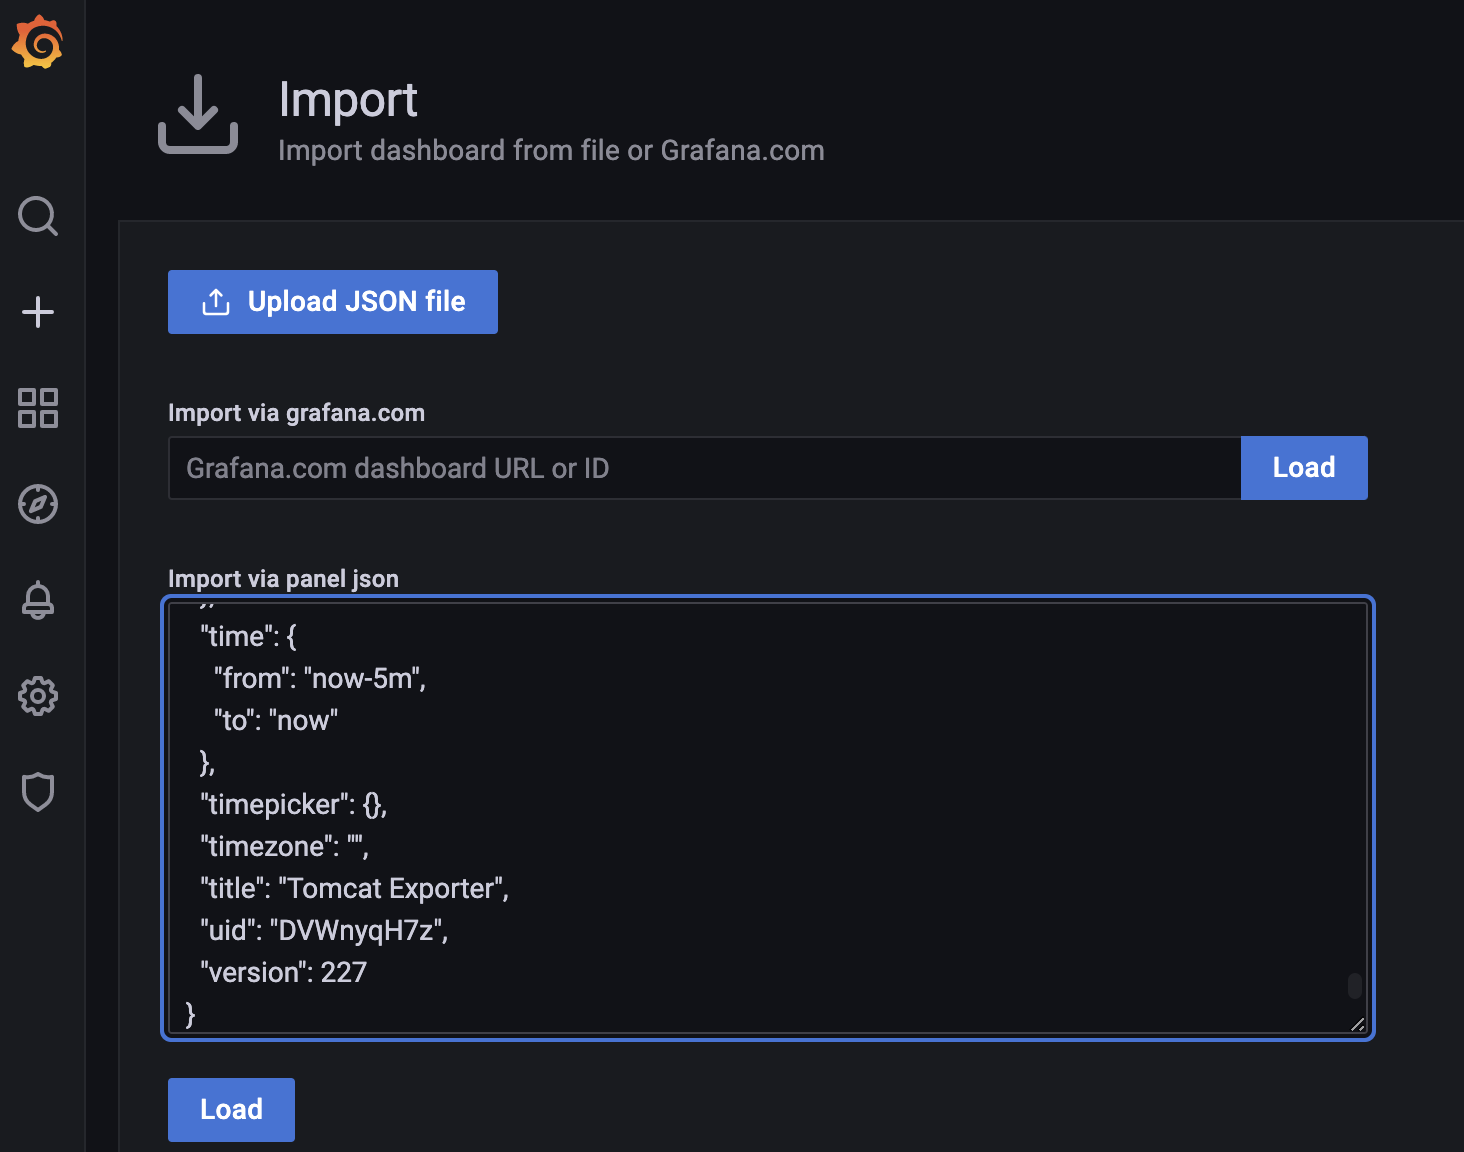
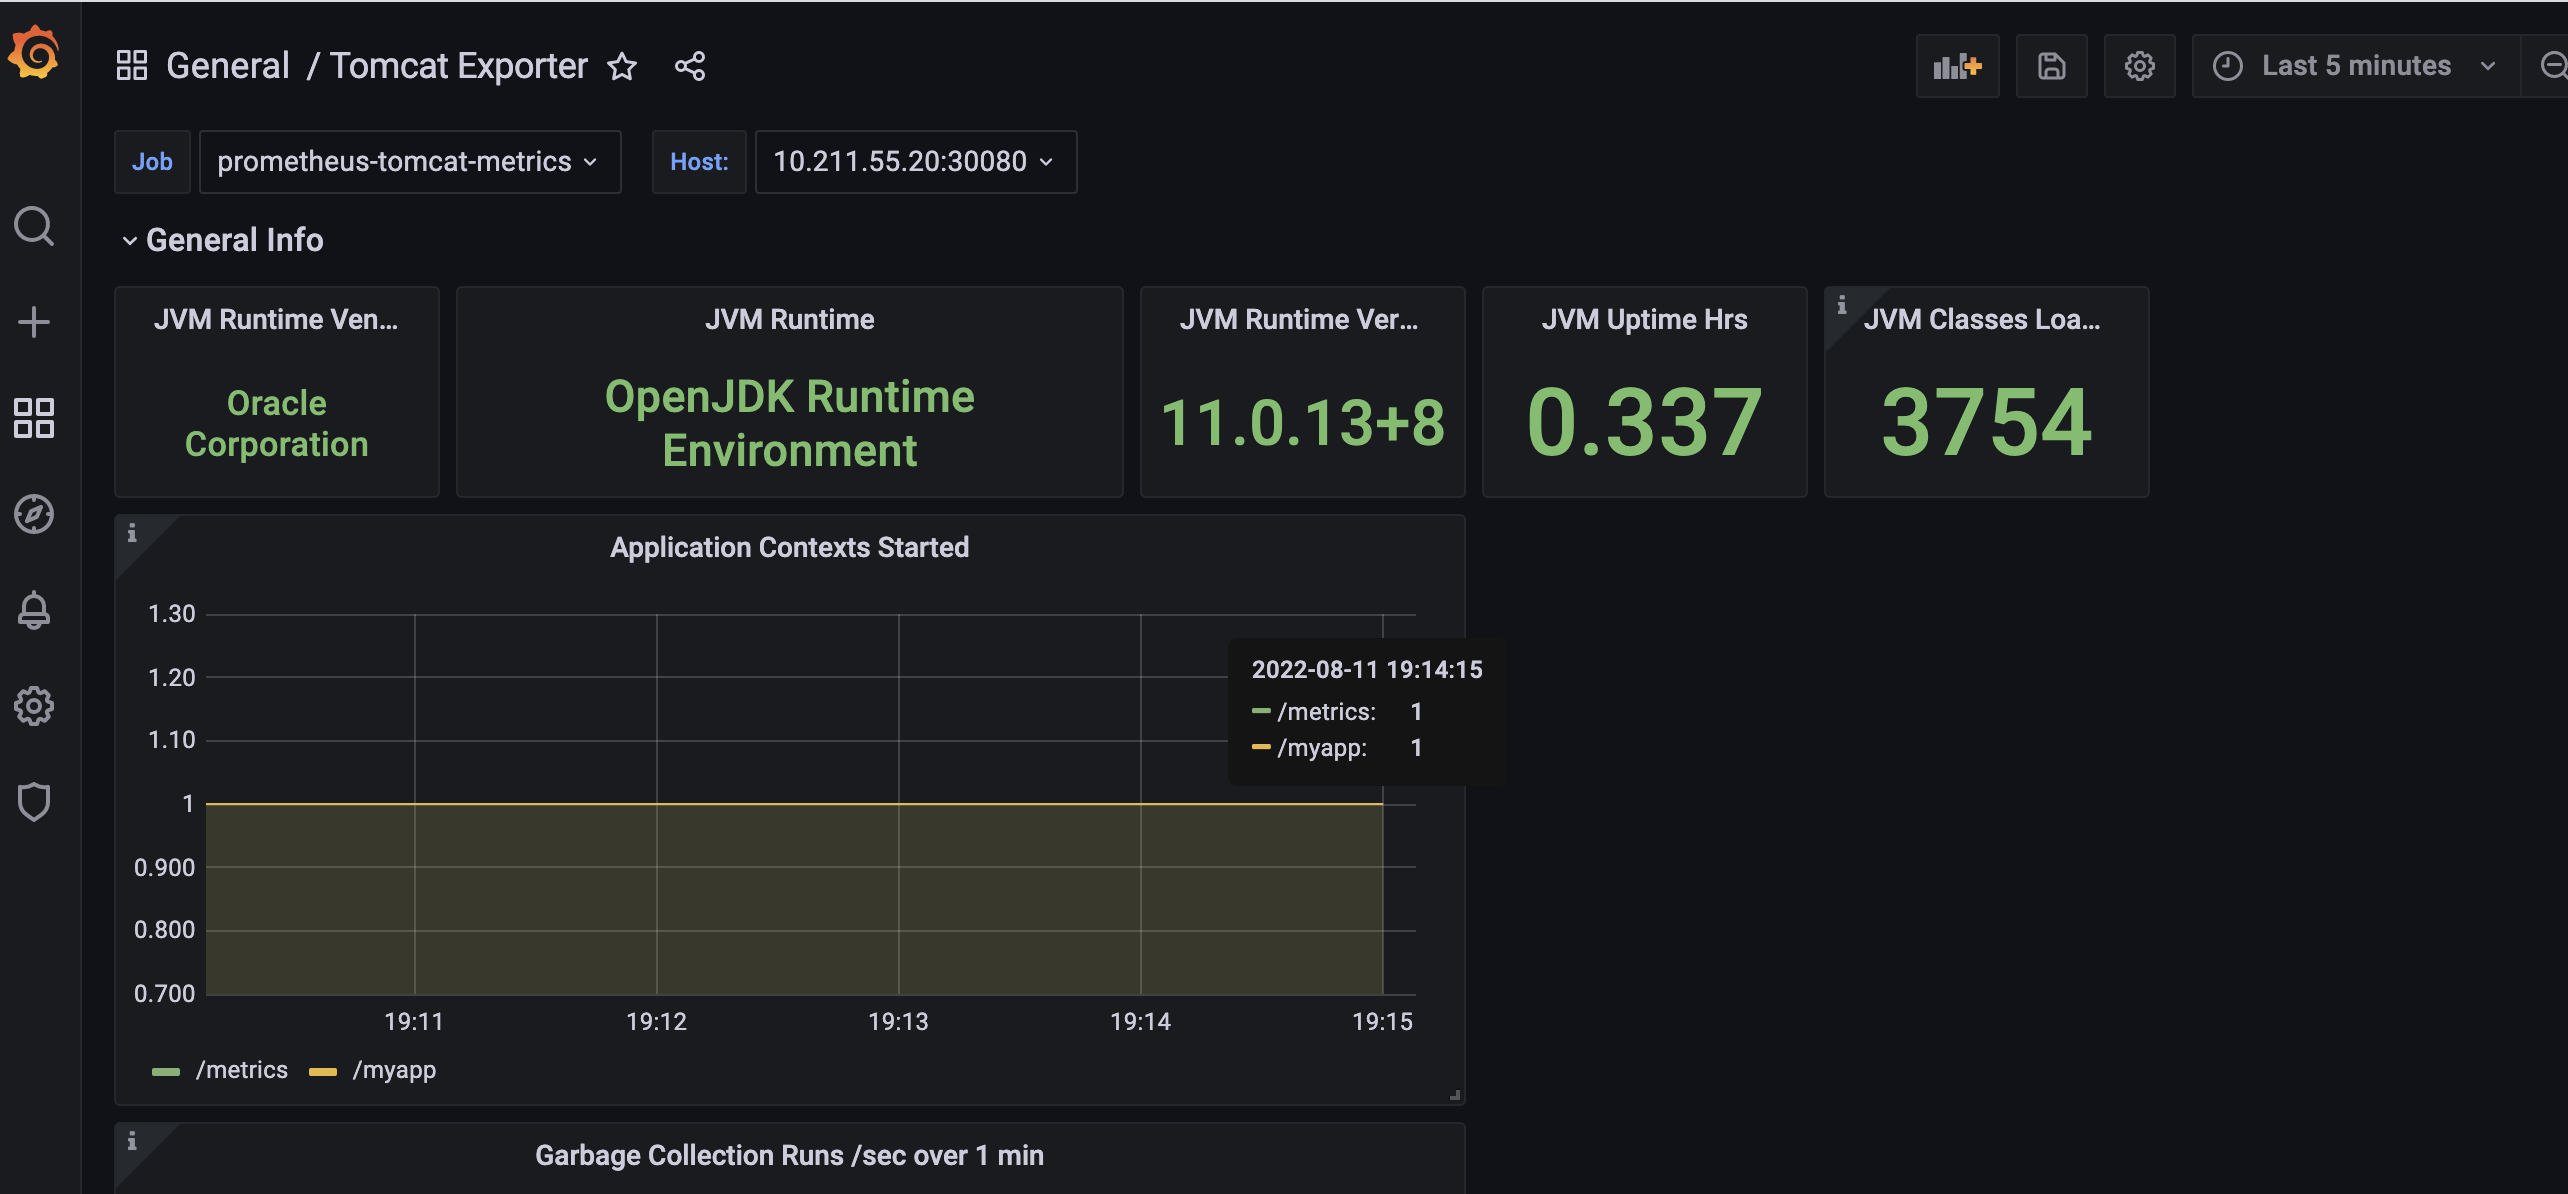
分类:
Prometheus


【推荐】国内首个AI IDE,深度理解中文开发场景,立即下载体验Trae
【推荐】编程新体验,更懂你的AI,立即体验豆包MarsCode编程助手
【推荐】抖音旗下AI助手豆包,你的智能百科全书,全免费不限次数
【推荐】轻量又高性能的 SSH 工具 IShell:AI 加持,快人一步
· 无需6万激活码!GitHub神秘组织3小时极速复刻Manus,手把手教你使用OpenManus搭建本
· Manus爆火,是硬核还是营销?
· 终于写完轮子一部分:tcp代理 了,记录一下
· 别再用vector<bool>了!Google高级工程师:这可能是STL最大的设计失误
· 单元测试从入门到精通