使用Prometheus和Grafana监控Envoy Mesh
### 架构示意图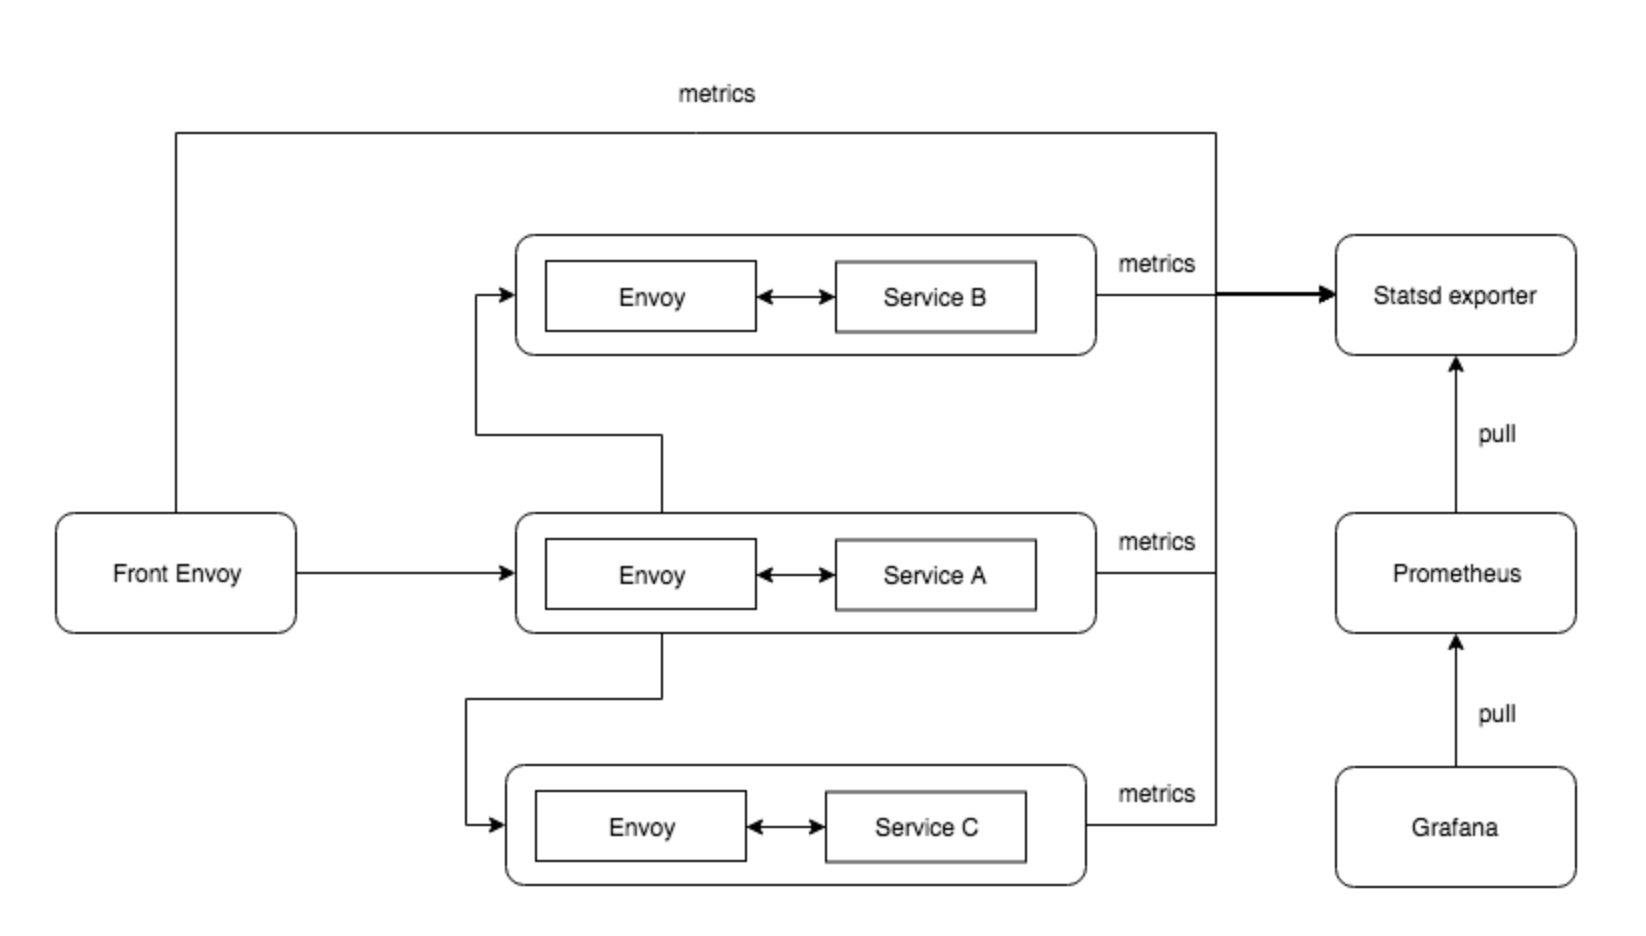
##### Envoy Mesh使用的网络: 172.31.79.0/24
##### 10个Service:
- front-envoy:Front Proxy,地址为172.31.79.10
- 6个后端服务
- service_a_envoy和service_a:对应于Envoy中的service_a集群,会调用service_b和service_c;
- service_b_envoy和service_b:对应于Envoy中的service_b集群;
- service_c_envoy和service_c:对应于Envoy中的service_c集群;
- Prometheus指标监控相关的服务3个
- statsd_exporter
- prometheus
- grafana
- EFK日志相关的服务3个
- elaistchsearch
- kibana
- filebeat
##### 特殊要求
目录logs/envoy/下的日志文件front-envoy-access.log的属主需要修改为envoy容器中运行envoy进程的用户envoy,其UID和GID默认分别为100和101,否则,front-envoy进程将日志写入到该文件时,将显示为“Permission Denied.”
创建一个front-envoy-access.log如果启动报错就给777权限
chown 100.101 logs/envoy/front-envoy-access.log
[root@k8s-master monitoring-and-accesslog]# tree ../monitoring-and-accesslog/
../monitoring-and-accesslog/
├── docker-compose.yml
├── filebeat
│   └── filebeat.yaml
├── front_envoy
│   └── envoy-config.yaml
├── grafana
│   ├── dashboard.json
│   ├── dashboard.yaml
│   ├── datasource.yaml
│   ├── grafana.ini
│   └── service-dashboard.py
├── images
│   ├── envoy_monitoring.png
│   ├── grafana.png
│   ├── kb-create-index-pattern-001.png
│   ├── kb-create-index-pattern-002.png
│   ├── kb-create-index-pattern-003.png
│   ├── kb-create-index-pattern-004.png
│   ├── kb-discover-001.png
│   └── prometheus.png
├── logs
│   └── envoy
│       ├── front-envoy-access.log
│       ├── service_a-envoy-access.log
│       ├── service_b-envoy-access.log
│       └── service_c-envoy-access.log
├── prometheus
│   └── config.yaml
├── README.md
├── service_a
│   ├── Dockerfile
│   ├── envoy-config.yaml
│   └── main.go
├── service_b
│   ├── Dockerfile
│   ├── envoy-config.yaml
│   └── main.go
└── service_c
    ├── Dockerfile
    ├── envoy-config.yaml
    └── main.go
启动
docker-compose up[root@k8s-master monitoring-and-accesslog]# cat docker-compose.yml
# Author: MageEdu <mage@magedu.com>
# www.magedu.com
version: '3.3'
services:
front-envoy:
image: envoyproxy/envoy-alpine:v1.21-latest
environment:
- ENVOY_UID=0
- ENVOY_GID=0
volumes:
- "./front_envoy/envoy-config.yaml:/etc/envoy/envoy.yaml"
- "./logs/envoy:/logs/envoy"
networks:
envoymesh:
ipv4_address: 172.31.79.10
aliases:
- front-envoy
- front
ports:
- 8080:80
- 9901:9901
service_a-envoy:
image: envoyproxy/envoy-alpine:v1.20.0
volumes:
- "./service_a/envoy-config.yaml:/etc/envoy/envoy.yaml"
- "./logs/envoy:/logs/envoy"
networks:
envoymesh:
aliases:
- service_a_envoy
- service-a-envoy
ports:
- 8786:8786
- 8788:8788
service_a:
build: service_a/
networks:
envoymesh:
aliases:
- service_a
- service-a
ports:
- 8081:8081
service_b-envoy:
image: envoyproxy/envoy-alpine:v1.20.0
volumes:
- "./service_b/envoy-config.yaml:/etc/envoy/envoy.yaml"
- "./logs/envoy:/logs/envoy"
networks:
envoymesh:
aliases:
- service_b_envoy
- service-b-envoy
ports:
- 8789:8789
service_b:
build: service_b/
networks:
envoymesh:
aliases:
- service_b
- service-b
ports:
- 8082:8082
service_c-envoy:
image: envoyproxy/envoy-alpine:v1.20.0
volumes:
- "./service_c/envoy-config.yaml:/etc/envoy/envoy.yaml"
- "./logs/envoy:/logs/envoy"
networks:
envoymesh:
aliases:
- service_c_envoy
- service-c-envoy
ports:
- 8790:8790
service_c:
build: service_c/
networks:
envoymesh:
aliases:
- service_c
- service-c
ports:
- 8083:8083
statsd_exporter:
image: prom/statsd-exporter:v0.22.3
networks:
envoymesh:
ipv4_address: 172.31.79.20
aliases:
- statsd_exporter
ports:
- 9125:9125
- 9102:9102
prometheus:
image: prom/prometheus:v2.30.3
volumes:
- "./prometheus/config.yaml:/etc/prometheus.yaml"
networks:
envoymesh:
ipv4_address: 172.31.79.19
aliases:
- prometheus
ports:
- 9090:9090
command: "--config.file=/etc/prometheus.yaml"
grafana:
image: grafana/grafana:8.2.2
volumes:
- "./grafana/grafana.ini:/etc/grafana/grafana.ini"
- "./grafana/datasource.yaml:/etc/grafana/provisioning/datasources/datasource.yaml"
- "./grafana/dashboard.yaml:/etc/grafana/provisioning/dashboards/dashboard.yaml"
- "./grafana/dashboard.json:/etc/grafana/provisioning/dashboards/dashboard.json"
networks:
envoymesh:
ipv4_address: 172.31.79.18
aliases:
- grafana
ports:
- 3000:3000
elasticsearch:
image: "docker.elastic.co/elasticsearch/elasticsearch:7.14.2"
environment:
- "ES_JAVA_OPTS=-Xms2g -Xmx2g"
- "discovery.type=single-node"
- "cluster.name=myes"
- "node.name=myes01"
ulimits:
memlock:
soft: -1
hard: -1
networks:
envoymesh:
ipv4_address: 172.31.79.15
aliases:
- es
- myes01
ports:
- "9200:9200"
volumes:
- elasticsearch_data:/usr/share/elasticsearch/data
kibana:
image: "docker.elastic.co/kibana/kibana:7.14.2"
environment:
ELASTICSEARCH_URL: http://myes01:9200
ELASTICSEARCH_HOSTS: '["http://myes01:9200"]'
networks:
envoymesh:
ipv4_address: 172.31.79.16
aliases:
- kibana
- kib
ports:
- "5601:5601"
filebeat:
image: "docker.elastic.co/beats/filebeat:7.14.2"
networks:
envoymesh:
ipv4_address: 172.31.79.17
aliases:
- filebeat
- fb
user: root
command: ["--strict.perms=false"]
volumes:
- ./filebeat/filebeat.yaml:/usr/share/filebeat/filebeat.yml
#- /var/lib/docker:/var/lib/docker:ro
#- /var/run/docker.sock:/var/run/docker.sock
- ./logs/envoy:/logs/envoy:ro
volumes:
elasticsearch_data:
networks:
envoymesh:
driver: bridge
ipam:
config:
- subnet: 172.31.79.0/24
[root@k8s-master monitoring-and-accesslog]# cat filebeat/filebeat.yaml
filebeat.inputs:
- type: log
paths:
- '/logs/envoy/*access.log'
processors:
- decode_json_fields:
fields: ["message"]
target: ""
overwrite_keys: true
output.elasticsearch:
hosts: ["http://elasticsearch:9200"]
indices:
- index: "filebeat-%{+yyyy.MM.dd}"
# - index: "filebeat-%{[agent.version]}-%{+yyyy.MM.dd}"
#output.console:
# enabled: true
# codec.json:
# pretty: true
# #escape_html: false
logging.json: true
logging.metrics.enabled: false
[root@k8s-master monitoring-and-accesslog]# cat front_envoy/envoy-config.yaml
node:
id: front-envoy
cluster: mycluster
admin:
profile_path: /tmp/envoy.prof
access_log_path: /tmp/admin_access.log
address:
socket_address:
address: 0.0.0.0
port_value: 9901
layered_runtime:
layers:
- name: admin
admin_layer: {}
stats_sinks:
- name: envoy.statsd
typed_config:
"@type": type.googleapis.com/envoy.config.metrics.v3.StatsdSink
tcp_cluster_name: statsd_exporter
prefix: front-envoy
static_resources:
listeners:
- name: http_listener
address:
socket_address:
address: 0.0.0.0
port_value: 80
filter_chains:
filters:
- name: envoy.filters.network.http_connection_manager
typed_config:
"@type": type.googleapis.com/envoy.extensions.filters.network.http_connection_manager.v3.HttpConnectionManager
use_remote_address: true
add_user_agent: true
access_log:
- name: envoy.access_loggers.file
typed_config:
"@type": type.googleapis.com/envoy.extensions.access_loggers.file.v3.FileAccessLog
path: "/logs/envoy/front-envoy-access.log"
log_format:
json_format: {"start": "[%START_TIME%] ", "method": "%REQ(:METHOD)%", "url": "%REQ(X-ENVOY-ORIGINAL-PATH?:PATH)%", "protocol": "%PROTOCOL%", "status": "%RESPONSE_CODE%", "respflags": "%RESPONSE_FLAGS%", "bytes-received": "%BYTES_RECEIVED%", "bytes-sent": "%BYTES_SENT%", "duration": "%DURATION%", "upstream-service-time": "%RESP(X-ENVOY-UPSTREAM-SERVICE-TIME)%", "x-forwarded-for": "%REQ(X-FORWARDED-FOR)%", "user-agent": "%REQ(USER-AGENT)%", "request-id": "%REQ(X-REQUEST-ID)%", "authority": "%REQ(:AUTHORITY)%", "upstream-host": "%UPSTREAM_HOST%", "remote-ip": "%DOWNSTREAM_REMOTE_ADDRESS_WITHOUT_PORT%"}
stat_prefix: ingress_80
codec_type: AUTO
generate_request_id: true
route_config:
name: local_route
virtual_hosts:
- name: http-route
domains:
- "*"
routes:
- match:
prefix: "/"
route:
cluster: service_a
http_filters:
- name: envoy.filters.http.router
clusters:
- name: statsd_exporter
connect_timeout: 0.25s
type: strict_dns
lb_policy: ROUND_ROBIN
load_assignment:
cluster_name: statsd_exporter
endpoints:
- lb_endpoints:
- endpoint:
address:
socket_address:
address: statsd_exporter
port_value: 9125
- name: service_a
connect_timeout: 0.25s
type: strict_dns
lb_policy: ROUND_ROBIN
load_assignment:
cluster_name: service_a
endpoints:
- lb_endpoints:
- endpoint:
address:
socket_address:
address: service_a_envoy
port_value: 8786
[root@k8s-master monitoring-and-accesslog]# cat grafana/dashboard.yaml
apiVersion: 1
providers:
- name: 'default'
orgId: 1
folder: ''
type: file
disableDeletion: false
editable: true
options:
path: /etc/grafana/provisioning/dashboards/
[root@k8s-master monitoring-and-accesslog]# cat grafana/dashboard.json
{
"__inputs": [],
"annotations": {
"list": []
},
"editable": true,
"gnetId": null,
"hideControls": false,
"id": null,
"links": [],
"refresh": "10s",
"rows": [
{
"collapse": false,
"editable": true,
"height": "250px",
"panels": [
{
"aliasColors": {},
"bars": false,
"datasource": "prometheus",
"description": null,
"editable": true,
"error": false,
"fill": 1,
"grid": {
"threshold1": null,
"threshold1Color": "rgba(216, 200, 27, 0.27)",
"threshold2": null,
"threshold2Color": "rgba(234, 112, 112, 0.22)"
},
"id": 1,
"isNew": true,
"legend": {
"alignAsTable": false,
"avg": false,
"current": false,
"hideEmpty": false,
"hideZero": false,
"max": false,
"min": false,
"rightSide": false,
"show": true,
"sideWidth": null,
"total": false,
"values": false
},
"lines": true,
"linewidth": 2,
"links": [],
"nullPointMode": "connected",
"percentage": false,
"pointradius": 5,
"points": false,
"renderer": "flot",
"seriesOverrides": [],
"span": 4,
"stack": false,
"steppedLine": false,
"targets": [
{
"expr": "[[source]]_cluster_[[destination]]_upstream_rq_2xx - [[source]]_cluster_[[destination]]_upstream_rq_2xx offset $__interval",
"format": "time_series",
"instant": false,
"interval": "",
"intervalFactor": 2,
"legendFormat": "2xx",
"metric": "",
"refId": "",
"step": 10
}
],
"timeFrom": null,
"timeShift": null,
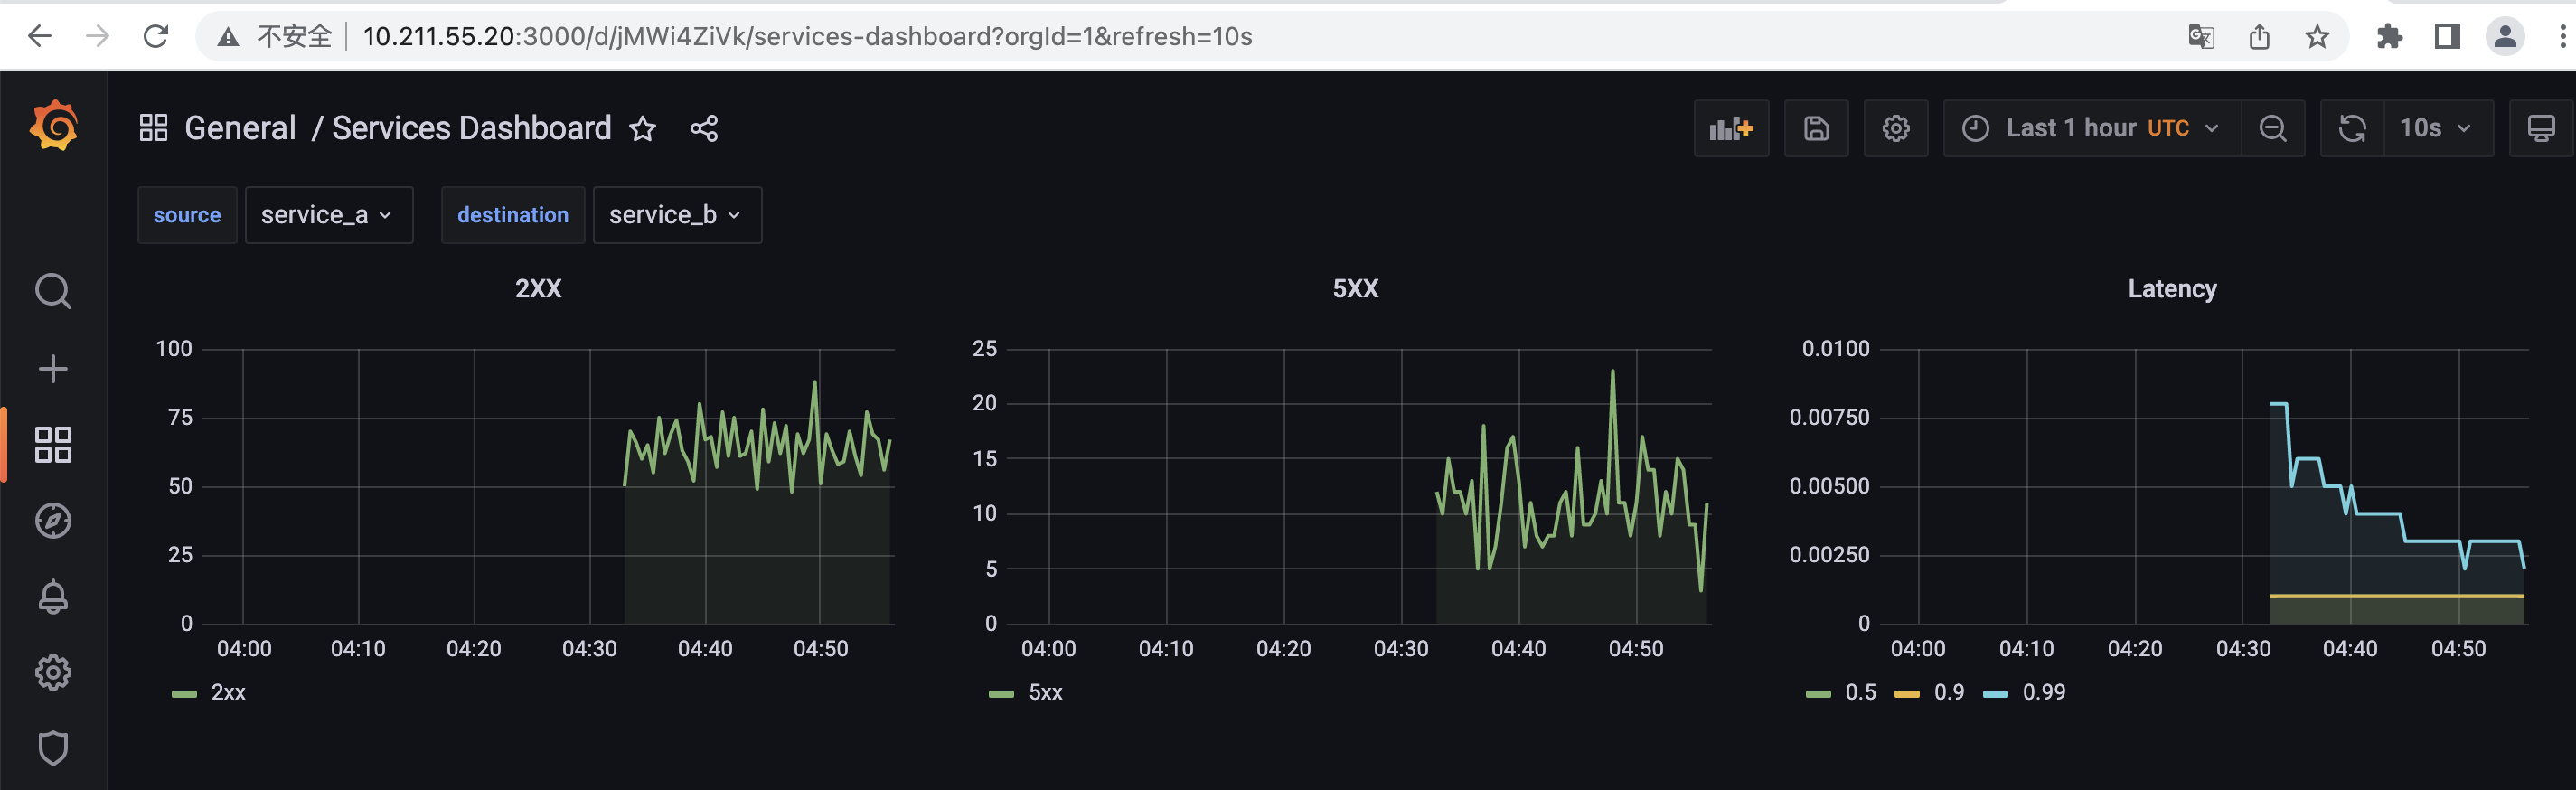
"title": "2XX",
"tooltip": {
"msResolution": true,
"shared": true,
"sort": 0,
"value_type": "cumulative"
},
"transparent": true,
"type": "graph",
"xaxis": {
"show": true
},
"yaxes": [
{
"decimals": null,
"format": "short",
"label": null,
"logBase": 1,
"max": null,
"min": 0,
"show": true
},
{
"decimals": null,
"format": "short",
"label": null,
"logBase": 1,
"max": null,
"min": 0,
"show": true
}
]
},
{
"aliasColors": {},
"bars": false,
"datasource": "prometheus",
"description": null,
"editable": true,
"error": false,
"fill": 1,
"grid": {
"threshold1": null,
"threshold1Color": "rgba(216, 200, 27, 0.27)",
"threshold2": null,
"threshold2Color": "rgba(234, 112, 112, 0.22)"
},
"id": 2,
"isNew": true,
"legend": {
"alignAsTable": false,
"avg": false,
"current": false,
"hideEmpty": false,
"hideZero": false,
"max": false,
"min": false,
"rightSide": false,
"show": true,
"sideWidth": null,
"total": false,
"values": false
},
"lines": true,
"linewidth": 2,
"links": [],
"nullPointMode": "connected",
"percentage": false,
"pointradius": 5,
"points": false,
"renderer": "flot",
"seriesOverrides": [],
"span": 4,
"stack": false,
"steppedLine": false,
"targets": [
{
"expr": "[[source]]_cluster_[[destination]]_upstream_rq_5xx - [[source]]_cluster_[[destination]]_upstream_rq_5xx offset $__interval",
"format": "time_series",
"instant": false,
"interval": "",
"intervalFactor": 2,
"legendFormat": "5xx",
"metric": "",
"refId": "",
"step": 10
}
],
"timeFrom": null,
"timeShift": null,
"title": "5XX",
"tooltip": {
"msResolution": true,
"shared": true,
"sort": 0,
"value_type": "cumulative"
},
"transparent": true,
"type": "graph",
"xaxis": {
"show": true
},
"yaxes": [
{
"decimals": null,
"format": "short",
"label": null,
"logBase": 1,
"max": null,
"min": 0,
"show": true
},
{
"decimals": null,
"format": "short",
"label": null,
"logBase": 1,
"max": null,
"min": 0,
"show": true
}
]
},
{
"aliasColors": {},
"bars": false,
"datasource": "prometheus",
"description": null,
"editable": true,
"error": false,
"fill": 1,
"grid": {
"threshold1": null,
"threshold1Color": "rgba(216, 200, 27, 0.27)",
"threshold2": null,
"threshold2Color": "rgba(234, 112, 112, 0.22)"
},
"id": 3,
"isNew": true,
"legend": {
"alignAsTable": false,
"avg": false,
"current": false,
"hideEmpty": false,
"hideZero": false,
"max": false,
"min": false,
"rightSide": false,
"show": true,
"sideWidth": null,
"total": false,
"values": false
},
"lines": true,
"linewidth": 2,
"links": [],
"nullPointMode": "connected",
"percentage": false,
"pointradius": 5,
"points": false,
"renderer": "flot",
"seriesOverrides": [],
"span": 4,
"stack": false,
"steppedLine": false,
"targets": [
{
"expr": "[[source]]_cluster_[[destination]]_upstream_rq_time",
"format": "time_series",
"instant": false,
"interval": "",
"intervalFactor": 2,
"legendFormat": "{{quantile}}",
"metric": "",
"refId": "",
"step": 10
}
],
"timeFrom": null,
"timeShift": null,
"title": "Latency",
"tooltip": {
"msResolution": true,
"shared": true,
"sort": 0,
"value_type": "cumulative"
},
"transparent": true,
"type": "graph",
"xaxis": {
"show": true
},
"yaxes": [
{
"decimals": null,
"format": "short",
"label": null,
"logBase": 1,
"max": null,
"min": 0,
"show": true
},
{
"decimals": null,
"format": "short",
"label": null,
"logBase": 1,
"max": null,
"min": 0,
"show": true
}
]
}
],
"repeat": null,
"showTitle": false,
"title": "New row"
}
],
"schemaVersion": 12,
"sharedCrosshair": false,
"style": "dark",
"tags": [],
"templating": {
"list": [
{
"allValue": null,
"current": {
"tags": [],
"text": "service_a",
"value": "service_a"
},
"datasource": "prometheus",
"hide": 0,
"includeAll": false,
"label": null,
"multi": false,
"name": "source",
"options": [],
"query": "metrics(.*_cluster_.*_upstream_rq_2xx)",
"refresh": 1,
"regex": "/(.*)_cluster_.*_upstream_rq_2xx/",
"sort": 1,
"tagValuesQuery": null,
"tagsQuery": null,
"type": "query",
"useTags": false
},
{
"allValue": null,
"current": {
"tags": [],
"text": "service_b",
"value": "service_b"
},
"datasource": "prometheus",
"hide": 0,
"includeAll": false,
"label": null,
"multi": false,
"name": "destination",
"options": [],
"query": "metrics(.*_cluster_.*_upstream_rq_2xx)",
"refresh": 1,
"regex": "/.*_cluster_(.*)_upstream_rq_2xx/",
"sort": 1,
"tagValuesQuery": null,
"tagsQuery": null,
"type": "query",
"useTags": false
}
]
},
"time": {
"from": "now-1h",
"to": "now"
},
"timepicker": {
"refresh_intervals": [
"5s",
"10s",
"30s",
"1m",
"5m",
"15m",
"30m",
"1h",
"2h",
"1d"
],
"time_options": [
"5m",
"15m",
"1h",
"6h",
"12h",
"24h",
"2d",
"7d",
"30d"
]
},
"timezone": "utc",
"title": "Services Dashboard",
"version": 0
}
[root@k8s-master monitoring-and-accesslog]# cat grafana/datasource.yaml
apiVersion: 1
datasources:
- name: prometheus
type: prometheus
access: proxy
url: http://prometheus:9090
editable: true
isDefault:
[root@k8s-master monitoring-and-accesslog]# cat grafana/grafana.ini
instance_name = "grafana"
[security]
admin_user = admin
admin_password = admin
[root@k8s-master monitoring-and-accesslog]# cat grafana/service-dashboard.py
from grafanalib.core import *
import os
dashboard = Dashboard(
title="Services Dashboard",
templating=Templating(
[
Template(
name="source",
dataSource="prometheus",
query="metrics(.*_cluster_.*_upstream_rq_2xx)",
regex="/(.*)_cluster_.*_upstream_rq_2xx/",
default="service_a"
),
Template(
name="destination",
dataSource="prometheus",
query="metrics(.*_cluster_.*_upstream_rq_2xx)",
regex="/.*_cluster_(.*)_upstream_rq_2xx/",
default="service_b"
)
]
),
rows=[
Row(
panels=[
Graph(
title="2XX",
transparent=True,
dataSource="prometheus",
targets=[
Target(
expr="[[source]]_cluster_[[destination]]_upstream_rq_2xx - [[source]]_cluster_[[destination]]_upstream_rq_2xx offset $__interval",
legendFormat="2xx"
)
]
),
Graph(
title="5XX",
transparent=True,
dataSource="prometheus",
targets=[
Target(
expr="[[source]]_cluster_[[destination]]_upstream_rq_5xx - [[source]]_cluster_[[destination]]_upstream_rq_5xx offset $__interval",
legendFormat="5xx"
),
]
),
Graph(
title="Latency",
transparent=True,
dataSource="prometheus",
targets=[
Target(
expr="[[source]]_cluster_[[destination]]_upstream_rq_time",
legendFormat="{{quantile}}"
)
]
)
]
),
]
).auto_panel_ids()
[root@k8s-master monitoring-and-accesslog]# cat prometheus/config.yaml
global:
scrape_interval: 15s
scrape_configs:
- job_name: 'statsd'
scrape_interval: 5s
static_configs:
- targets: ['statsd_exporter:9102']
labels:
group: 'services'
[root@k8s-master monitoring-and-accesslog]# cat service_a/Dockerfile
FROM golang:alpine
COPY main.go main.go
CMD go run main.go
[root@k8s-master monitoring-and-accesslog]# cat service_a/envoy-config.yaml
node:
id: service-a
cluster: mycluster
admin:
profile_path: /tmp/envoy.prof
access_log_path: /tmp/admin_access.log
address:
socket_address:
address: 0.0.0.0
port_value: 9901
layered_runtime:
layers:
- name: admin
admin_layer: {}
stats_sinks:
- name: envoy.statsd
typed_config:
"@type": type.googleapis.com/envoy.config.metrics.v3.StatsdSink
tcp_cluster_name: statsd_exporter
prefix: service-a
static_resources:
listeners:
- name: service-a-svc-http-listener
address:
socket_address:
address: 0.0.0.0
port_value: 8786
filter_chains:
- filters:
- name: envoy.filters.network.http_connection_manager
typed_config:
"@type": type.googleapis.com/envoy.extensions.filters.network.http_connection_manager.v3.HttpConnectionManager
stat_prefix: ingress_http
access_log:
- name: envoy.access_loggers.file
typed_config:
"@type": type.googleapis.com/envoy.extensions.access_loggers.file.v3.FileAccessLog
path: "/logs/envoy/service_a-envoy-access.log"
log_format:
json_format: {"start": "[%START_TIME%] ", "method": "%REQ(:METHOD)%", "url": "%REQ(X-ENVOY-ORIGINAL-PATH?:PATH)%", "protocol": "%PROTOCOL%", "status": "%RESPONSE_CODE%", "respflags": "%RESPONSE_FLAGS%", "bytes-received": "%BYTES_RECEIVED%", "bytes-sent": "%BYTES_SENT%", "duration": "%DURATION%", "upstream-service-time": "%RESP(X-ENVOY-UPSTREAM-SERVICE-TIME)%", "x-forwarded-for": "%REQ(X-FORWARDED-FOR)%", "user-agent": "%REQ(USER-AGENT)%", "request-id": "%REQ(X-REQUEST-ID)%", "authority": "%REQ(:AUTHORITY)%", "upstream-host": "%UPSTREAM_HOST%", "remote-ip": "%DOWNSTREAM_REMOTE_ADDRESS_WITHOUT_PORT%"}
codec_type: AUTO
route_config:
name: service-a-svc-http-route
virtual_hosts:
- name: service-a-svc-http-route
domains:
- "*"
routes:
- match:
prefix: "/"
route:
cluster: service_a
http_filters:
- name: envoy.filters.http.router
- name: service-b-svc-http-listener
address:
socket_address:
address: 0.0.0.0
port_value: 8788
filter_chains:
- filters:
- name: envoy.filters.network.http_connection_manager
typed_config:
"@type": type.googleapis.com/envoy.extensions.filters.network.http_connection_manager.v3.HttpConnectionManager
stat_prefix: ingress_http
codec_type: AUTO
route_config:
name: service-b-svc-http-route
virtual_hosts:
- name: service-b-svc-http-route
domains:
- "*"
routes:
- match:
prefix: "/"
route:
cluster: service_b
http_filters:
- name: envoy.filters.http.router
- name: service-c-svc-http-listener
address:
socket_address:
address: 0.0.0.0
port_value: 8791
filter_chains:
- filters:
- name: envoy.filters.network.http_connection_manager
typed_config:
"@type": type.googleapis.com/envoy.extensions.filters.network.http_connection_manager.v3.HttpConnectionManager
stat_prefix: ingress_http
codec_type: AUTO
route_config:
name: service-c-svc-http-route
virtual_hosts:
- name: service-c-svc-http-route
domains:
- "*"
routes:
- match:
prefix: "/"
route:
cluster: service_c
http_filters:
- name: envoy.filters.http.router
clusters:
- name: statsd_exporter
connect_timeout: 0.25s
type: strict_dns
lb_policy: ROUND_ROBIN
load_assignment:
cluster_name: statsd_exporter
endpoints:
- lb_endpoints:
- endpoint:
address:
socket_address:
address: statsd_exporter
port_value: 9125
- name: service_a
connect_timeout: 0.25s
type: strict_dns
lb_policy: ROUND_ROBIN
load_assignment:
cluster_name: service_a
endpoints:
- lb_endpoints:
- endpoint:
address:
socket_address:
address: service_a
port_value: 8081
- name: service_b
connect_timeout: 0.25s
type: strict_dns
lb_policy: ROUND_ROBIN
load_assignment:
cluster_name: service_b
endpoints:
- lb_endpoints:
- endpoint:
address:
socket_address:
address: service_b_envoy
port_value: 8789
- name: service_c
connect_timeout: 0.25s
type: strict_dns
lb_policy: ROUND_ROBIN
load_assignment:
cluster_name: service_c
endpoints:
- lb_endpoints:
- endpoint:
address:
socket_address:
address: service_c_envoy
port_value: 8790
[root@k8s-master monitoring-and-accesslog]# cat service_a/main.go
package main
import (
"fmt"
"io/ioutil"
"log"
"net/http"
)
func handler(w http.ResponseWriter, r *http.Request) {
fmt.Fprintf(w, "Calling Service B: ")
req, err := http.NewRequest("GET", "http://service_a_envoy:8788/", nil)
if err != nil {
fmt.Printf("%s", err)
}
req.Header.Add("x-request-id", r.Header.Get("x-request-id"))
req.Header.Add("x-b3-traceid", r.Header.Get("x-b3-traceid"))
req.Header.Add("x-b3-spanid", r.Header.Get("x-b3-spanid"))
req.Header.Add("x-b3-parentspanid", r.Header.Get("x-b3-parentspanid"))
req.Header.Add("x-b3-sampled", r.Header.Get("x-b3-sampled"))
req.Header.Add("x-b3-flags", r.Header.Get("x-b3-flags"))
req.Header.Add("x-ot-span-context", r.Header.Get("x-ot-span-context"))
client := &http.Client{}
resp, err := client.Do(req)
if err != nil {
fmt.Printf("%s", err)
}
defer resp.Body.Close()
body, err := ioutil.ReadAll(resp.Body)
if err != nil {
fmt.Printf("%s", err)
}
fmt.Fprintf(w, string(body))
fmt.Fprintf(w, "Hello from service A.\n")
req, err = http.NewRequest("GET", "http://service_a_envoy:8791/", nil)
if err != nil {
fmt.Printf("%s", err)
}
req.Header.Add("x-request-id", r.Header.Get("x-request-id"))
req.Header.Add("x-b3-traceid", r.Header.Get("x-b3-traceid"))
req.Header.Add("x-b3-spanid", r.Header.Get("x-b3-spanid"))
req.Header.Add("x-b3-parentspanid", r.Header.Get("x-b3-parentspanid"))
req.Header.Add("x-b3-sampled", r.Header.Get("x-b3-sampled"))
req.Header.Add("x-b3-flags", r.Header.Get("x-b3-flags"))
req.Header.Add("x-ot-span-context", r.Header.Get("x-ot-span-context"))
client = &http.Client{}
resp, err = client.Do(req)
if err != nil {
fmt.Printf("%s", err)
}
defer resp.Body.Close()
body, err = ioutil.ReadAll(resp.Body)
if err != nil {
fmt.Printf("%s", err)
}
fmt.Fprintf(w, string(body))
}
func main() {
http.HandleFunc("/", handler)
log.Fatal(http.ListenAndServe(":8081", nil))
}
[root@k8s-master monitoring-and-accesslog]# cat service_b/Dockerfile
FROM golang:alpine
COPY main.go main.go
CMD go run main.go
[root@k8s-master monitoring-and-accesslog]# cat service_b/envoy-config.yaml
node:
id: service-b
cluster: mycluster
admin:
profile_path: /tmp/envoy.prof
access_log_path: /tmp/admin_access.log
address:
socket_address:
address: 0.0.0.0
port_value: 9901
layered_runtime:
layers:
- name: admin
admin_layer: {}
stats_sinks:
- name: envoy.statsd
typed_config:
"@type": type.googleapis.com/envoy.config.metrics.v3.StatsdSink
tcp_cluster_name: statsd_exporter
prefix: service-b
static_resources:
listeners:
- name: service-b-svc-http-listener
address:
socket_address:
address: 0.0.0.0
port_value: 8789
filter_chains:
- filters:
- name: envoy.filters.network.http_connection_manager
typed_config:
"@type": type.googleapis.com/envoy.extensions.filters.network.http_connection_manager.v3.HttpConnectionManager
stat_prefix: ingress_http
codec_type: AUTO
access_log:
- name: envoy.access_loggers.file
typed_config:
"@type": type.googleapis.com/envoy.extensions.access_loggers.file.v3.FileAccessLog
path: "/logs/envoy/service_b-envoy-access.log"
log_format:
json_format: {"start": "[%START_TIME%] ", "method": "%REQ(:METHOD)%", "url": "%REQ(X-ENVOY-ORIGINAL-PATH?:PATH)%", "protocol": "%PROTOCOL%", "status": "%RESPONSE_CODE%", "respflags": "%RESPONSE_FLAGS%", "bytes-received": "%BYTES_RECEIVED%", "bytes-sent": "%BYTES_SENT%", "duration": "%DURATION%", "upstream-service-time": "%RESP(X-ENVOY-UPSTREAM-SERVICE-TIME)%", "x-forwarded-for": "%REQ(X-FORWARDED-FOR)%", "user-agent": "%REQ(USER-AGENT)%", "request-id": "%REQ(X-REQUEST-ID)%", "authority": "%REQ(:AUTHORITY)%", "upstream-host": "%UPSTREAM_HOST%", "remote-ip": "%DOWNSTREAM_REMOTE_ADDRESS_WITHOUT_PORT%"}
route_config:
name: service-b-svc-http-route
virtual_hosts:
- name: service-b-svc-http-route
domains:
- "*"
routes:
- match:
prefix: "/"
route:
cluster: service_b
http_filters:
- name: envoy.filters.http.fault
typed_config:
"@type": type.googleapis.com/envoy.extensions.filters.http.fault.v3.HTTPFault
max_active_faults: 100
abort:
http_status: 503
percentage:
numerator: 15
denominator: HUNDRED
- name: envoy.filters.http.router
typed_config: {}
clusters:
- name: statsd_exporter
connect_timeout: 0.25s
type: strict_dns
lb_policy: ROUND_ROBIN
load_assignment:
cluster_name: statsd_exporter
endpoints:
- lb_endpoints:
- endpoint:
address:
socket_address:
address: statsd_exporter
port_value: 9125
- name: service_b
connect_timeout: 0.25s
type: strict_dns
lb_policy: ROUND_ROBIN
load_assignment:
cluster_name: service_b
endpoints:
- lb_endpoints:
- endpoint:
address:
socket_address:
address: service_b
port_value: 8082
[root@k8s-master monitoring-and-accesslog]# cat service_b/main.go
package main
import (
"fmt"
"log"
"net/http"
)
func handler(w http.ResponseWriter, r *http.Request) {
fmt.Fprintf(w, "Hello from service B.\n")
}
func main() {
http.HandleFunc("/", handler)
log.Fatal(http.ListenAndServe(":8082", nil))
}
[root@k8s-master monitoring-and-accesslog]# cat service_c/Dockerfile
FROM golang:alpine
COPY main.go main.go
CMD go run main.go
[root@k8s-master monitoring-and-accesslog]# cat service_c/envoy-config.yaml
node:
id: service-c
cluster: mycluster
admin:
profile_path: /tmp/envoy.prof
access_log_path: /tmp/admin_access.log
address:
socket_address:
address: 0.0.0.0
port_value: 9901
layered_runtime:
layers:
- name: admin
admin_layer: {}
stats_sinks:
- name: envoy.statsd
typed_config:
"@type": type.googleapis.com/envoy.config.metrics.v3.StatsdSink
tcp_cluster_name: statsd_exporter
prefix: service-c
static_resources:
listeners:
- name: service-c-svc-http-listener
address:
socket_address:
address: 0.0.0.0
port_value: 8790
filter_chains:
- filters:
- name: envoy.filters.network.http_connection_manager
typed_config:
"@type": type.googleapis.com/envoy.extensions.filters.network.http_connection_manager.v3.HttpConnectionManager
stat_prefix: ingress_http
codec_type: AUTO
access_log:
- name: envoy.access_loggers.file
typed_config:
"@type": type.googleapis.com/envoy.extensions.access_loggers.file.v3.FileAccessLog
path: "/logs/envoy/service_c-envoy-access.log"
log_format:
json_format: {"start": "[%START_TIME%] ", "method": "%REQ(:METHOD)%", "url": "%REQ(X-ENVOY-ORIGINAL-PATH?:PATH)%", "protocol": "%PROTOCOL%", "status": "%RESPONSE_CODE%", "respflags": "%RESPONSE_FLAGS%", "bytes-received": "%BYTES_RECEIVED%", "bytes-sent": "%BYTES_SENT%", "duration": "%DURATION%", "upstream-service-time": "%RESP(X-ENVOY-UPSTREAM-SERVICE-TIME)%", "x-forwarded-for": "%REQ(X-FORWARDED-FOR)%", "user-agent": "%REQ(USER-AGENT)%", "request-id": "%REQ(X-REQUEST-ID)%", "authority": "%REQ(:AUTHORITY)%", "upstream-host": "%UPSTREAM_HOST%", "remote-ip": "%DOWNSTREAM_REMOTE_ADDRESS_WITHOUT_PORT%"}
stat_prefix: ingress
codec_type: AUTO
route_config:
name: service-c-svc-http-route
virtual_hosts:
- name: service-c-svc-http-route
domains:
- "*"
routes:
- match:
prefix: "/"
route:
cluster: service_c
http_filters:
- name: envoy.filters.http.fault
typed_config:
"@type": type.googleapis.com/envoy.extensions.filters.http.fault.v3.HTTPFault
max_active_faults: 100
delay:
fixed_delay: 1s
percentage:
numerator: 10
denominator: HUNDRED
- name: envoy.filters.http.router
typed_config: {}
clusters:
- name: statsd_exporter
connect_timeout: 0.25s
type: strict_dns
lb_policy: ROUND_ROBIN
load_assignment:
cluster_name: statsd_exporter
endpoints:
- lb_endpoints:
- endpoint:
address:
socket_address:
address: statsd_exporter
port_value: 9125
- name: service_c
connect_timeout: 0.25s
type: strict_dns
lb_policy: ROUND_ROBIN
load_assignment:
cluster_name: service_c
endpoints:
- lb_endpoints:
- endpoint:
address:
socket_address:
address: service_c
port_value: 8083
[root@k8s-master monitoring-and-accesslog]# cat service_c/main.go
package main
import (
"fmt"
"log"
"net/http"
)
func handler(w http.ResponseWriter, r *http.Request) {
fmt.Fprintf(w, "Hello from service C.\n")
}
func main() {
http.HandleFunc("/", handler)
log.Fatal(http.ListenAndServe(":8083", nil))
}访问测试
向Front-Envoy发起请求,下面的命令模拟间隔1秒之内的随机时长进行请求;
while true; do curl 172.31.79.10; sleep 0.$RANDOM; done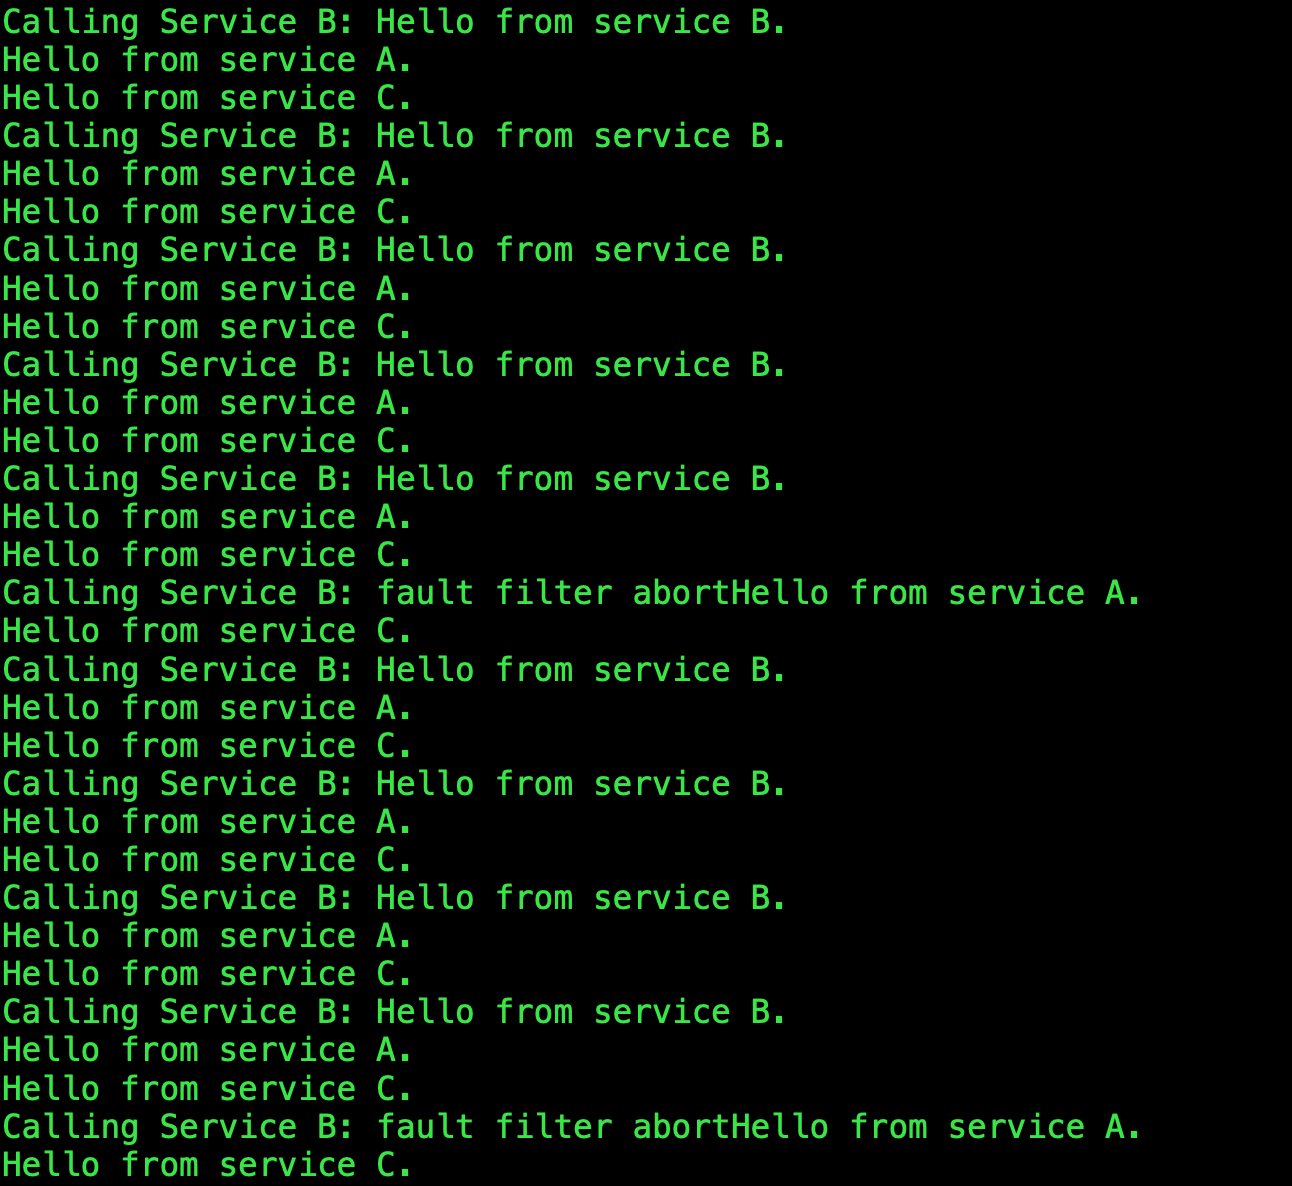
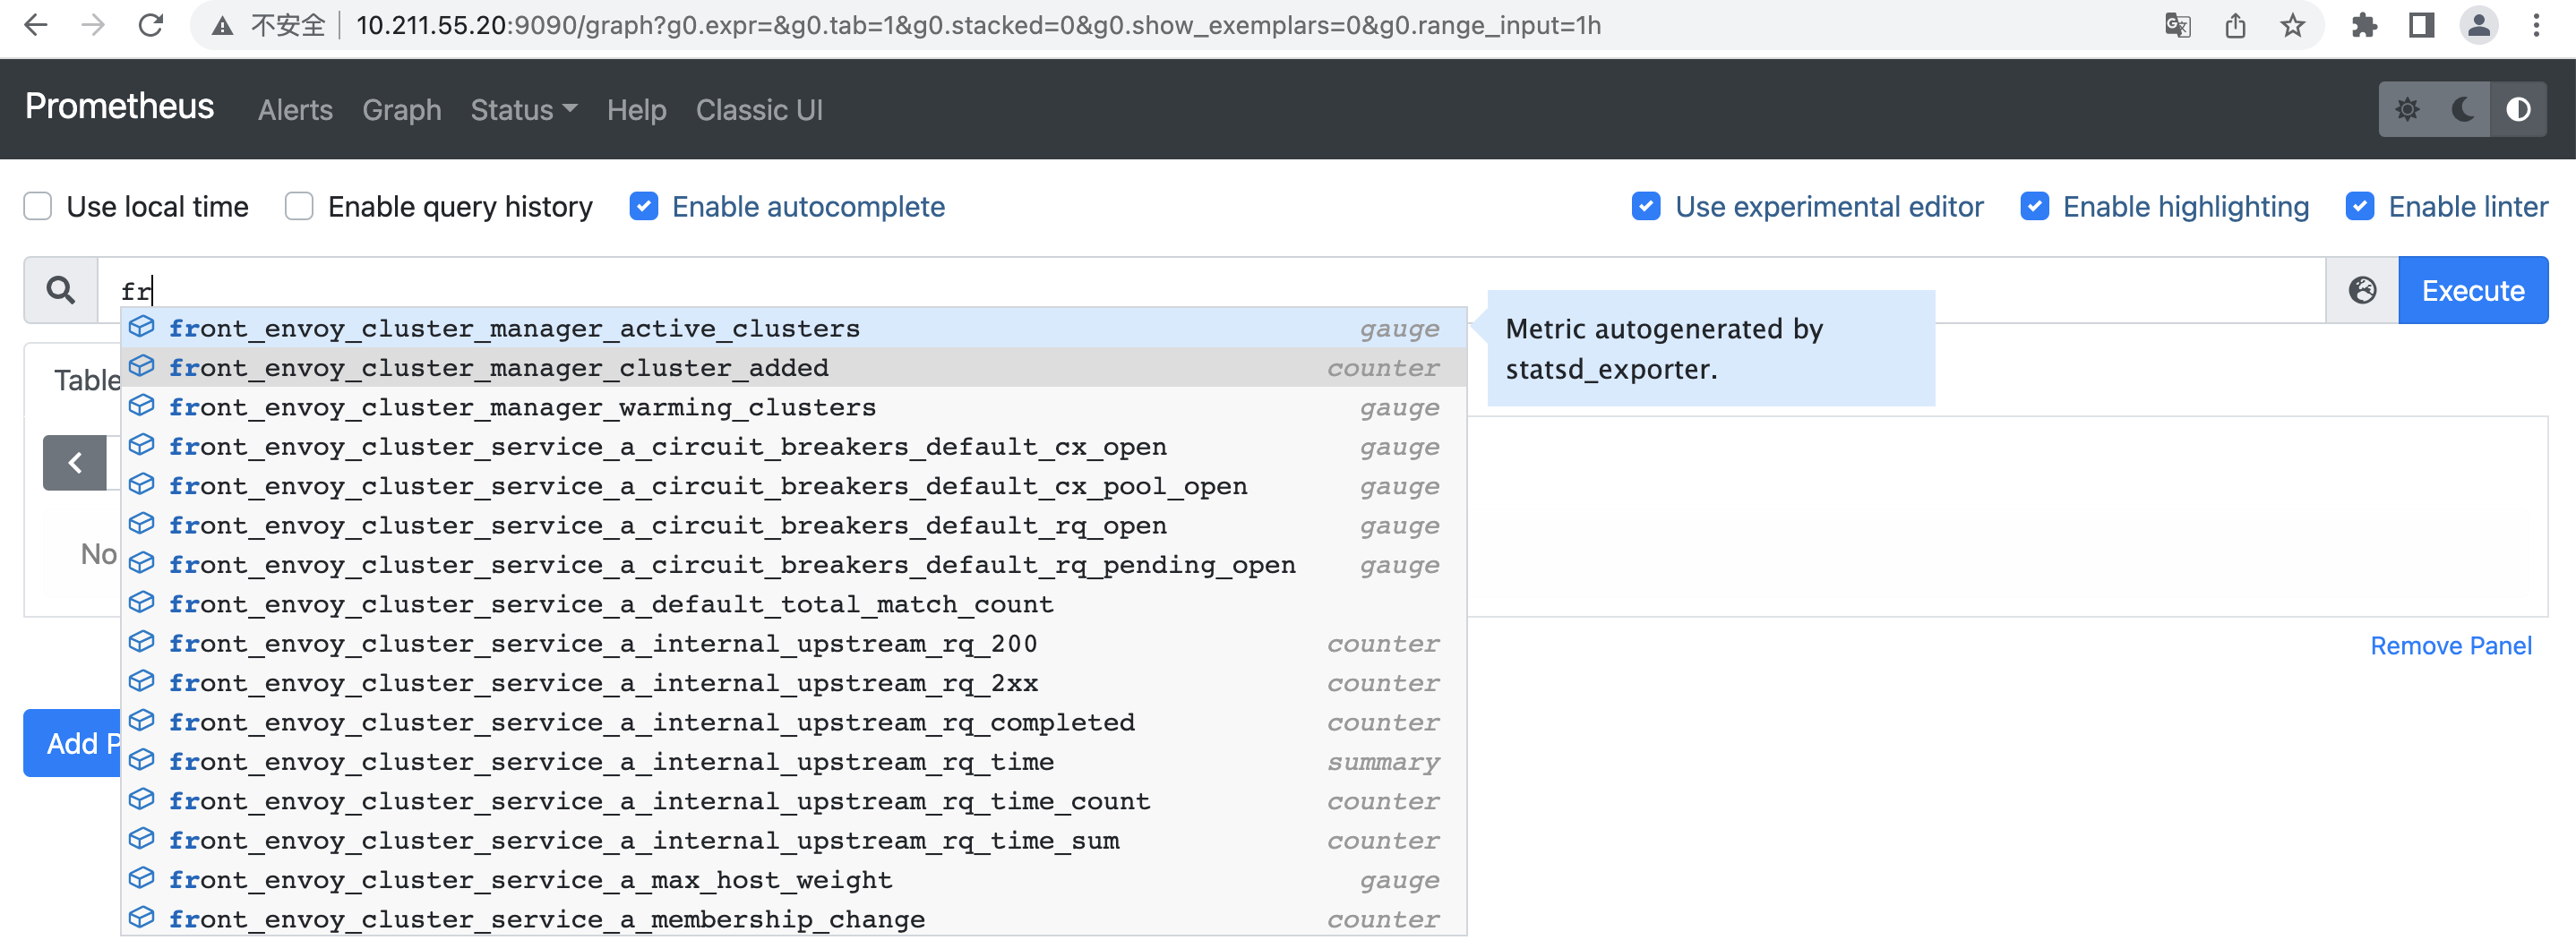
查看Prometheus
查看grafana
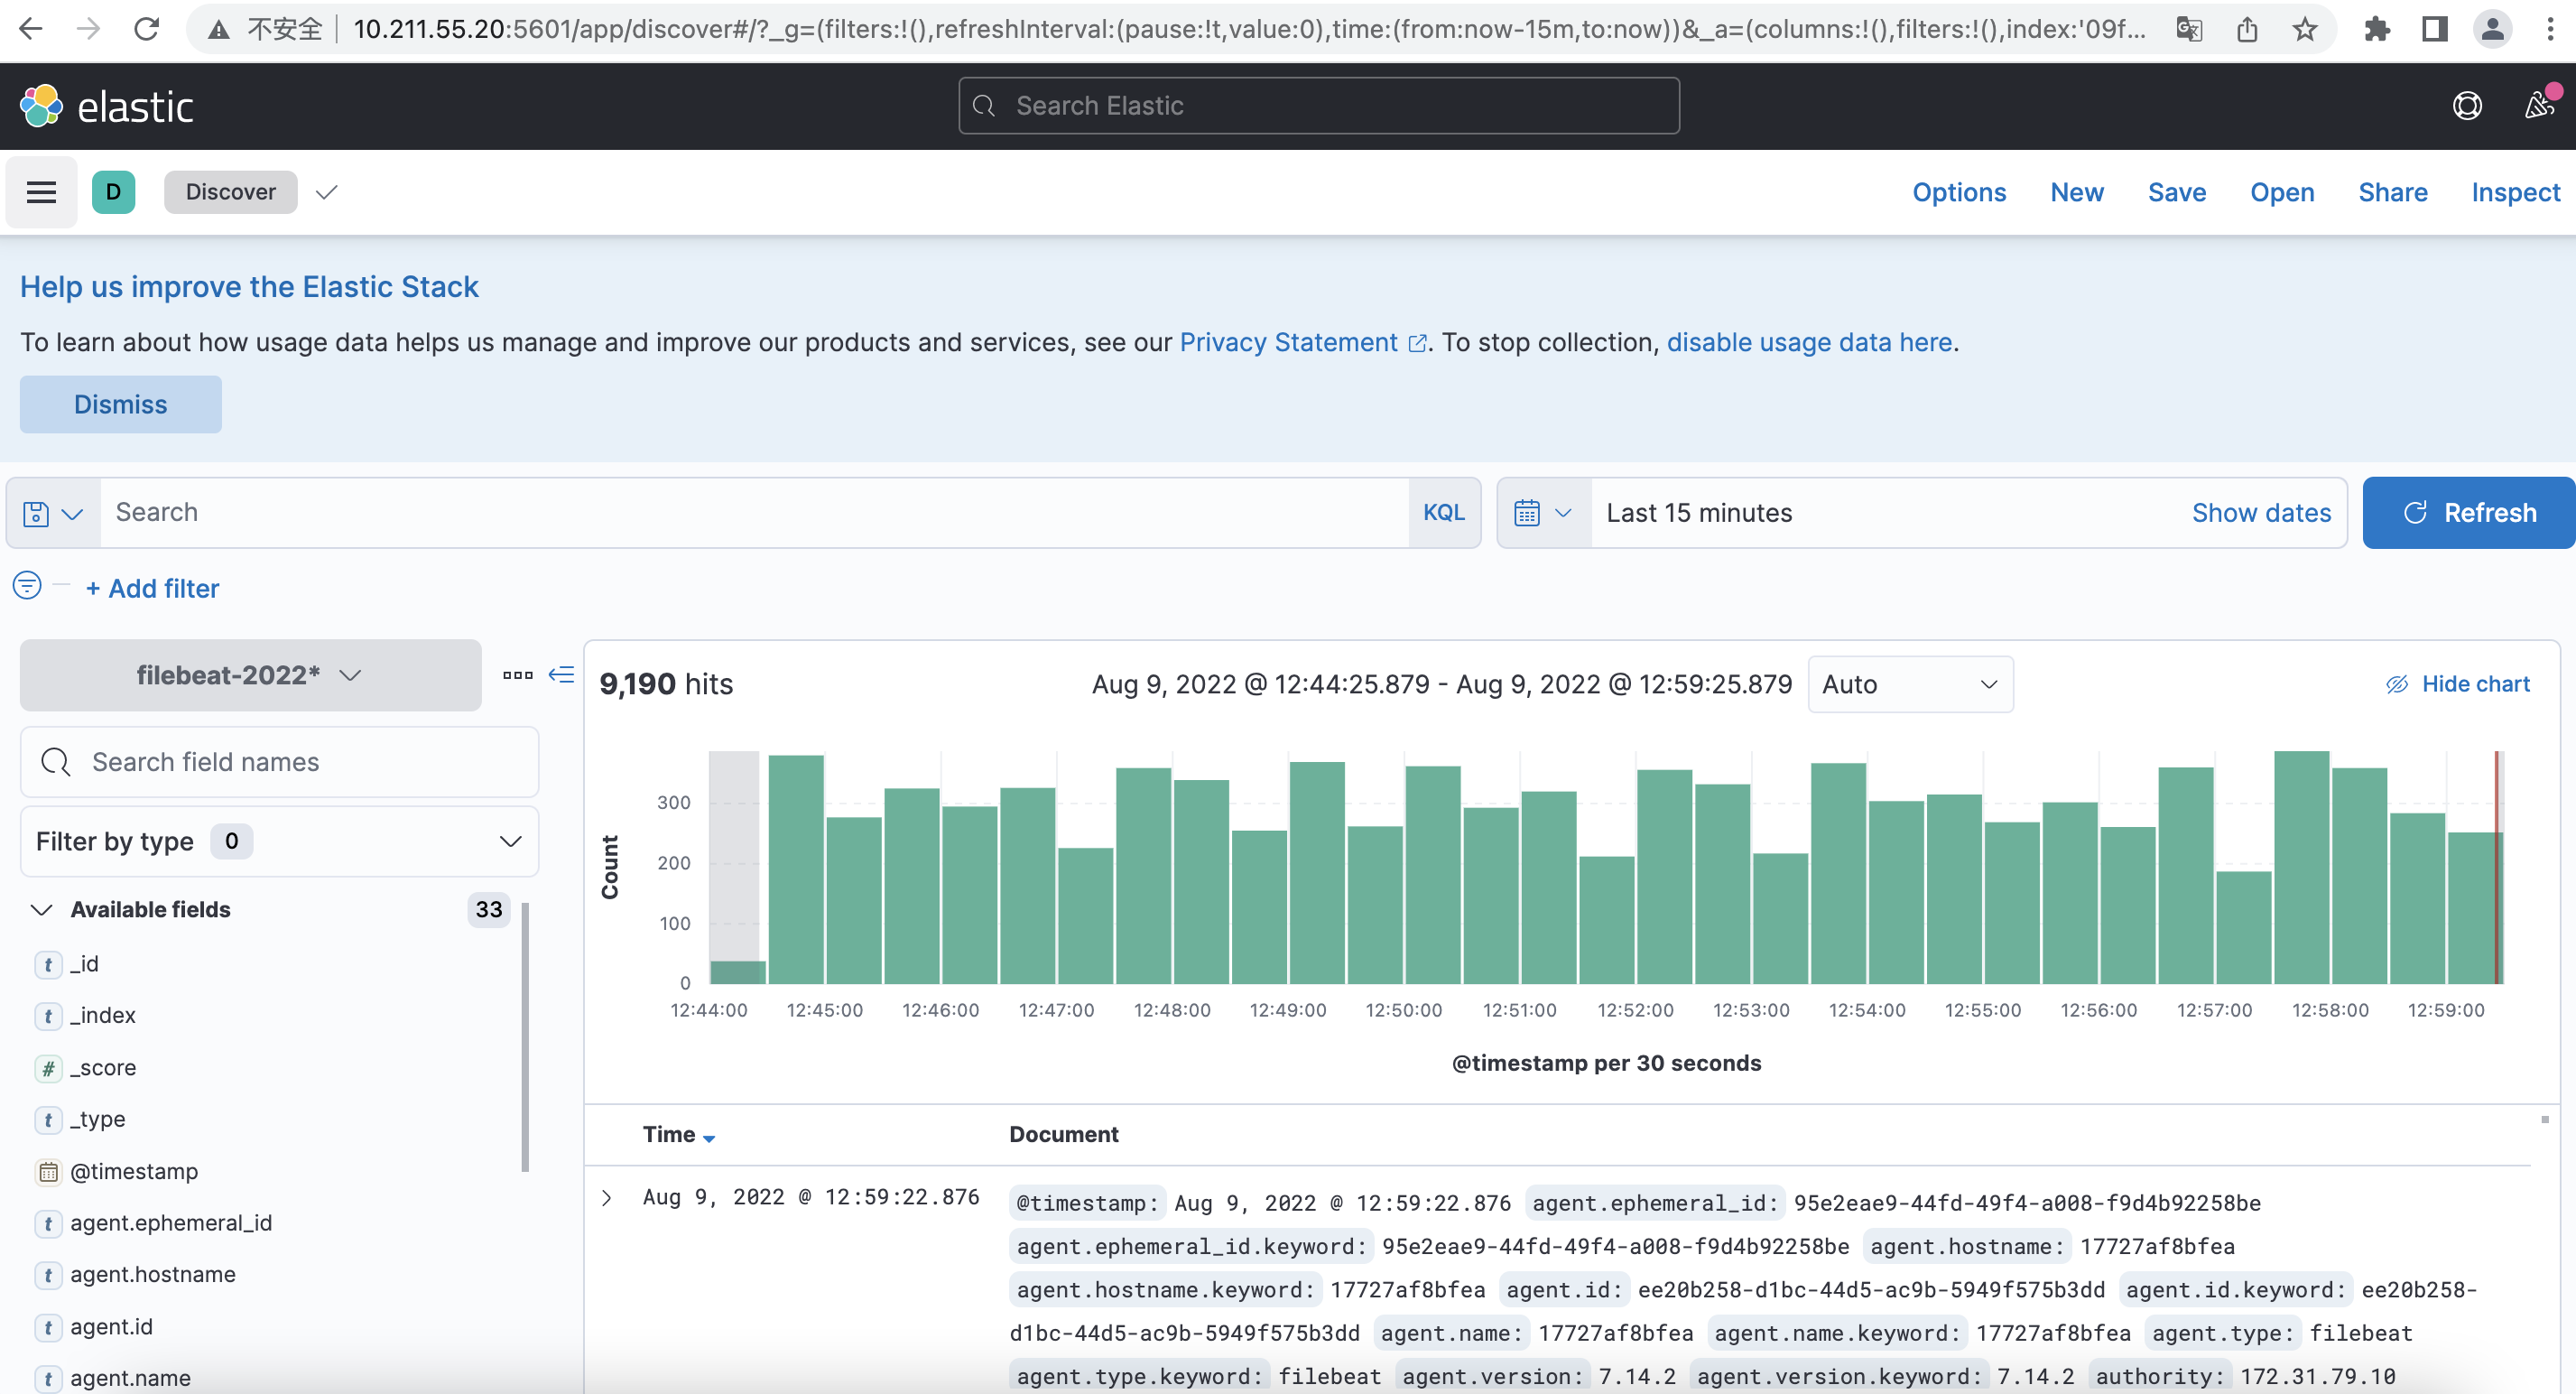
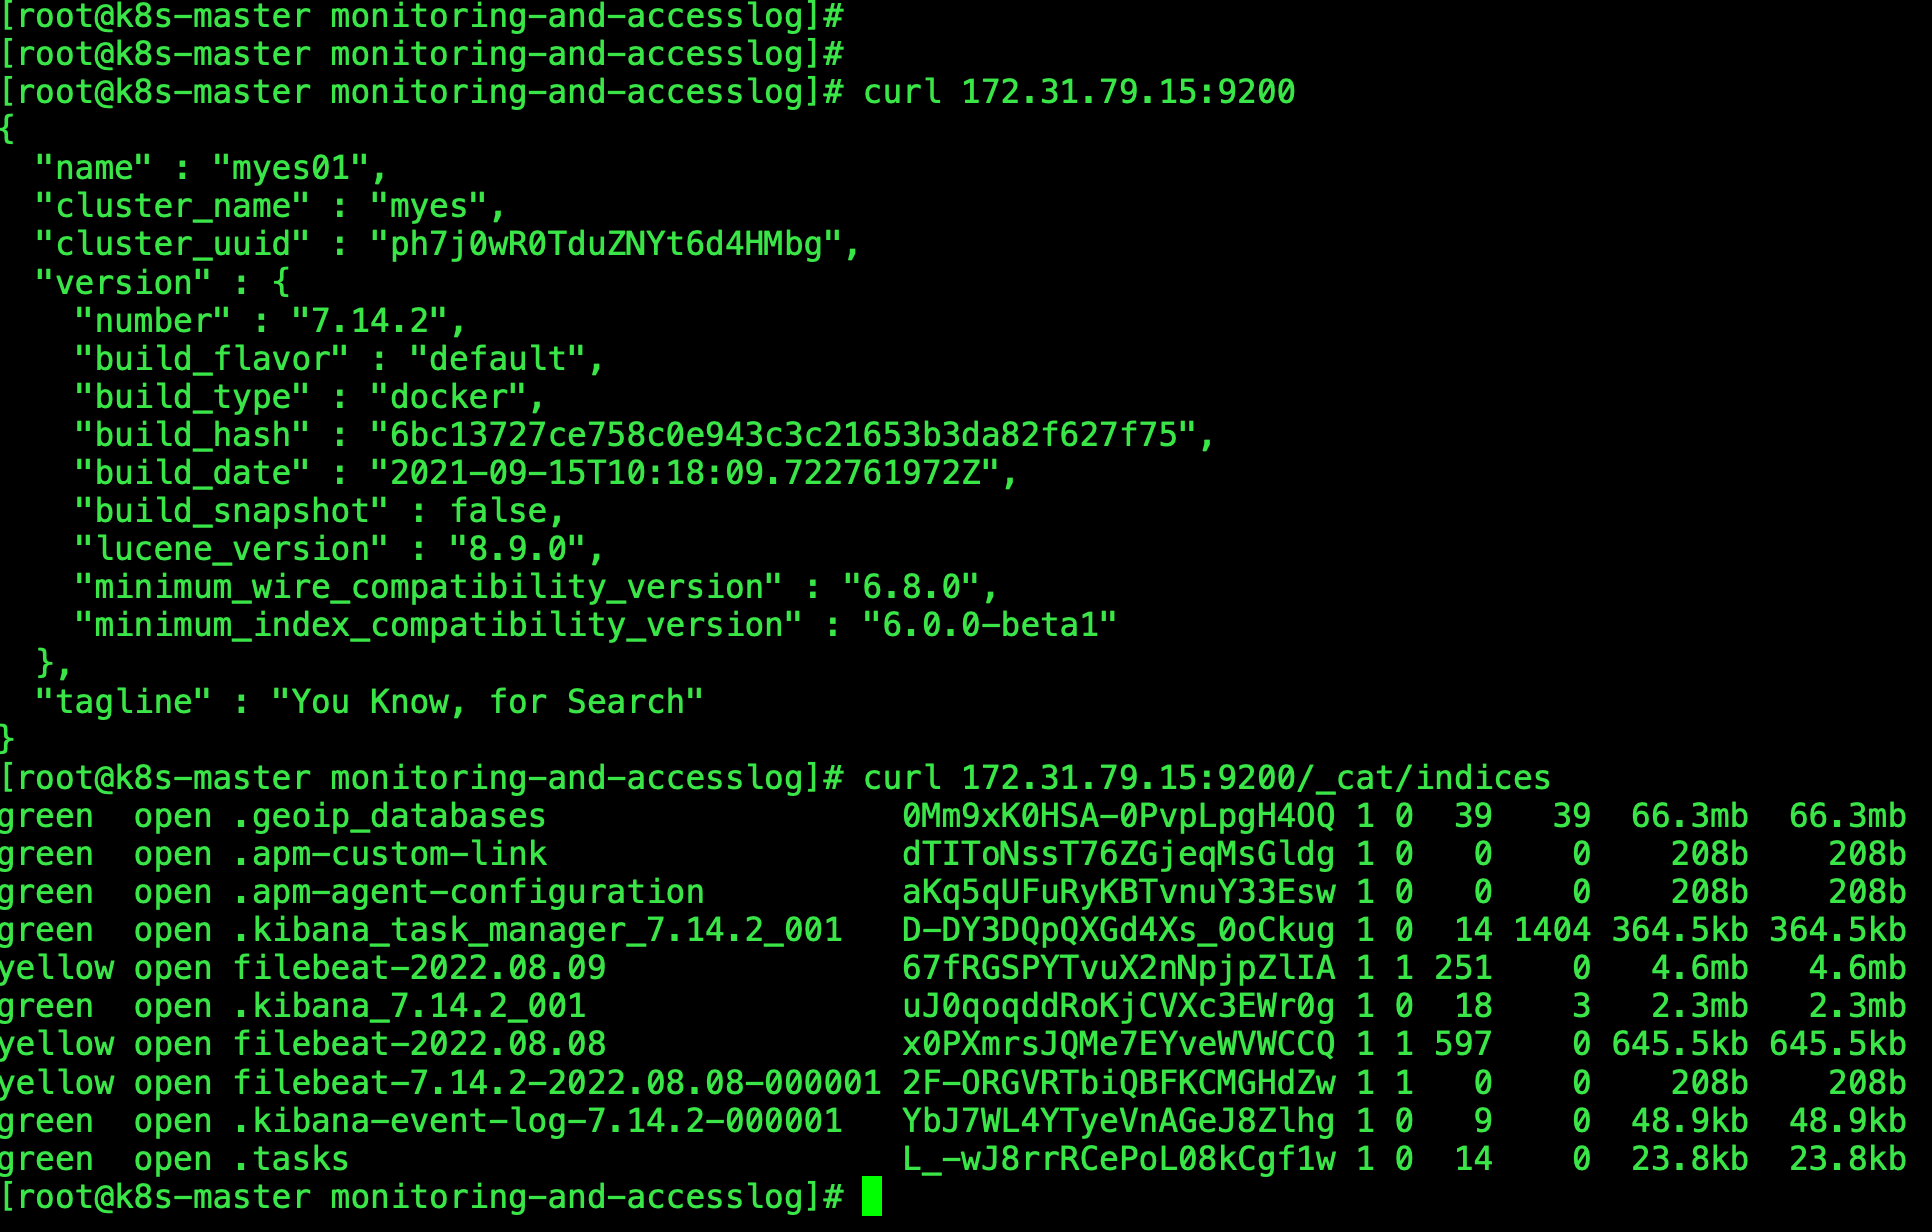
确认ElasticSearch服务正常工作,且Filebeat已经输出日志信息到指定的索引中
访问KIbana查看日志