数据样本不平衡时处理方法(Resampling strategies for imbalanced datasets)
文章目录(Table of Contents)
简介
这一部分讲一下样本平衡的一些做法。所有内容来自下面的链接。
下面这个参考资料很好,十分建议查看 : Resampling strategies for imbalanced datasets
为什么要做样本平衡
如果正负样本差别很大,或是类别与类别之间相差很大,那么模型就会偏向于预测最常出现的样本。同时,这样做最后可以获得较高的准确率,但是这个准确率不能说明模型有多好。
In a dataset with highly unbalanced classes, if the classifier always "predicts" the most common class without performing any analysis of the features, it will still have a high accuracy rate, obviously illusory.
解决办法
解决样本不平衡的问题,有两个大的方向是可以解决的。一个是under-sampling,另一个是over-sampling。(A widely adopted technique for dealing with highly unbalanced datasets is called resampling. It consists of removing samples from the majority class (under-sampling) and / or adding more examples from the minority class (over-sampling).)
Under-sampling
under-sampling我们可以理解为将较多的分类中的样本中取一些出来,使得较多的分类的数量与较少分类的数量相同。(这里采样的方式会有很多)
Over-sampling
所谓over-sampling,我们可以理解为将少的一部分样本进行重采样,使其变多。(这里重采样的方式会有很多)
下面这张图片概括了under-sampling和over-sampling两者区别。

当然,使用上面两种方式是会有代价的,如果使用undersampling,会出现丢失信息的问题。如果使用oversampling的方式,会出现过拟合的问题。
Despite the advantage of balancing classes, these techniques also have their weaknesses (there is no free lunch). The simplest implementation of over-sampling is to duplicate random records from the minority class, which can cause overfitting. In under-sampling, the simplest technique involves removing random records from the majority class, which can cause loss of information.
简单实验
下面我们使用NSL-KDD数据集来做一下简单的实验。我们在这里只实现简单的over-sampling和under-sampling,关于一些别的采样方式可以参考上面的链接,我在这里再放一下。
- 十分好的参考资料 : Resampling strategies for imbalanced datasets
- 简单原理介绍 : imbalanced-learn
数据集准备
- import pandas as pd
- import numpy as np
- import matplotlib.pyplot as plt
下面导入数据集
- COL_NAMES = ["duration", "protocol_type", "service", "flag", "src_bytes",
- "dst_bytes", "land", "wrong_fragment", "urgent", "hot", "num_failed_logins",
- "logged_in", "num_compromised", "root_shell", "su_attempted", "num_root",
- "num_file_creations", "num_shells", "num_access_files", "num_outbound_cmds",
- "is_host_login", "is_guest_login", "count", "srv_count", "serror_rate",
- "srv_serror_rate", "rerror_rate", "srv_rerror_rate", "same_srv_rate",
- "diff_srv_rate", "srv_diff_host_rate", "dst_host_count", "dst_host_srv_count",
- "dst_host_same_srv_rate", "dst_host_diff_srv_rate", "dst_host_same_src_port_rate",
- "dst_host_srv_diff_host_rate", "dst_host_serror_rate", "dst_host_srv_serror_rate",
- "dst_host_rerror_rate", "dst_host_srv_rerror_rate", "labels"]
- # 导入数据集
- Trainfilepath = './NSL-KDD/KDDTrain+.txt'
- dfDataTrain = pd.read_csv(Trainfilepath, names=COL_NAMES, index_col=False)
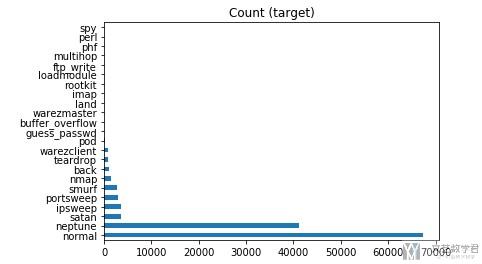
我们简单查看一下各类攻击的分布。
- target_count = dfDataTrain.labels.value_counts()
- target_count.plot(kind='barh', title='Count (target)');

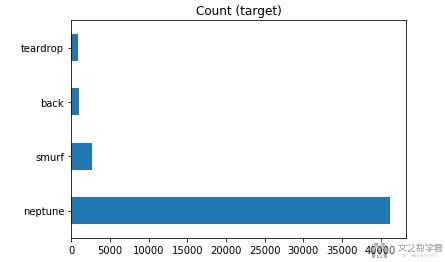
在这里,我们只对尝试其中的四种攻击,分别是back,neptune,smurf,teardrop。我们简单看一下这四种攻击的分布。
- DataBack = dfDataTrain[dfDataTrain['labels']=='back']
- DataNeptune = dfDataTrain[dfDataTrain['labels']=='neptune']
- DataSmurf = dfDataTrain[dfDataTrain['labels']=='smurf']
- DataTeardrop = dfDataTrain[dfDataTrain['labels']=='teardrop']
- DataAll = pd.concat([DataBack, DataNeptune, DataSmurf, DataTeardrop], axis=0, ignore_index=True).sample(frac=1) # 合并成为新的数据
- # 查看各类的分布
- target_count = DataAll.labels.value_counts()
- target_count.plot(kind='barh', title='Count (target)');

Over-Sampling
我们使用简单的过采样,即重复取值,使其样本个数增多。
- from imblearn.over_sampling import RandomOverSampler
- # 实现简单过采样
- ros = RandomOverSampler()
- X = DataAll.iloc[:,:41].to_numpy()
- y = DataAll['labels'].to_numpy()
- X_ros, y_ros = ros.fit_sample(X, y)
- print(X_ros.shape[0] - X.shape[0], 'new random picked points')
- # 组成pandas的格式
- DataAll = pd.DataFrame(X_ros, columns=COL_NAMES[:-1])
- DataAll['labels'] = y_ros
- # 进行可视化展示
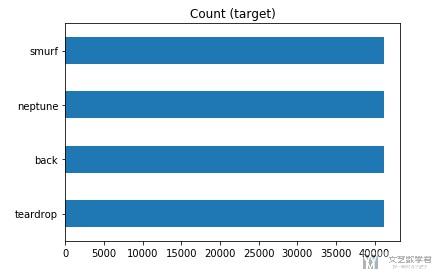
- target_count = DataAll.labels.value_counts()
- target_count.plot(kind='barh', title='Count (target)');
简单看一下最终的结果,可以看到每个类别的样本现在都是40000+,相当于都和之前最多的样本的个数是相同的。

Under-Sampling
下面简单实现一下下采样,也是直接去掉比较多的类中的数据。
- from imblearn.under_sampling import RandomUnderSampler
- rus = RandomUnderSampler(return_indices=True)
- X = DataAll.iloc[:,:41].to_numpy()
- y = DataAll['labels'].to_numpy()
- X_rus, y_rus, id_rus = rus.fit_sample(X, y)
- # 组成pandas的格式
- DataAll = pd.DataFrame(X_rus, columns=COL_NAMES[:-1])
- DataAll['labels'] = y_rus
- # 进行绘图
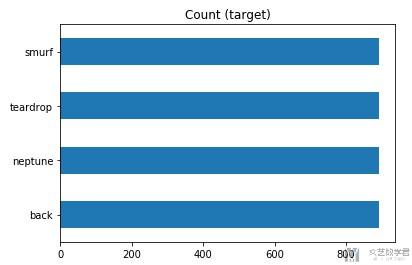
- target_count = DataAll.labels.value_counts()
- target_count.plot(kind='barh', title='Count (target)');
可以看到现在每个样本的个数都是800+,这样就完成了under-sampling.

这里只是简单的介绍关于上采样和下采样的方式,还有一些其他的采样方式可以参考上面的链接。


