

with plt.style.context('XXX')样式
matplotlib中提供了许多整体的风格样式以供我们选择。

>>> plt.style.available

['bmh',
'classic',
'dark_background',
'fast', 'fivethirtyeight',
'ggplot',
'grayscale',
'seaborn-bright',
'seaborn-colorblind',
'seaborn-dark-palette',
'seaborn-dark',
'seaborn-darkgrid',
'seaborn-deep',
'seaborn-muted',
'seaborn-notebook',
'seaborn-paper',
'seaborn-pastel',
'seaborn-poster',
'seaborn-talk',
'seaborn-ticks',
'seaborn-white',
'seaborn-whitegrid',
'seaborn',
'Solarize_Light2',
'tableau-colorblind10',
'_classic_test']
接下来就展示一下其中的一些风格,基于此设计了一个可以绘制直方图和正弦余弦曲线的函数,然后使用with的上下文管理器语法,测试不同的风格:
def hist_and_lines():
    np.random.seed(10)
    fig, ax = plt.subplots(1, 2, figsize=(11, 4))
    ax[0].hist(np.random.randn(1000))
    x = np.linspace(0,10,100)
    ax[1].plot(np.sin(x))
    ax[1].plot(np.cos(x))
    ax[1].legend(['a', 'b', 'c'], loc='lower left')
with语句:
with plt.style.context('classic'):
    hist_and_lines()
    plt.show()
将其中的‘classic’字符串替换成你想要的风格名称,就能在with管理区内使用风格,而不影响后面的绘图。
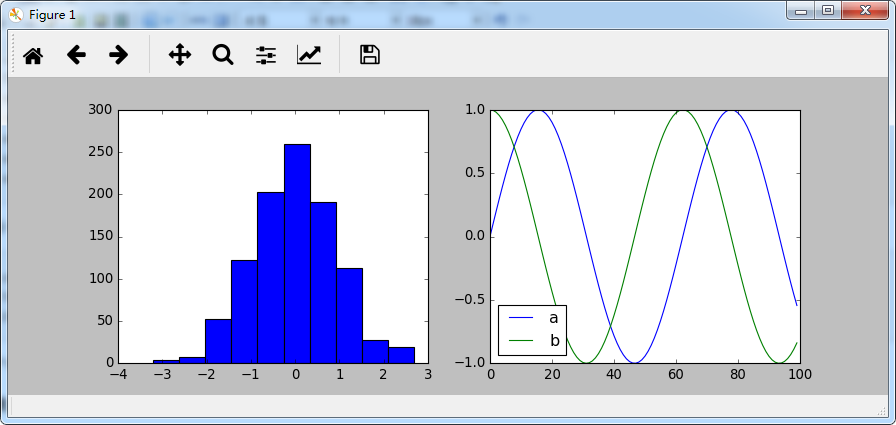
- 默认风格classic
- fivethirtyeight

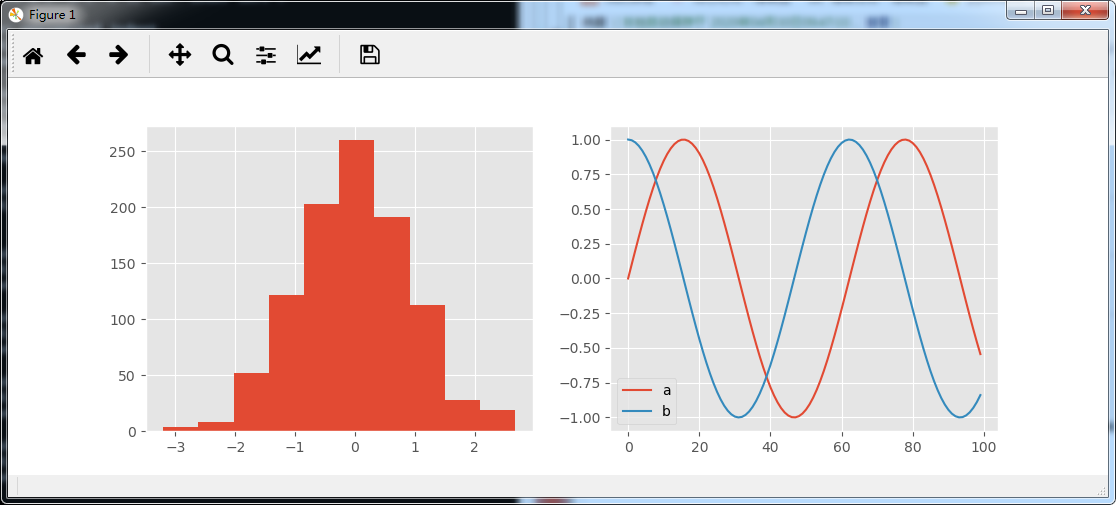
- ggplot
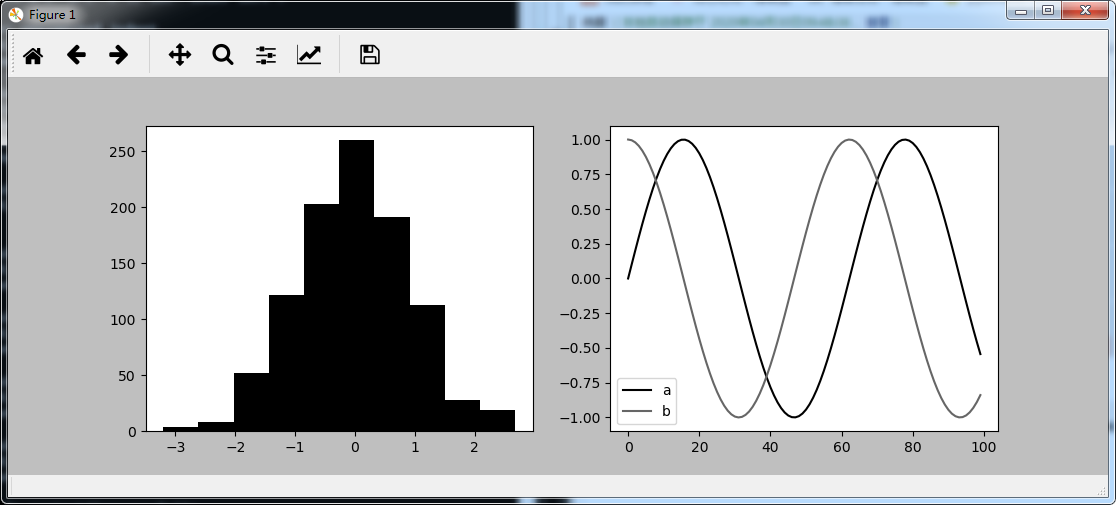
- 灰度grayscale
- seaborn

matplotlib中支持的风格样式共有二十多种,这里只是选出几种来作为展示,具体可以自行选择。
