

python - matplotlib.legend()函数用法解析
1.图例legend基础语法及用法
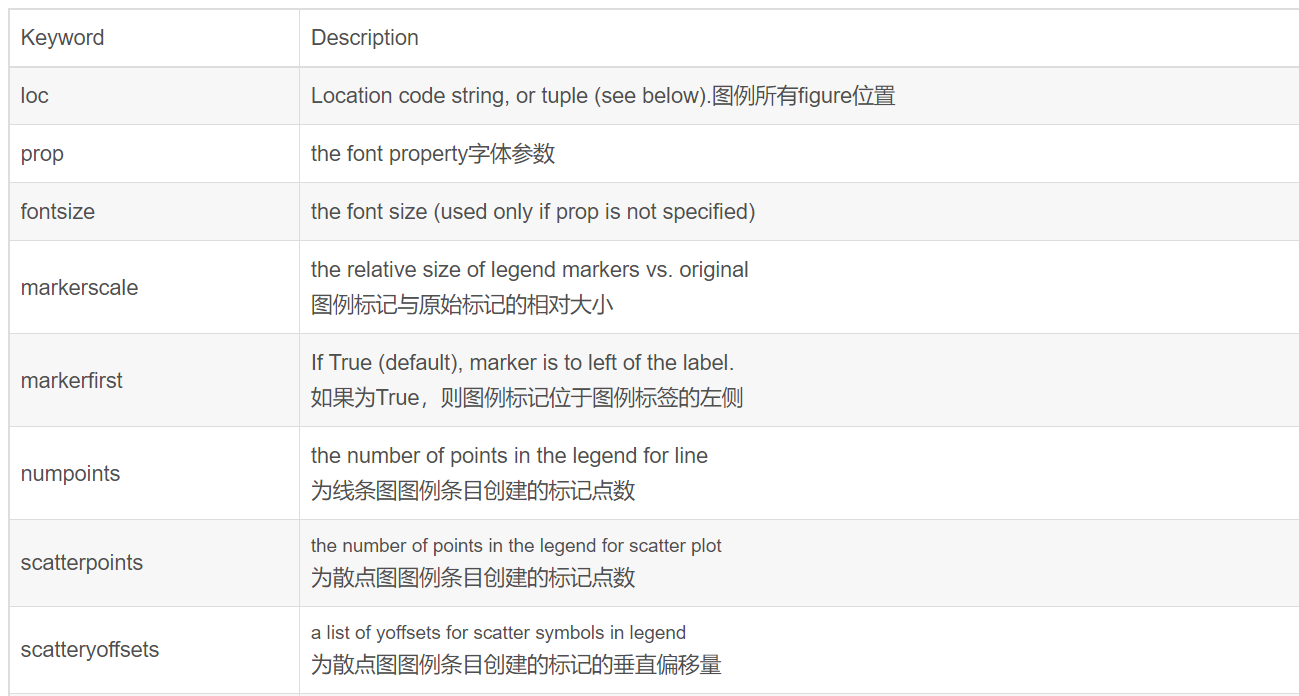
legend语法参数如下: matplotlib.pyplot.legend(*args, **kwargs)
(1)设置图例位置
使用loc参数
plt.legend(loc='lower left')
0: ‘best'
1: ‘upper right'
2: ‘upper left'
3: ‘lower left'
4: ‘lower right'
5: ‘right'
6: ‘center left'
7: ‘center right'
8: ‘lower center'
9: ‘upper center'
10: ‘center'
(2)设置图例字体
#设置字体大小
fontsize : int or float or {‘xx-small’, ‘x-small’, ‘small’, ‘medium’, ‘large’, ‘x-large’, ‘xx-large’}
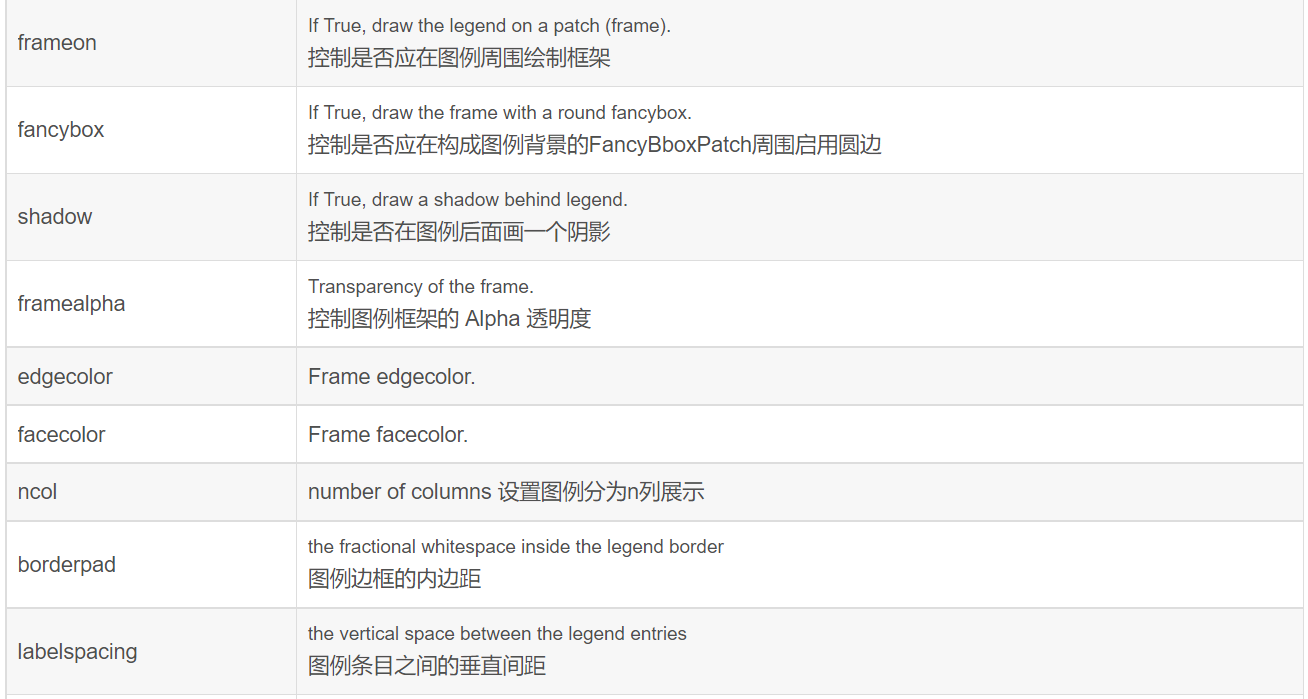
(3)设置图例边框及背景
plt.legend(loc='best',frameon=False) #去掉图例边框
plt.legend(loc='best',edgecolor='blue') #设置图例边框颜色
plt.legend(loc='best',facecolor='blue') #设置图例背景颜色,若无边框,参数无效
(4)设置图例标题
plt.legend(loc='best',title='figure 1 legend') #去掉图例边框
2.legend面向对象命令
(1)获取并设置legend图例
plt.legend(loc=0, numpoints=1)
leg = plt.gca().get_legend() #或leg=ax.get_legend()
ltext = leg.get_texts()
plt.setp(ltext, fontsize=12,fontweight='bold')
(2)设置图例
legend = ax.legend((rectsTest1, rectsTest2, rectsTest3), ('test1', 'test2', 'test3'))
legend = ax.legend(loc='upper center', shadow=True, fontsize='x-large')
legend.get_frame().set_facecolor('red') #设置图例legend背景为红色
frame = legend.get_frame()
frame.set_alpha(1)
frame.set_facecolor('none') #设置图例legend背景透明
(3)移除图例
ax1.legend_.remove() ##移除子图ax1中的图例
ax2.legend_.remove() ##移除子图ax2中的图例
ax3.legend_.remove() ##移除子图ax3中的图例
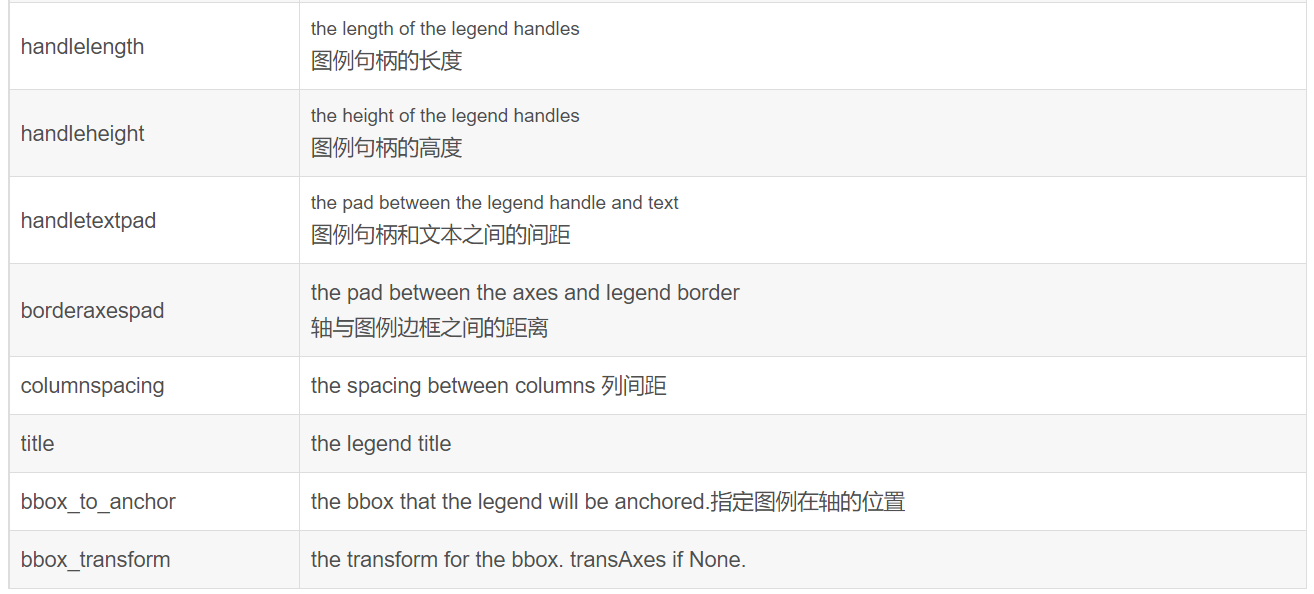
3.案例:设置图例legend到图形边界外
#主要是bbox_to_anchor的使用
box = ax1.get_position()
ax1.set_position([box.x0, box.y0, box.width , box.height* 0.8])
ax1.legend(loc='center', bbox_to_anchor=(0.5, 1.2),ncol=3)
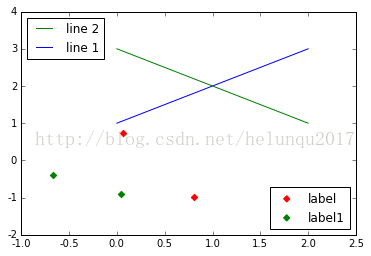
4.案例:显示多图例legend
import matplotlib.pyplot as plt
import numpy as np
x = np.random.uniform(-1, 1, 4)
y = np.random.uniform(-1, 1, 4)
p1, = plt.plot([1,2,3])
p2, = plt.plot([3,2,1])
l1 = plt.legend([p2, p1], ["line 2", "line 1"], loc='upper left')
p3 = plt.scatter(x[0:2], y[0:2], marker = 'D', color='r')
p4 = plt.scatter(x[2:], y[2:], marker = 'D', color='g')
# This removes l1 from the axes.
plt.legend([p3, p4], ['label', 'label1'], loc='lower right', scatterpoints=1)
# Add l1 as a separate artist to the axes
plt.gca().add_artist(l1)
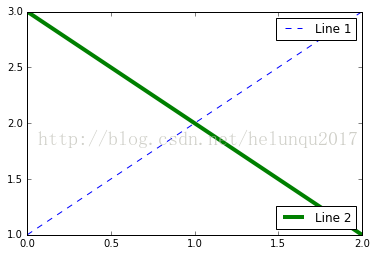
import matplotlib.pyplot as plt
line1, = plt.plot([1,2,3], label="Line 1", linestyle='--')
line2, = plt.plot([3,2,1], label="Line 2", linewidth=4)
# 为第一个线条创建图例
first_legend = plt.legend(handles=[line1], loc=1)
# 手动将图例添加到当前轴域
ax = plt.gca().add_artist(first_legend)
# 为第二个线条创建另一个图例
plt.legend(handles=[line2], loc=4)
plt.show()
————————————————
版权声明:本文为CSDN博主「鸡啄米的时光机」的原创文章,遵循CC 4.0 BY-SA版权协议,转载请附上原文出处链接及本声明。
原文链接:https://blog.csdn.net/qq_33221533/article/details/81431264
