数位板流量分析探索

这是查到的数位板流量的数据解析,简单解读下并以下面的这一段提取出的数据为例
10402a46001e3c0000000000000000003f00000000000000000000
其中x所对应的就是第5到8位,y对应的是11到14位,即'2a46'和'1e3c',并且x和y的数值都是以小端存储,所以这里x和y的10进制值就是17962和15390。因此,只要提取出数据然后提取这两位再转成10进制值后画图就可以还原数位板上的图像了。
于是先写出了这个初步的脚本
import os
import matplotlib.pyplot as plt
os.system("tshark -r 1.pcapng -T fields -e usb.capdata| sed '/^\s*$/d' > 1.txt")
line=open('1.txt').read().splitlines()
xx = []
yy = []
for i in line:
        x0=int(i[4:6],16)
        x1=int(i[6:8],16)
        x=x0+x1*256
        y0=int(i[10:12],16)
        y1=int(i[12:14],16)
        y=y0+y1*256
        xx.append(x)
        yy.append(y)
fig = plt.figure()
ax1 = fig.add_subplot(111)
ax1.set_title("result")
ax1.scatter(xx, yy, c='b', marker='o')
plt.show()
画出来的结果是这样的
草,居然是倒过来的,于是修改一下脚本
import os
import matplotlib.pyplot as plt
os.system("tshark -r 1.pcapng -T fields -e usb.capdata| sed '/^\s*$/d' > 1.txt")
line=open('1.txt').read().splitlines()
xx = []
yy = []
for i in line:
        x0=int(i[4:6],16)
        x1=int(i[6:8],16)
        x=x0+x1*256
        y0=int(i[10:12],16)
        y1=int(i[12:14],16)
        y=y0+y1*256
        xx.append(x)
        yy.append(-y)
fig = plt.figure()
ax1 = fig.add_subplot(111)
ax1.set_title("result")
ax1.scatter(xx, yy, c='b', marker='o')
plt.show()
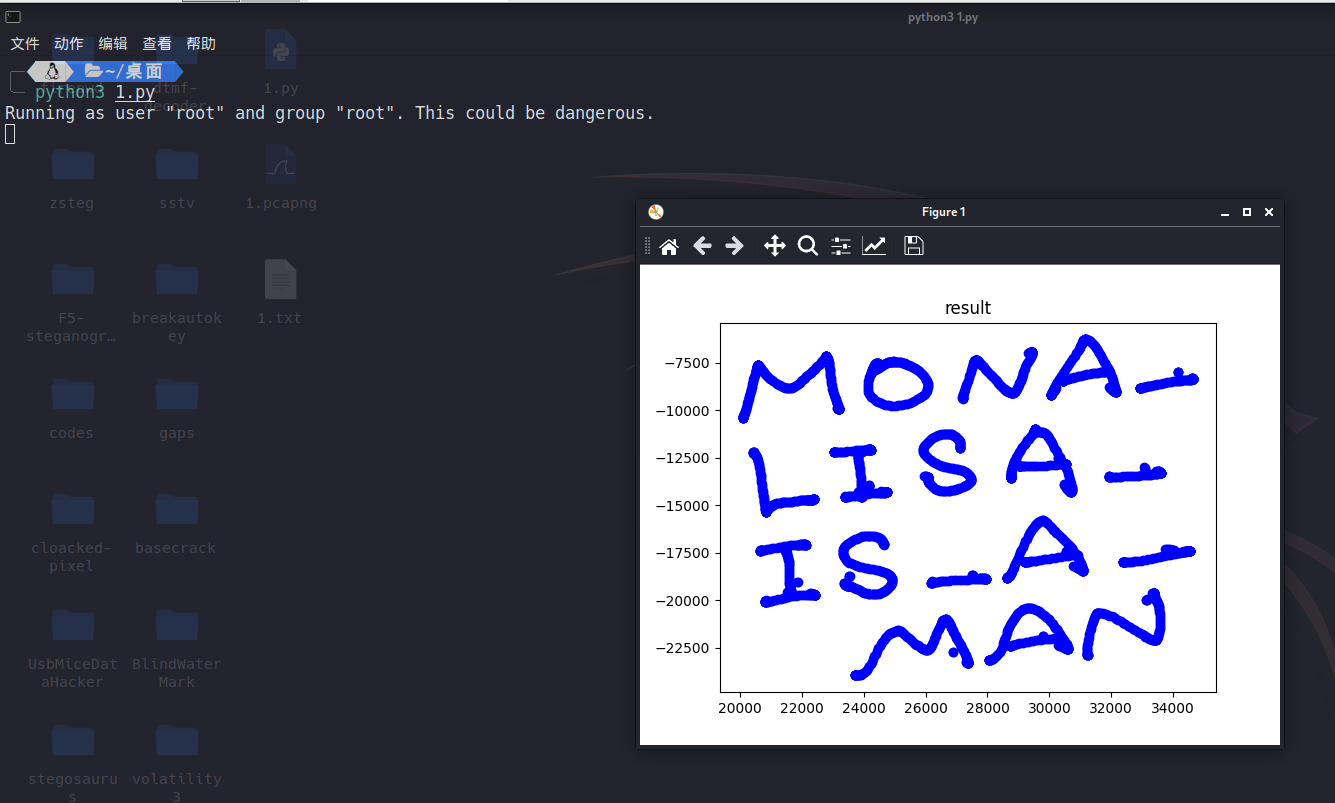
结果如下
倒是能正常显示了,但是看起来很怪,再上网搜下大佬的博客,发现了大佬修改过的脚本显示结果还可以,于是改了一下整合成了最终版的脚本
import os
import matplotlib.pyplot as plt
os.system("tshark -r 1.pcapng -T fields -e usb.capdata| sed '/^\s*$/d' > 1.txt")
data=[]
with open('1.txt',"r") as f:
    for line in f.readlines():
        if line[16:18] !="00":
            data.append(line)
X = []
Y = []
for line in data:
        x0=int(line[4:6],16)
        x1=int(line[6:8],16)
        x=x0+x1*256
        y0=int(line[10:12],16)
        y1=int(line[12:14],16)
        y=y0+y1*256
        X.append(x)
        Y.append(-y)
fig = plt.figure()
ax1 = fig.add_subplot(111)
ax1.set_title("result")
ax1.scatter(X, Y, c='b', marker='o')
plt.show()
显示效果如下,很不错


【推荐】国内首个AI IDE,深度理解中文开发场景,立即下载体验Trae
【推荐】编程新体验,更懂你的AI,立即体验豆包MarsCode编程助手
【推荐】抖音旗下AI助手豆包,你的智能百科全书,全免费不限次数
【推荐】轻量又高性能的 SSH 工具 IShell:AI 加持,快人一步
· 开源Multi-agent AI智能体框架aevatar.ai,欢迎大家贡献代码
· Manus重磅发布:全球首款通用AI代理技术深度解析与实战指南
· 被坑几百块钱后,我竟然真的恢复了删除的微信聊天记录!
· 没有Manus邀请码?试试免邀请码的MGX或者开源的OpenManus吧
· 园子的第一款AI主题卫衣上架——"HELLO! HOW CAN I ASSIST YOU TODAY