使用echart实现关系图
<!DOCTYPE html>
<html lang="en">

<head>
  <meta charset="UTF-8">
  <meta http-equiv="X-UA-Compatible" content="IE=edge">
  <meta name="viewport" content="width=device-width, initial-scale=1.0">
  <title>Document</title>
</head>

<body>
  <div id="main" style="width: 100%;height: 600px"></div>
</body>
<script src="dist/jquery-3.4.1.min.js"></script>
<script src="dist/echarts.js"></script>
<script>
  let heigth = $(window).height();
  $("#main").height(heigth);
  var option;
  // 所有节点合集
  let nodes = [{
      name: "徐云",
      id: "1",
      category: 0,
      draggable: true, //可拖拽
      proportion: "40%", //比例
      itemStyle: {
        color: 'red' //单独设置这个节点的颜色
      }
    },
    {
      name: "王福",
      id: "2",
      category: 0,
      proportion: "10%",
      draggable: true
    },
    {
      name: "冯梁",
      id: "3",
      category: 0,
      proportion: "40%",
      draggable: true
    },
    {
      name: "邓荣",
      id: "4",
      category: 0,
      proportion: "40%",
      draggable: true
    },
    {
      name: "周松",
      id: "5",
      category: 0,
      proportion: "40%",
      draggable: true
    },
    {
      name: "陶勇",
      id: "6",
      category: 0,
      proportion: "40%",
      draggable: true
    },
    {
      name: "王军",
      id: "7",
      category: 0,
      proportion: "40%",
      draggable: true
    },
    {
      name: "李庆",
      id: "8",
      category: 0,
      proportion: "20%",
      draggable: true
    },
    {
      name: "陈献",
      id: "9",
      category: 0,
      proportion: "10%",
      draggable: true
    },
    {
      name: "赵成",
      id: "10",
      category: 0,
      proportion: "2%",
      draggable: true
    },
    {
      name: "郑勇",
      id: "11",
      category: 0,
      proportion: "20%",
      draggable: true
    },
    {
      name: "赵杰",
      id: "12",
      category: 0,
      proportion: "60%",
      draggable: true
    },
    {
      name: "陈东",
      id: "13",
      category: 0,
      proportion: "8%",
      draggable: true
    }
  ];
  //  每个节点的关系,
  let links = [{
      source: "1", //节点的id
      target: "2", //节点的id,这两个就是谁和谁之间建立关系
      relation: {
        name: "朋友", //关系名称
        id: "1",
      },
    },
    {
      source: "1",
      target: "3",
      relation: {
        name: "朋友",
        id: "1",
      },
    },
    {
      source: "3",
      target: "4",
      relation: {
        name: "表亲",
        id: "1",
      },
    },
    {
      source: "4",
      target: "5",
      relation: {
        name: "叔叔",
        id: "1",
      },
    }, {
      source: "6",
      target: "7",
      relation: {
        name: "爱人",
        id: "1",
      },
    },
    {
      source: "7",
      target: "8",
      relation: {
        name: "同学",
        id: "1",
      },
    },
    {
      source: "1",
      target: "8",
      relation: {
        name: "房东",
        id: "1",
      },
    },
    {
      source: "8",
      target: "9",
      relation: {
        name: "朋友",
        id: "1",
      },
    },
    {
      source: "9",
      target: "10",
      relation: {
        name: "朋友",
        id: "1",
      },
    },
    {
      source: "1",
      target: "11",
      relation: {
        name: "朋友",
        id: "1",
      },
    },
    {
      source: "12",
      target: "13",
      relation: {
        name: "朋友",
        id: "1",
      },
    },
    {
      source: "1",
      target: "12",
      relation: {
        name: "朋友",
        id: "1",
      },
    },
  ];
  // 这个是设置每个节点的线的长度
  nodes = nodes.map((item) => {
    item.x = Math.random() * 700
    item.y = Math.random() * 700
    return item
  })
  option = {
    title: {
      text: '股权信息'
    },

    tooltip: {
      formatter: function (params) { //提示框自定义
        console.log(params)
        let el = `<span>${params.data.name}</span>`
        el += `<br><span>持股比例:${params.data.proportion}</span>`
        return el
      },
    },
    animationDurationUpdate: 1500,
    animationEasingUpdate: 'quinticInOut',
    series: [{
      roam: true,
      draggable: false, // 这里必须设置成false,否则拖拽的时候,会有偏移
      type: 'graph', //类型
      layout: 'force', //一定要设置这个,不然节点无法拖动
      nodes: nodes,
      links: links,
      symbolSize: function (value, params) { //改变节点大小
        return 50
      },
      itemStyle: {
        color: "#66a6ff"
      },
      // 设置文本信息
      label: {
        show: true,
        // position: [25, 20],
        distance: 5,
        fontSize: 14,
        // align: "center",
        color: "#ffffff"

      },
      autoCurveness: 0.01, //多条边的时候,自动计算曲率
      edgeLabel: { //边的设置
        show: true,
        position: "middle",
        fontSize: 12,
        formatter: (params) => {
          return params.data.relation.name;
        },
      },
      edgeSymbol: ["circle", "arrow"], //边两边的类型
      force: {
        repulsion: 100,
        gravity: 0.01,
        edgeLength: 200
      }
    }, ],
  };
  var chartDom = document.getElementById('main');
  var myChart = echarts.init(chartDom);
  myChart.setOption(option);
</script>

</html>
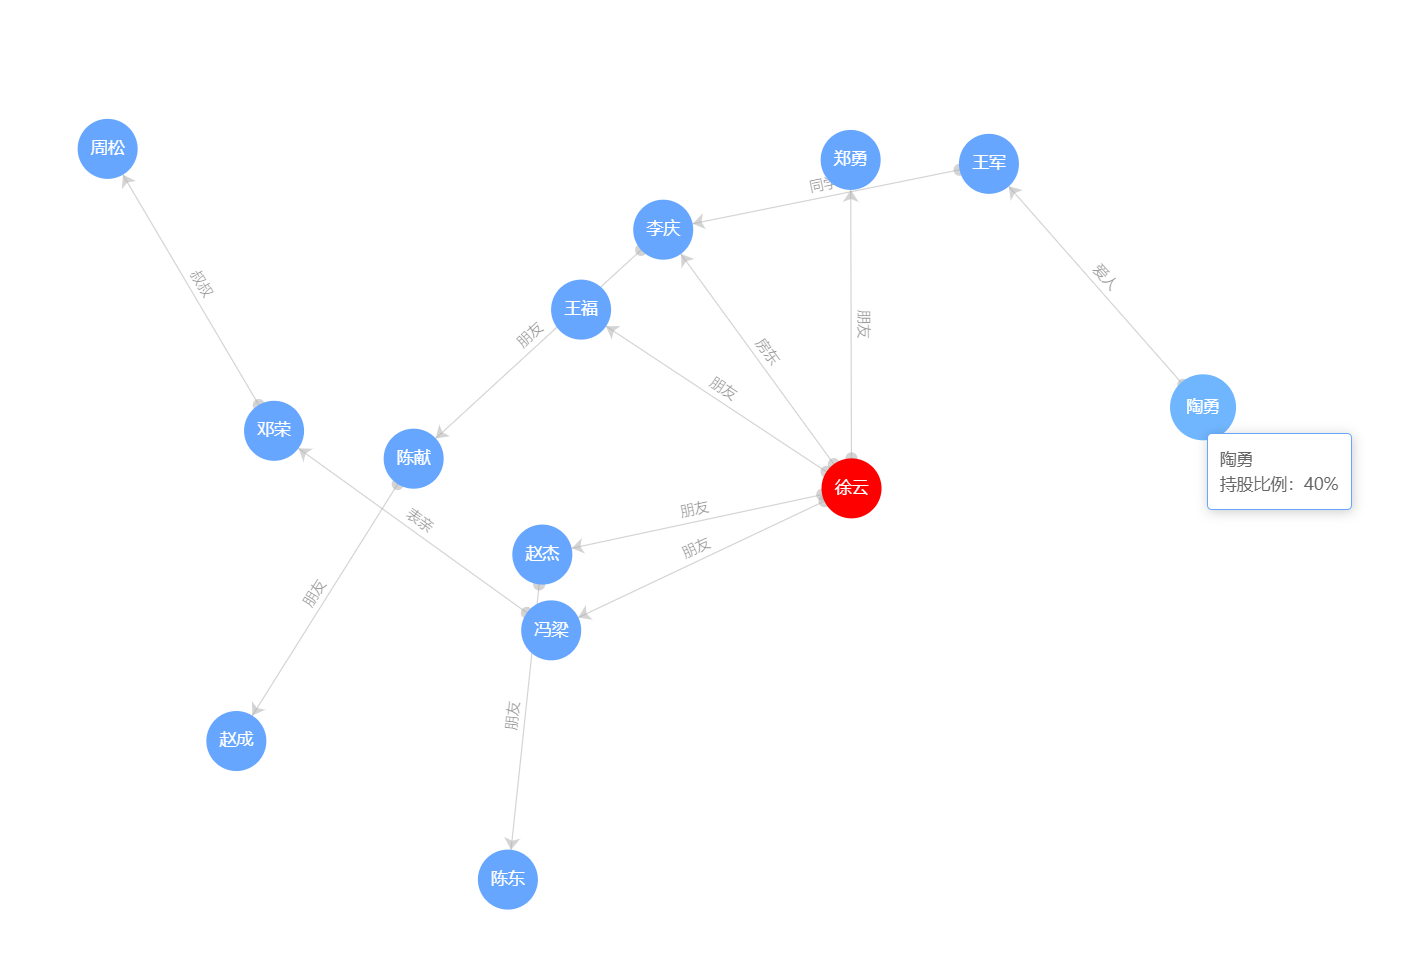
效果图如下: