import numpy as np
import matplotlib.pyplot as plt
from mpl_toolkits.mplot3d import Axes3D
import pandas as pd
# 定义颜色区间
def get_color():
c = []
for da in data1:
if da < -110:
c.append('#00CC00')
elif da < -108:
c.append('#66CC00')
elif da < -105:
c.append('#CCCC00')
elif da < -102:
c.append('#CC6600')
elif da < -100:
c.append('#CC3300')
else:
c.append('#CC0000')return c
workexcel_path = 'D:\pythontest\性能-历史查询-小区RB上行平均干扰电平.xlsx'
df = pd.DataFrame(pd.read_excel(workexcel_path, sheet_name='Sheet1'))
df_li = df.values.tolist()
result = []
for s_li in df_li:
# 对获取的数据遍历,切片出需要的数据
result.append(s_li[20:])
# print(s_li)
data1 = np.array(result, dtype=None)
y_m = len(df_li)
data1 = data1.ravel()
# 构造需要显示的值 273个RB,设置X轴273个坐标点。有len(df_li)行数据,设置Y
X = np.arange(0, 273, step=1) # X轴的坐标
Y = np.arange(0, y_m, step=1) # Y轴的坐标
# 设置每一个(X,Y)坐标所对应的Z轴的值,在这边Z(X,Y)=X+Y
xx, yy = np.meshgrid(X, Y) # 网格化坐标
X, Y = xx.ravel(), yy.ravel() # 矩阵扁平化
# bottom=np.zeros_like(X)#设置柱状图的底端位值
bot = -120
bottom = [bot] * y_m * 273
bottom = np.array(bottom)
# 每一个柱子的长和宽
width=height = 1
c=get_color()
# 绘图设置
fig = plt.figure(figsize=(8, 4))
ax = fig.gca(projection='3d') # 三维坐标轴
# x、 y,z:数组状锚固点的坐标。dx,dy,dz:标量或类似数组条的宽度、深度和高度
surf = ax.bar3d(Y, X, bottom, width, height, data1 + 120, shade=True, color=c)
# 坐标轴设置
ax.set_xlim(24, 0) # X轴,横向向右方向
ax.set_ylim(0, 273) # Y轴,左向与X,Z轴互为垂直
ax.set_zlim(-120, -60) # 竖向为Z轴
ax.set_xlabel('时间')
ax.set_ylabel('RB')
ax.set_zlabel('NI')
plt.show()
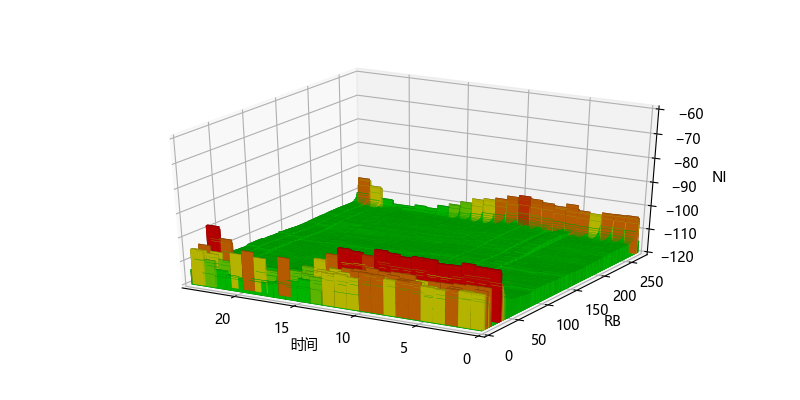
# 打印结果如下图
![]()


 浙公网安备 33010602011771号