ASP.NET统计图表控件
近来客户需要将前段时间开发的统计信息用图表展示出来,还要多个图表类型,例如:柱状图、饼图、曲线图、三维图等等。在网上google了一下,发现了三个(也许更多)可以使用的控件。下面我们一起看看这三个控件。
1、OWC11
这个控件全称是:Office Web Component 11,是office2003中的一个组件,可惜的是office2007中没有了它的身影。不过安装office2003之后可以引用,然后使用。使用过的人都知道,就是它的效果要差一点。
2、dotnetCharting
http://www.dotnetcharting.com/
dotnetcharting是国外的一个产品,是要收费的。具体还没有使用,后面在我尝试之后,我会添加一些使用范例。大家也可以上网搜索一下,很多的列子。
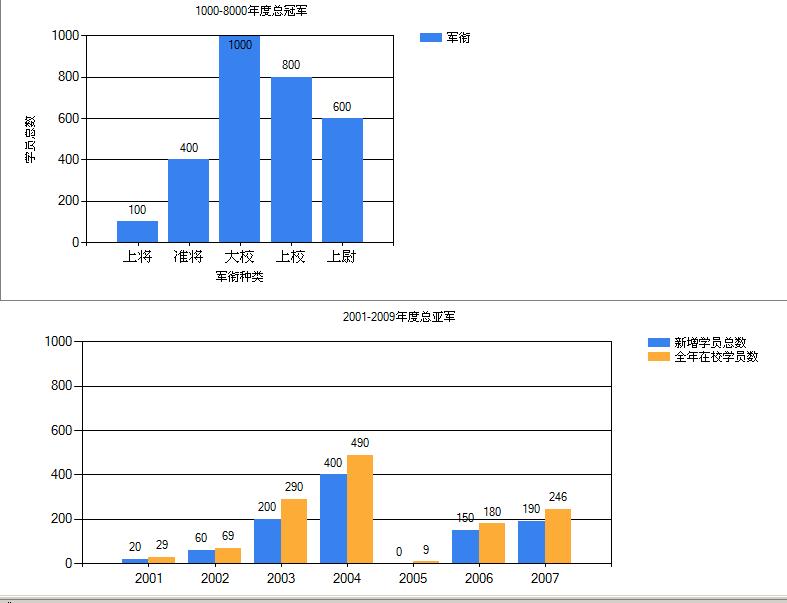
3、MSChart
微软发布了.NET 3.5框架下的图表控件,发觉功能很强劲,基本上能想到的图表都可以使用它绘制出来,给图形统计和报表图形显示提供了很好的解决办法,同时支持Web和WinForm两种方式,不过缺点也比较明显,只能在最新的开发环境中使用,需要.Net 3.5 Sp1以及VS 2008的开发环境。
MSChart在ASP.NET中的使用,需要设置web.config文件,可以参看下面的链接:
http://www.cnblogs.com/carysun/archive/2009/03/15/MSChart.html
http://www.cnblogs.com/bluetiger/archive/2009/03/02/1401457.html
MSChart在SharePoint2007中的使用,同样也需要设置web.config文件,可以参看下面的链接:
http://social.msdn.microsoft.com/Forums/en/MSWinWebChart/thread/6eed0b12-9334-4ef5-9d1e-6da1c43d791a
下面是下载地址:
控件:Microsoft .NET Framework 3.5 的 Microsoft 图表控件(Microsoft Chart Controls for Microsoft .NET Framework 3.5)–
包含英文版,中文版。上面提供的链接是中文版的,可以更改为英文版。
语言包:Microsoft Chart Controls for Microsoft .NET Framework 3.5 Language Pack
Microsoft .NET Framework 3.5 的Microsoft 图表控件 的语言包,包含23中语言。
Microsoft Chart Controls Add-on for Microsoft Visual Studio 2008
这个只有英文的,没找到中文的。
文档 (Microsoft Chart Controls for .NET Framework Documentation)
这个只有英文的,没找到中文的。
WinForm 和 Asp.net的例子(Samples Environment for Microsoft Chart Controls) –
这个只有英文的,没找到中文的。
Demo 下载:http://code.msdn.microsoft.com/mschart
 页面代码
页面代码
<%@ Register Assembly="System.Web.DataVisualization, Version=3.5.0.0, Culture=neutral, PublicKeyToken=31bf3856ad364e35"
Namespace="System.Web.UI.DataVisualization.Charting" TagPrefix="asp" %>
<!DOCTYPE html PUBLIC "-//W3C//DTD XHTML 1.0 Transitional//EN" "http://www.w3.org/TR/xhtml1/DTD/xhtml1-transitional.dtd">
<html xmlns="http://www.w3.org/1999/xhtml">
<head runat="server">
<title></title>
</head>
<body>
<form id="form1" runat="server">
<div>
<fieldset>
<legend>ddd</legend>
<asp:Chart ID="Chart1" runat="server">
<Titles>
<asp:Title Name="Title" Text="Title1">
</asp:Title>
</Titles>
<Annotations >
<asp:TextAnnotation Text=""></asp:TextAnnotation>
</Annotations>
<Legends>
<asp:Legend Title =""></asp:Legend>
</Legends>
<MapAreas>
</MapAreas>
<Series>
</Series>
<ChartAreas>
<asp:ChartArea Name="ChartAreas1">
</asp:ChartArea>
</ChartAreas>
</asp:Chart>
</fieldset>
</div>
<div>
<asp:Chart ID="Chart2" runat="server">
<Series>
</Series>
<Legends>
<asp:Legend Title =""></asp:Legend>
</Legends>
<ChartAreas>
<asp:ChartArea Name="ChartAreas1">
</asp:ChartArea>
</ChartAreas>
</asp:Chart>
</div>
</form>
</body>
</html>
后台代码
using System.Collections.Generic;
using System.Linq;
using System.Web;
using System.Data;
using System.Web.UI;
using System.Web.UI.WebControls;
using Microsoft.Office.Core;
using Microsoft.Office.Interop.Owc11;
using Microsoft.Office.Interop;
using System.Web.UI.DataVisualization.Charting;
namespace BeautyCode.SharePoint.MVPDemo.Pages
{
public partial class Chart : System.Web.UI.Page
{
private DataTable _SampleDataTable;
private DataTable _InSchool;
protected void Page_Load(object sender, EventArgs e)
{
if (!IsPostBack)
{
PaintChart1();
PaintChart2();
}
}
private void CreateDataTable()
{
_SampleDataTable = new DataTable();
_SampleDataTable.Columns.Add("jx");
_SampleDataTable.Columns.Add("count");
DataRow row;
row = _SampleDataTable.NewRow();
row[0] = "上将";
row[1] = 100;
_SampleDataTable.Rows.Add(row);
row = _SampleDataTable.NewRow();
row[0] = "准将";
row[1] = 400;
_SampleDataTable.Rows.Add(row);
row = _SampleDataTable.NewRow();
row[0] = "大校";
row[1] = 1000;
_SampleDataTable.Rows.Add(row);
row = _SampleDataTable.NewRow();
row[0] = "上校";
row[1] = 800;
_SampleDataTable.Rows.Add(row);
row = _SampleDataTable.NewRow();
row[0] = "上尉";
row[1] = 600;
_SampleDataTable.Rows.Add(row);
}
private void PaintChart1()
{
CreateDataTable();
this.Chart1.Titles["Title"].Text = "1000-8000年度总冠军";
this.Chart1.Series.Add(new Series("军衔"));
this.Chart1.Width = 500;
#region MSChart manual add data
//this.Chart1.Series["军衔"].Points.AddXY("上将", 20);
//this.Chart1.Series["军衔"].Points.AddXY("中将", 200);
//this.Chart1.Series["军衔"].Points.AddXY("准将", 40);
//this.Chart1.Series["军衔"].Points.AddXY("中校", 60);
//this.Chart1.Series["军衔"].Points.AddXY("少校", 100);
//this.Chart1.Series["军衔"].Points.AddXY("上尉", 48);
#endregion
#region MSChart DataSource Array
//int xy = _SampleDataTable.Rows.Count;
//List<string> jx = new List<string>();
//List<int> count = new List<int>();
//DataRowCollection rows = _SampleDataTable.Rows;
//foreach (DataRow row in rows)
//{
// jx.Add(row["jx"].ToString());
// count.Add(int.Parse(row["count"].ToString()));
//}
//this.Chart1.Series["军衔"].Points.DataBindXY(jx,count );
#endregion
#region MSChart DataSource DataTable
this.Chart1.DataSource = _SampleDataTable;
this.Chart1.Series["军衔"].XValueMember = "jx";
this.Chart1.Series["军衔"].XValueType = ChartValueType.String;
this.Chart1.Series["军衔"].XAxisType = AxisType.Primary;
this.Chart1.Series["军衔"].YValueMembers = "count";
this.Chart1.Series["军衔"].YValueType = ChartValueType.Int32;
this.Chart1.Series["军衔"].YAxisType = AxisType.Primary;
#endregion
#region
this.Chart1.Series["军衔"].ChartType = SeriesChartType.Column;
this.Chart1.Series["军衔"].BorderWidth = 1;
this.Chart1.Series["军衔"].IsVisibleInLegend = true;
this.Chart1.Series["军衔"].IsValueShownAsLabel = true;
#endregion
#region
this.Chart1.ChartAreas["ChartAreas1"].AxisX.Title = "军衔种类";
this.Chart1.ChartAreas["ChartAreas1"].AxisY.Interval = 200;
this.Chart1.ChartAreas["ChartAreas1"].AxisY.Title = "学员总数";
this.Chart1.ChartAreas["ChartAreas1"].AxisY.Maximum = 1000;
this.Chart1.ChartAreas["ChartAreas1"].BorderDashStyle = ChartDashStyle.Solid;
this.Chart1.ChartAreas["ChartAreas1"].BorderWidth = 1;
this.Chart1.ChartAreas["ChartAreas1"].AxisX.MajorGrid.LineWidth = 0;
#endregion
}
private void CreateInSchool()
{
_InSchool = new DataTable();
_InSchool.Columns.Add("year");
_InSchool.Columns.Add("allyear");
_InSchool.Columns.Add("new");
_InSchool.Rows.Add("2001", 20, 29);
_InSchool.Rows.Add("2002", 60, 69);
_InSchool.Rows.Add("2003", 200, 290);
_InSchool.Rows.Add("2004", 400, 490);
_InSchool.Rows.Add("2005", 0, 9);
_InSchool.Rows.Add("2006", 150, 180);
_InSchool.Rows.Add("2007", 190, 246);
}
private void PaintChart2()
{
CreateInSchool();
this.Chart2.Titles.Add("2001-2009年度总亚军");
this.Chart2.Width = 800;
this.Chart2.Series.Add(new Series("新增学员总数"));
this.Chart2.Series["新增学员总数"].ChartType = SeriesChartType.Column;
this.Chart2.Series["新增学员总数"].BorderWidth = 1;
this.Chart2.Series["新增学员总数"].IsVisibleInLegend = true;
this.Chart2.Series["新增学员总数"].IsValueShownAsLabel = true;
#region
this.Chart2.Series["新增学员总数"].ChartType = SeriesChartType.Column;
this.Chart2.Series["新增学员总数"].BorderWidth = 1;
this.Chart2.Series["新增学员总数"].IsVisibleInLegend = true;
this.Chart2.Series["新增学员总数"].IsValueShownAsLabel = true;
this.Chart2.Series["新增学员总数"].ChartArea = "ChartAreas1";
#endregion
#region
this.Chart2.ChartAreas["ChartAreas1"].AxisY.Interval = 200;
this.Chart2.ChartAreas["ChartAreas1"].AxisY.Maximum = 1000;
this.Chart2.ChartAreas["ChartAreas1"].BorderDashStyle = ChartDashStyle.Solid;
this.Chart2.ChartAreas["ChartAreas1"].BorderWidth = 1;
this.Chart2.ChartAreas["ChartAreas1"].AxisX.MajorGrid.LineWidth = 0;
#endregion
this.Chart2.Series.Add(new Series("全年在校学员数"));
this.Chart2.Series["全年在校学员数"].ChartType = SeriesChartType.Column;
this.Chart2.Series["全年在校学员数"].BorderWidth = 1;
this.Chart2.Series["全年在校学员数"].IsVisibleInLegend = true;
this.Chart2.Series["全年在校学员数"].IsValueShownAsLabel = true;
#region
this.Chart2.Series["全年在校学员数"].ChartType = SeriesChartType.Column;
this.Chart2.Series["全年在校学员数"].BorderWidth = 1;
this.Chart2.Series["全年在校学员数"].IsVisibleInLegend = true;
this.Chart2.Series["全年在校学员数"].IsValueShownAsLabel = true;
this.Chart2.Series["全年在校学员数"].ChartArea = "ChartAreas1";
#endregion
#region
this.Chart2.ChartAreas["ChartAreas1"].AxisY.Interval = 200;
this.Chart2.ChartAreas["ChartAreas1"].AxisY.Maximum = 1000;
this.Chart2.ChartAreas["ChartAreas1"].BorderDashStyle = ChartDashStyle.Solid;
this.Chart2.ChartAreas["ChartAreas1"].BorderWidth = 1;
this.Chart2.ChartAreas["ChartAreas1"].AxisX.MajorGrid.LineWidth = 0;
#endregion
this.Chart2.DataSource = _InSchool;
this.Chart2.Series["新增学员总数"].XValueMember = "year";
this.Chart2.Series["新增学员总数"].XValueType = ChartValueType.Int32;
this.Chart2.Series["新增学员总数"].XAxisType = AxisType.Primary;
this.Chart2.Series["新增学员总数"].YValueMembers = "allyear";
this.Chart2.Series["新增学员总数"].YValueType = ChartValueType.Int32;
this.Chart2.Series["新增学员总数"].YAxisType = AxisType.Primary;
this.Chart2.Series["全年在校学员数"].XValueMember = "year";
this.Chart2.Series["全年在校学员数"].XValueType = ChartValueType.Int32;
this.Chart2.Series["全年在校学员数"].XAxisType = AxisType.Primary;
this.Chart2.Series["全年在校学员数"].YValueMembers = "new";
this.Chart2.Series["全年在校学员数"].YValueType = ChartValueType.Int32;
this.Chart2.Series["全年在校学员数"].YAxisType = AxisType.Primary;
}
}
}

 浙公网安备 33010602011771号