
node_exporter/mysqld_exporter + Prometheus + Grafana 监控搭建
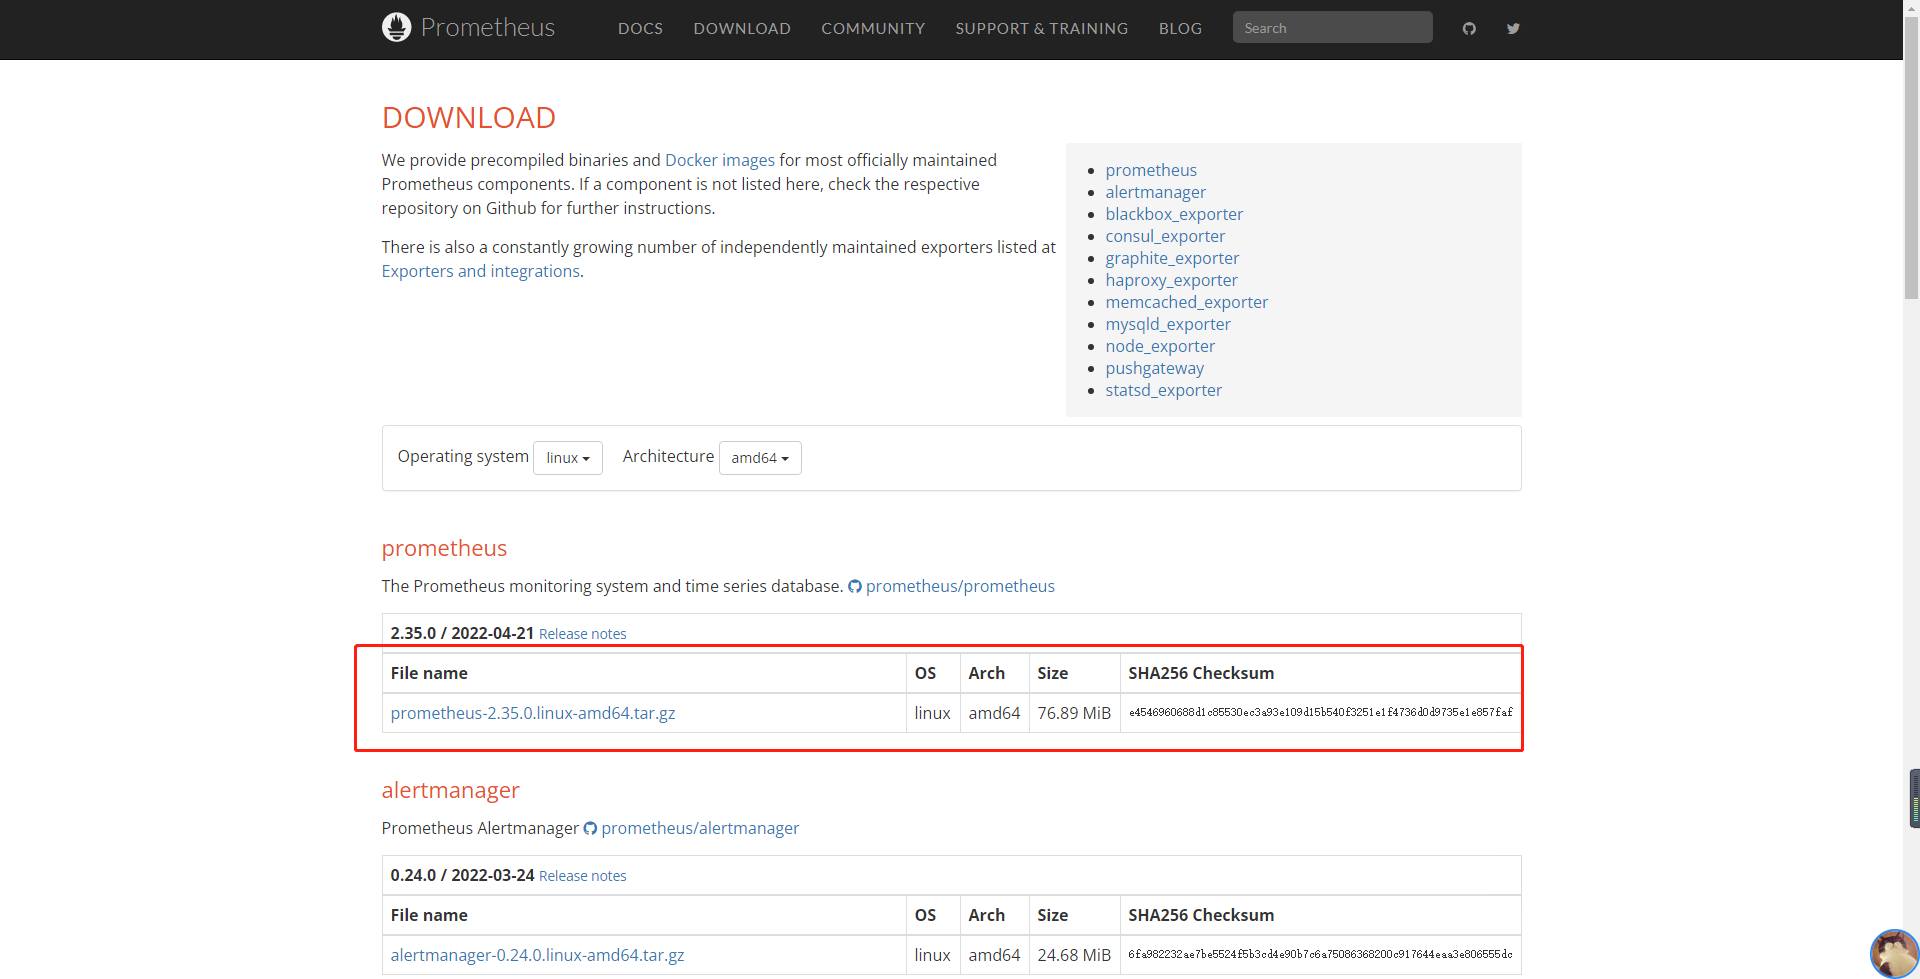
1.Prometheus的下载与安装
官网下载地址:https://prometheus.io/download/,根据系统自行下载,然后使用xftp上传到系统内
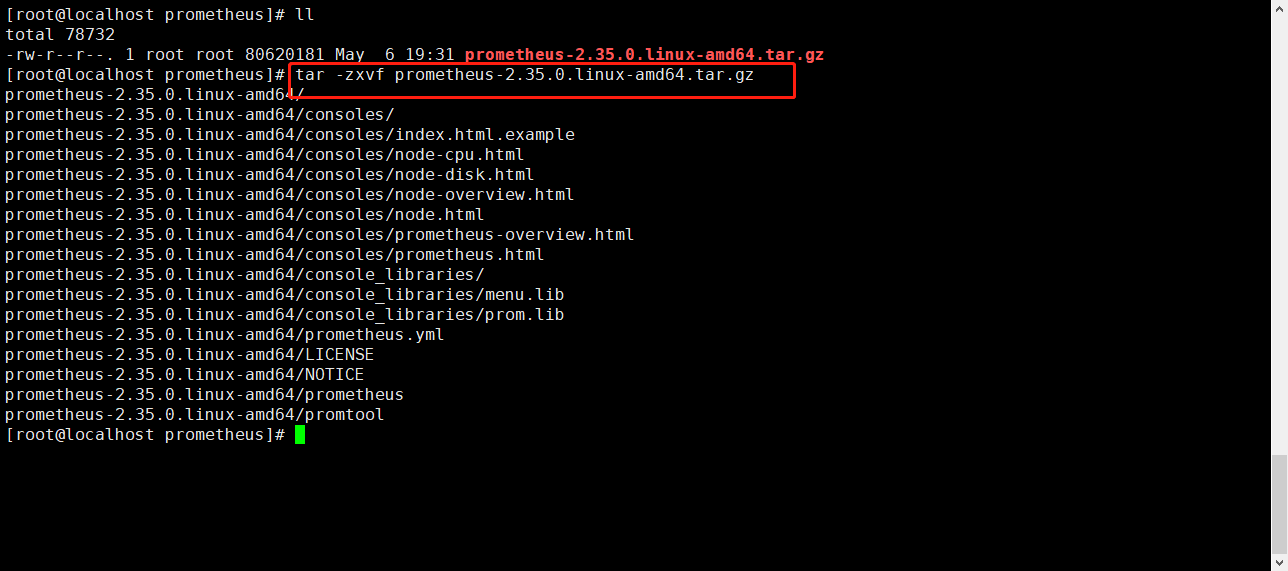
使用 #tar -zxvf prometheus-2.35.0.linux-amd64.tar.gz 进行解压
修改配置文件:promethus.yml
#cd /usr/local/prometheus/prometheus-2.35.0.linux-amd64 进入到安装目录
#vi prometheus.yml 编辑配置文件
将以下内容加入到末尾:

添加内容说明:
-job_name: 'linux'
static_configs:
- targets: ['localhost:9100']
-job_name: 'mysql'
static_configs:
- targets: ['localhost:9104']
提示:如需同时监控多个相同的资源,需要将以上内容中的localhost替换成被监控服务器的ip
对配置文件进行赋权:
#chmod -777 prometheus.yml
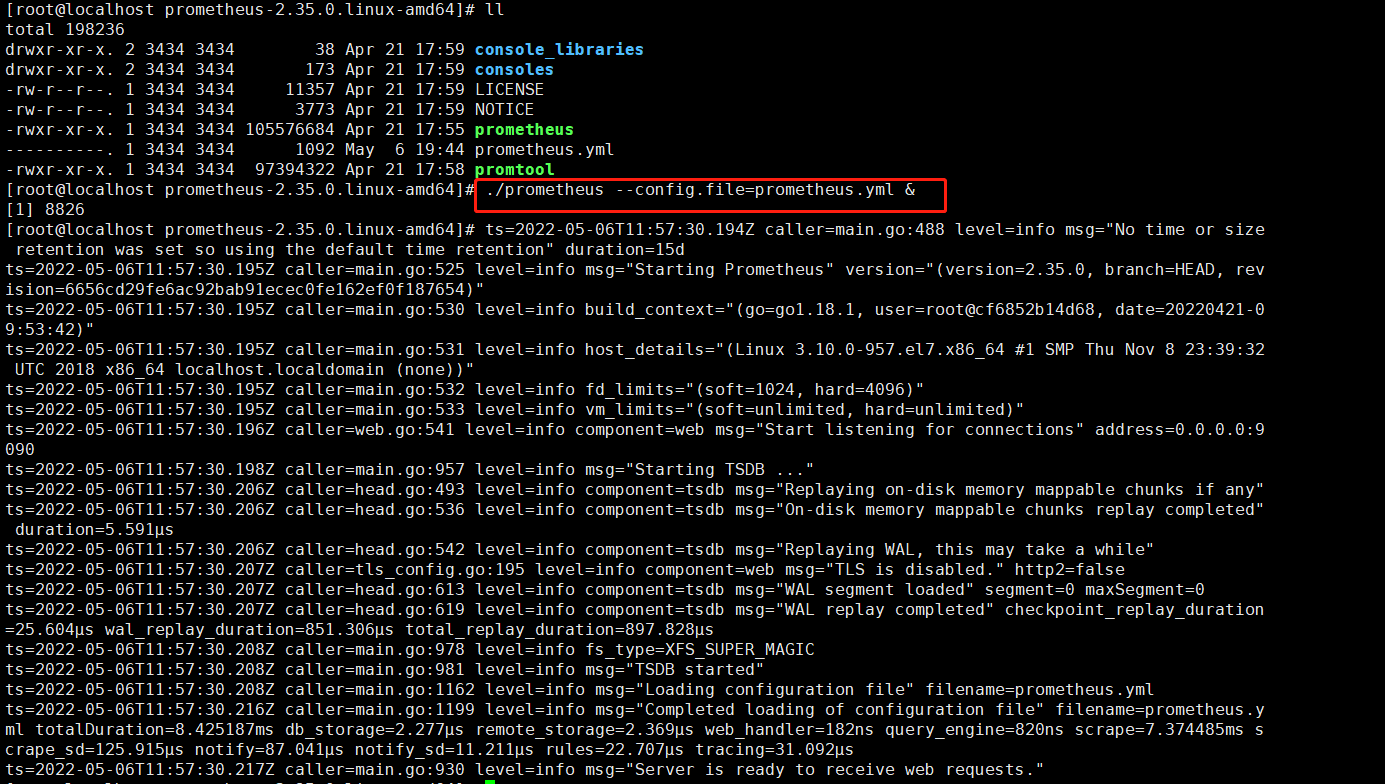
启动prometheus:
进入到配置文件所在的目录,应用配置文件启动prometheus
执行命令:#./prometheus --config.file=prometheus.yml &
如启动时报错:
问题1:level=errorts=2018-11-19T06:01:05.697957445Zcaller=main.go:625err="openingstoragefailed:lockDBdirectory:resourcetemporarilyunavailable
解决方法:删除lock文件 #rm-f/usr/local/prometheus/prometheus215/data/lock
启动问题:level=errorts=2018-11-19T06:04:47.83421089Zcaller=main.go:625err="errorstartingwebserver:listentcp0.0.0.0:9090:bind:addressalreadyinuse"
解决方法:查找使用9090端口的PID并删掉:#ps -ef|grep 9090 kill -9 pid号
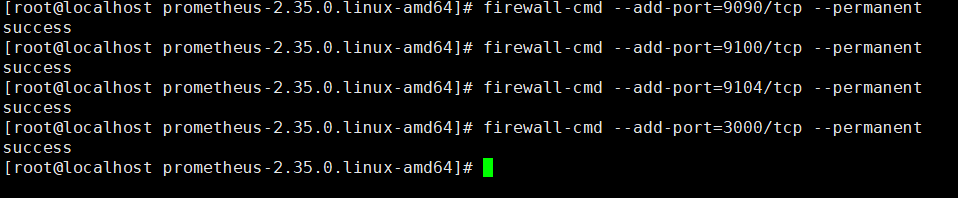
关闭防火墙或添加永久开放端口:
关闭防火墙:systemctl stop firewalld
添加永久开放端口:firewall-cmd --add-port=9090/tcp --permanent
此处我们添加以下4个端口:
重启防火墙,并查看开放的端口
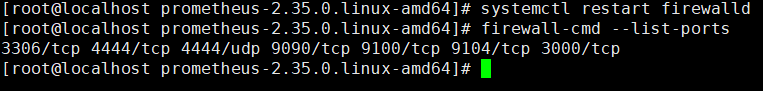
重启防火墙:#systemctl restart firewalld
查看开放端口:firewall-cmd --list-ports
在windows上使用谷歌浏览器登录 http://ip:9090 ip为prometheus所在机器的ip
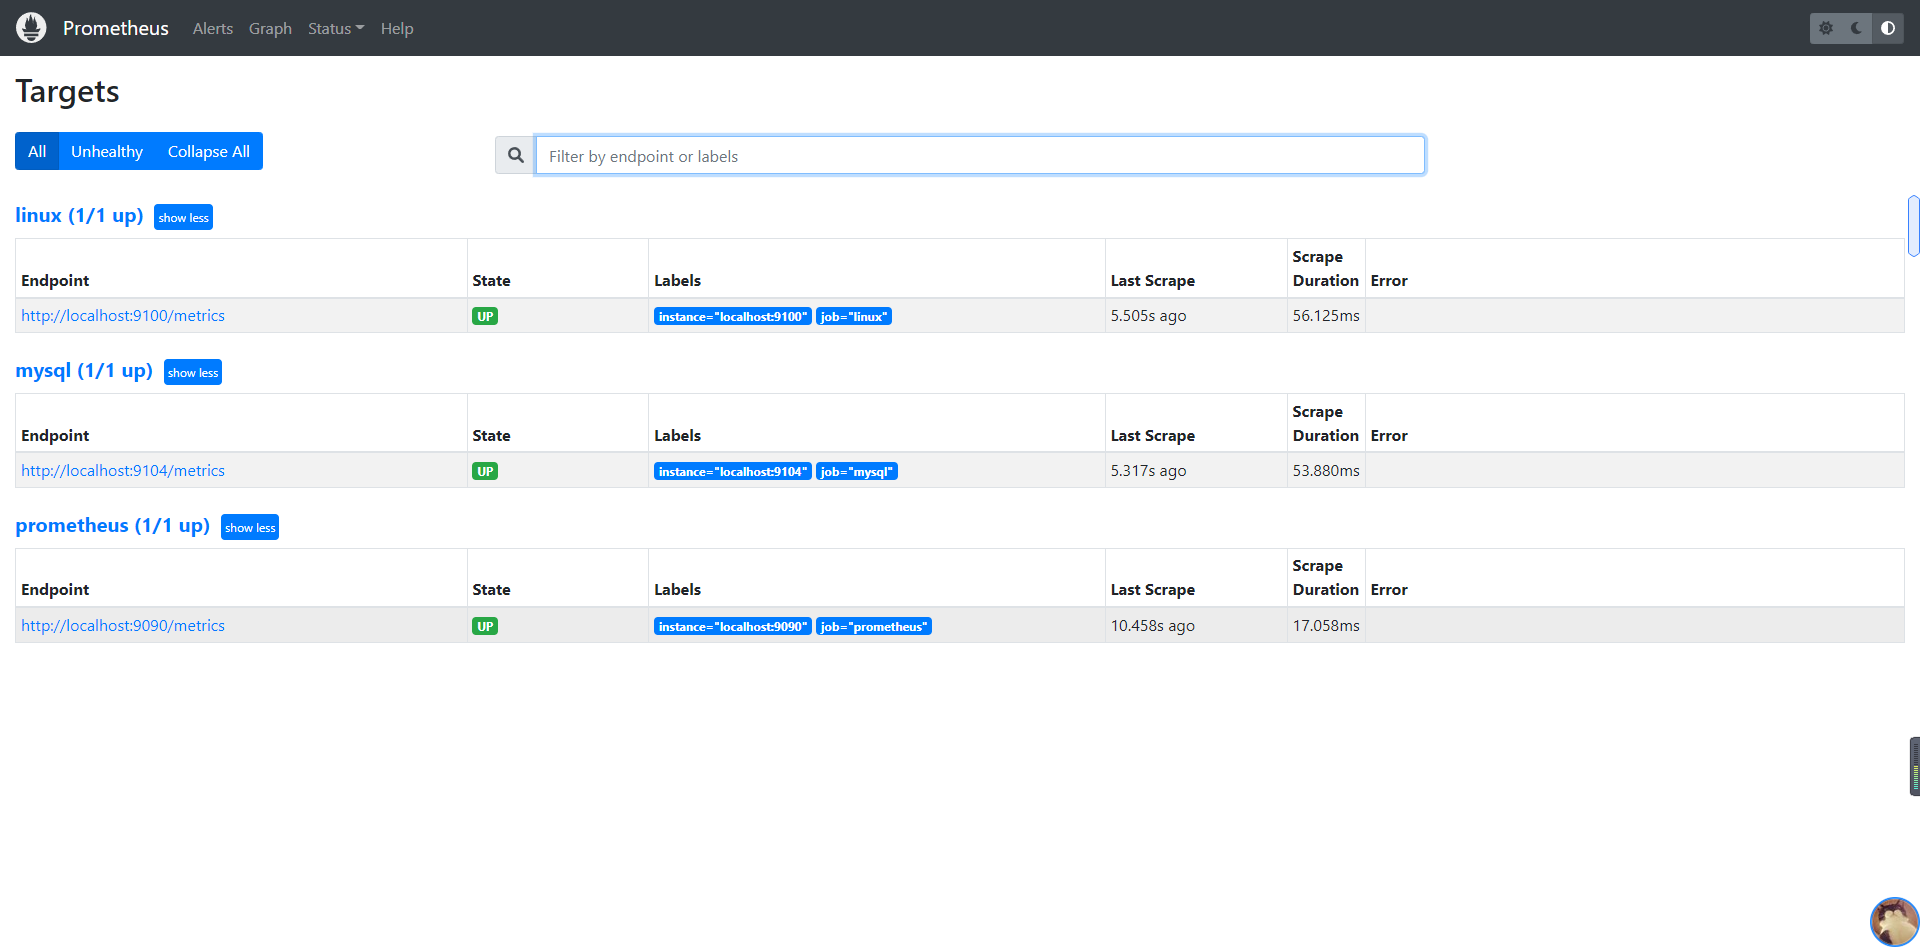
点击Status->Tragets 查看启动情况,在下图中可以看到prometheus已经启动成功
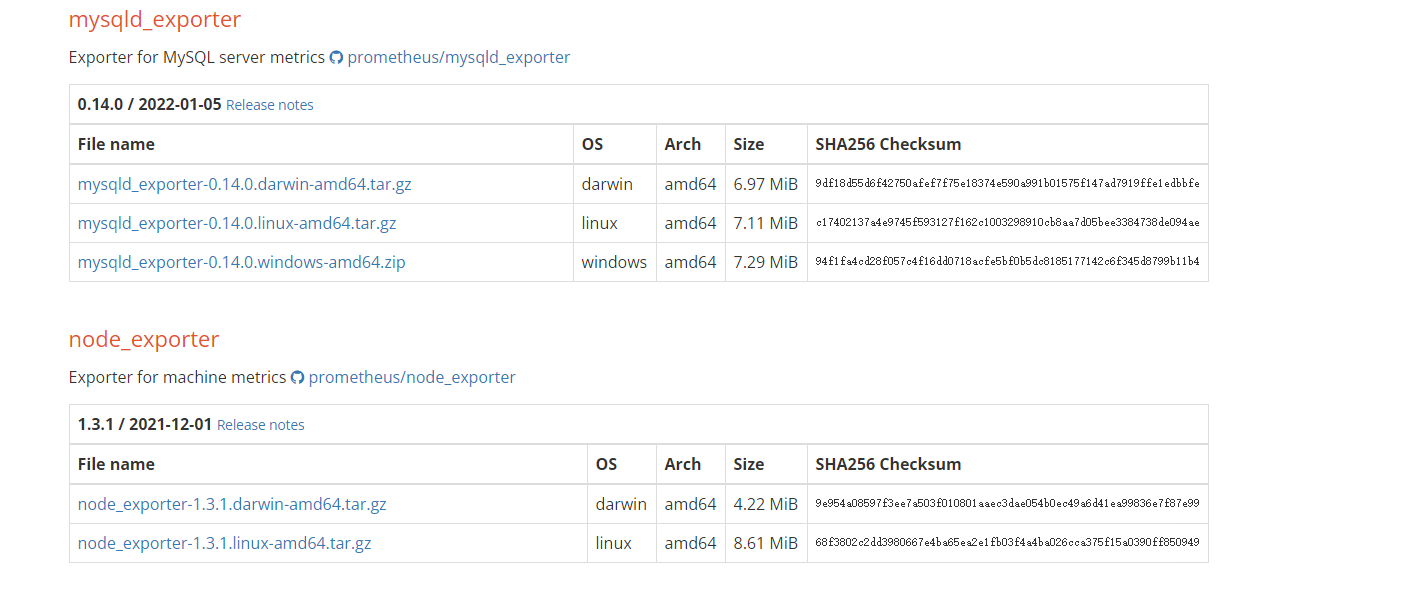
2.搭建mysqld_exporter / node_exporter 用于监控mysql 和 linux
下载监控插件:https://prometheus.io/download/ 根据系统下载 mysqld_exporter / node_exporter 使用xftp上传到系统中
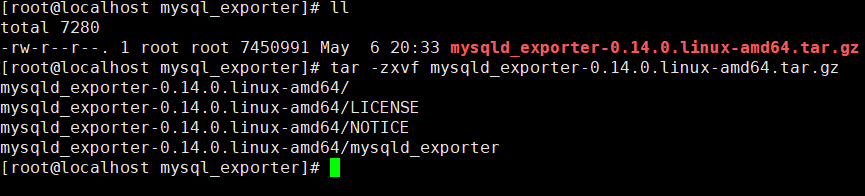
mysqld_exporter搭建
解压文件:#tar -zxvf mysqld_exporter-0.14.0.linux-amd64.tar.gz
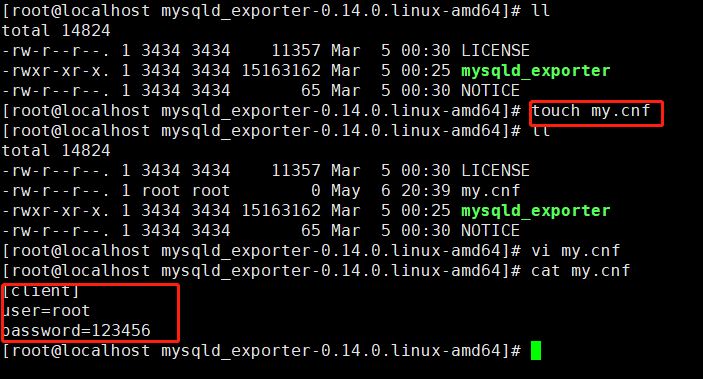
在安装目录内新建my.cnf文件:#touch my.cnf
内容为mysql的用户名和密码:
[client]
user=root
password=123456
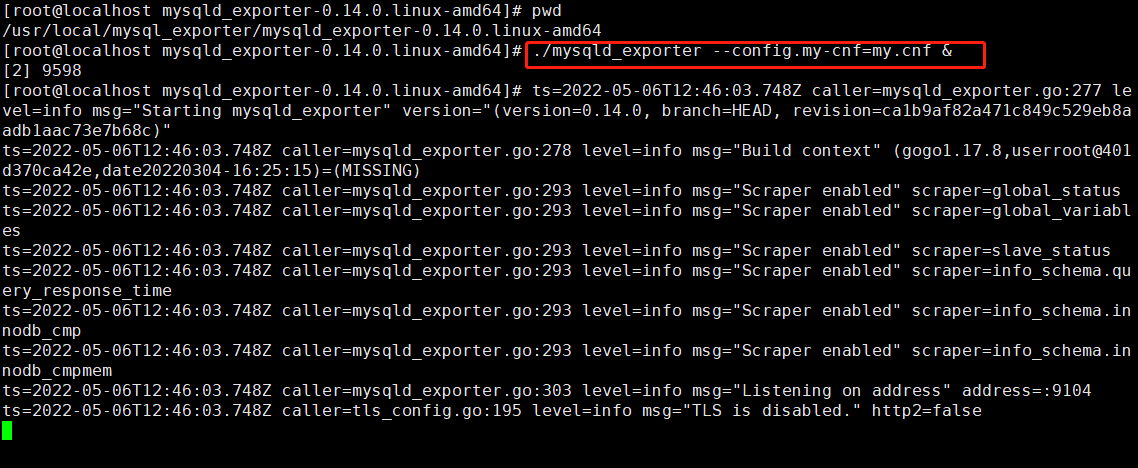
启动监控工具:
再安装目录内启动:#./mysqld_exporter --config.my-cnf=my.cnf &
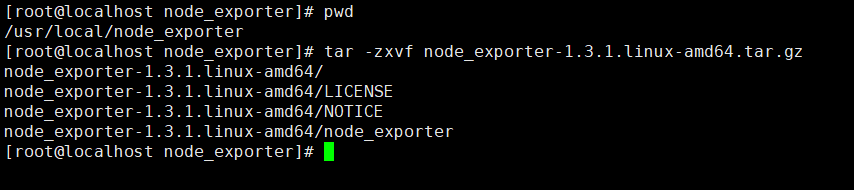
node_exporter搭建
解压文件:tar -zxvf node_exporter-1.3.1.linux-amd64.tar.gz
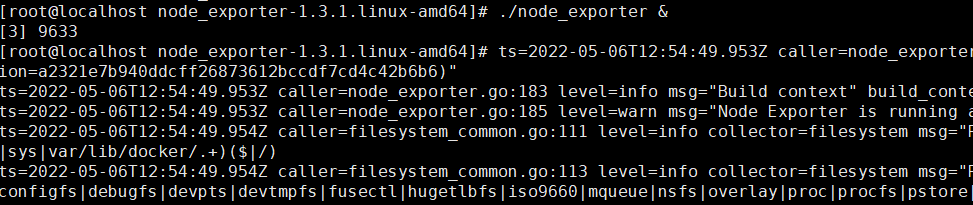
启动node_exporter:
进入目录:cd /usr/local/node_exporter/node_exporter-1.3.1.linux-amd64
执行:./node_exporter &
查看插件状态:
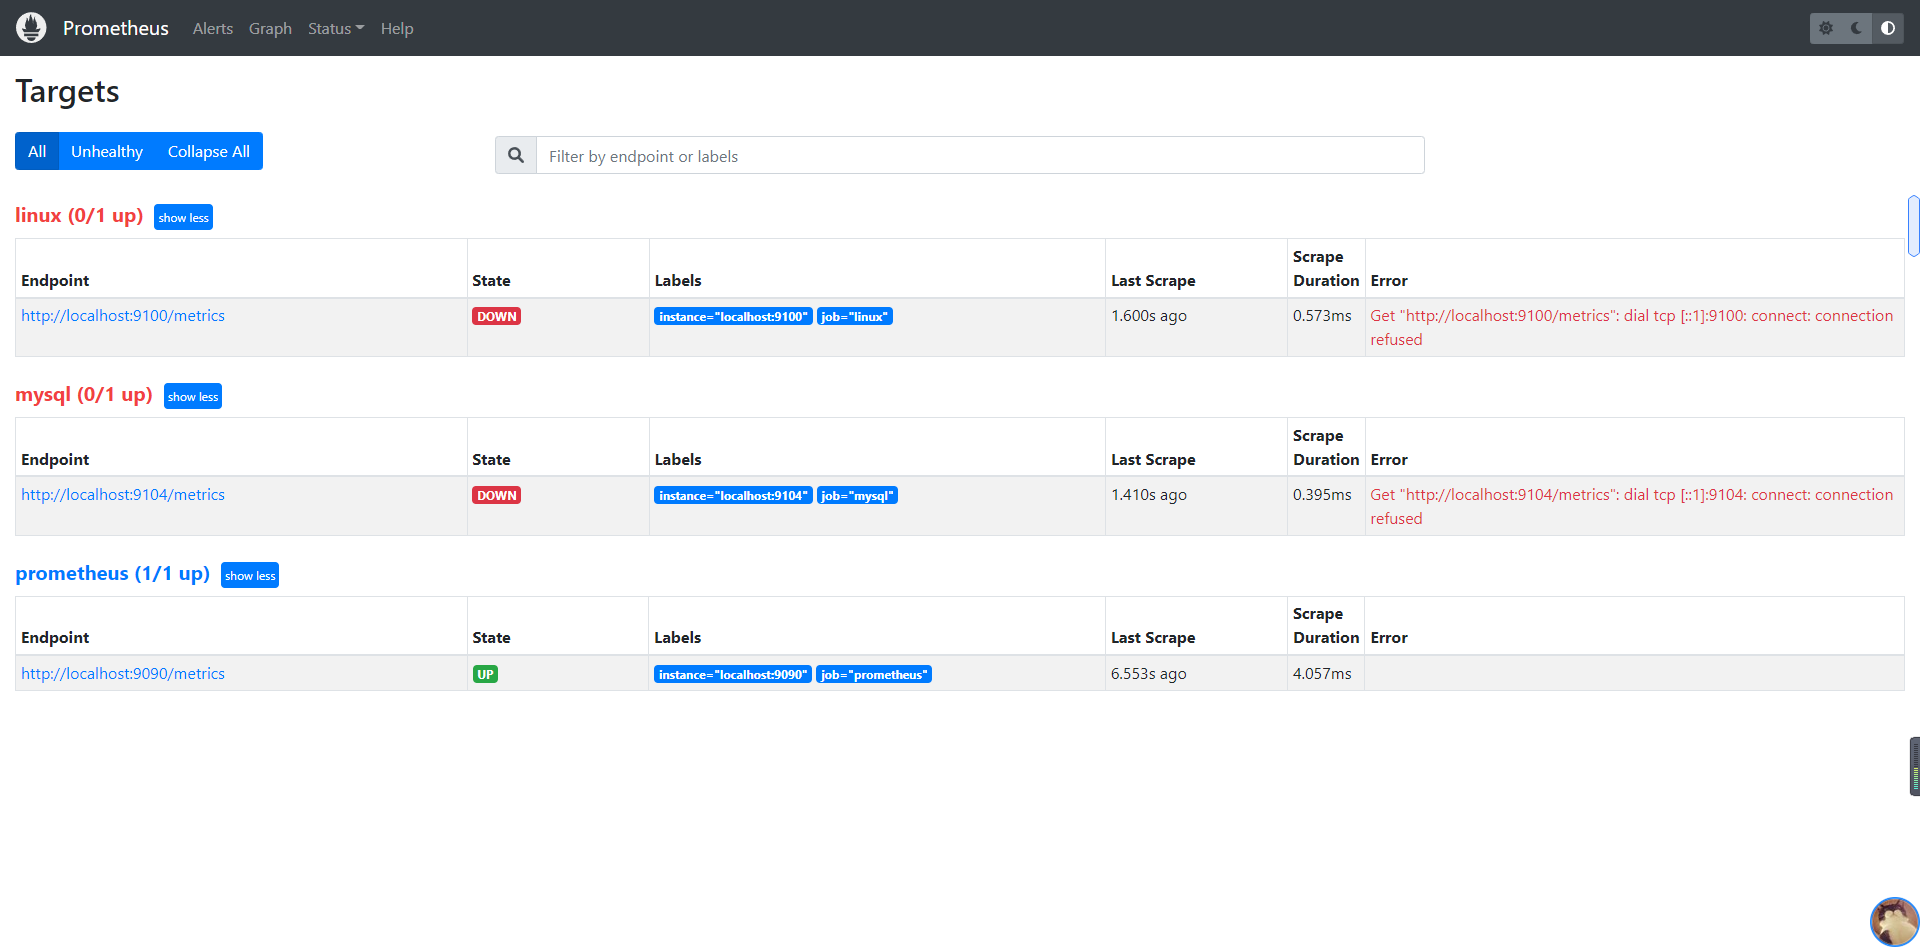
在windows上使用谷歌浏览器登录 http://ip:9090 ip为prometheus所在机器的ip
点击Status->Tragets 查看启动情况,在下图中可以看到两个插件都已经启动成功
3.安装与使用 Grafana
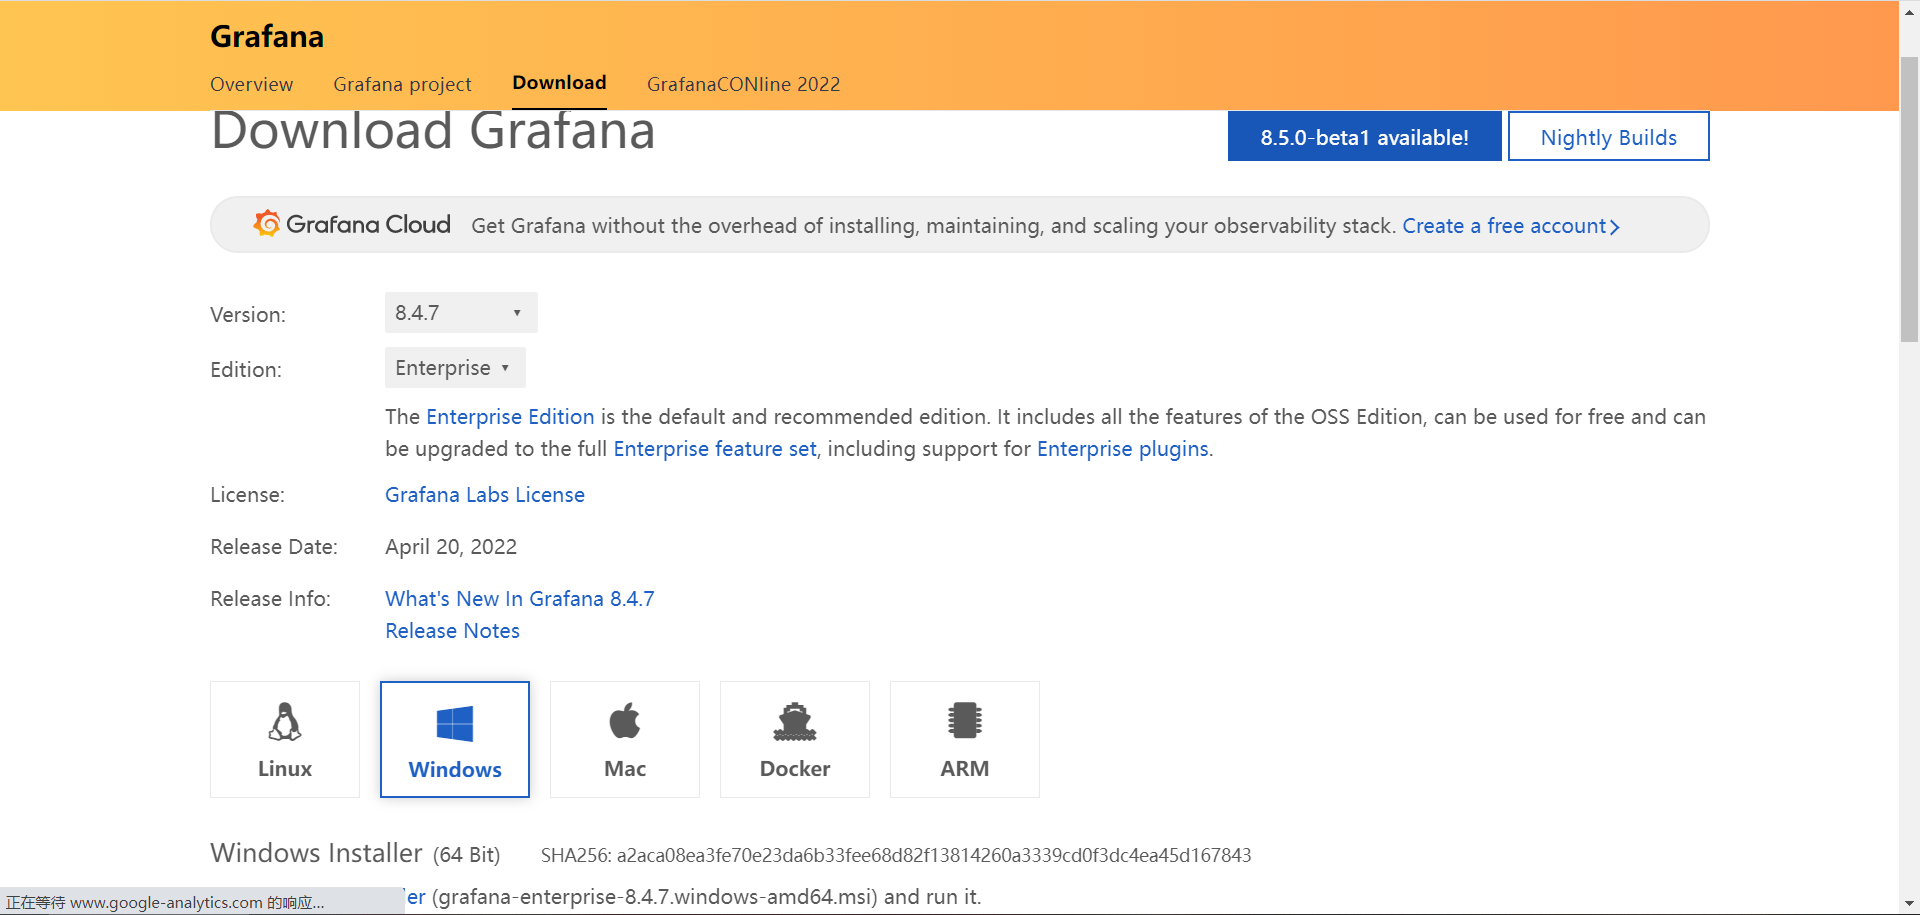
Windows安装
官网地址:https://grafana.com/grafana/download 下载windows版本后运行安装文件 默认安装即可 用户名: admin ,密码 :admin
百度网盘:链接: https://pan.baidu.com/s/1BLPsBDMrnB7aBwSVxyTDWw 提取码: zd8s
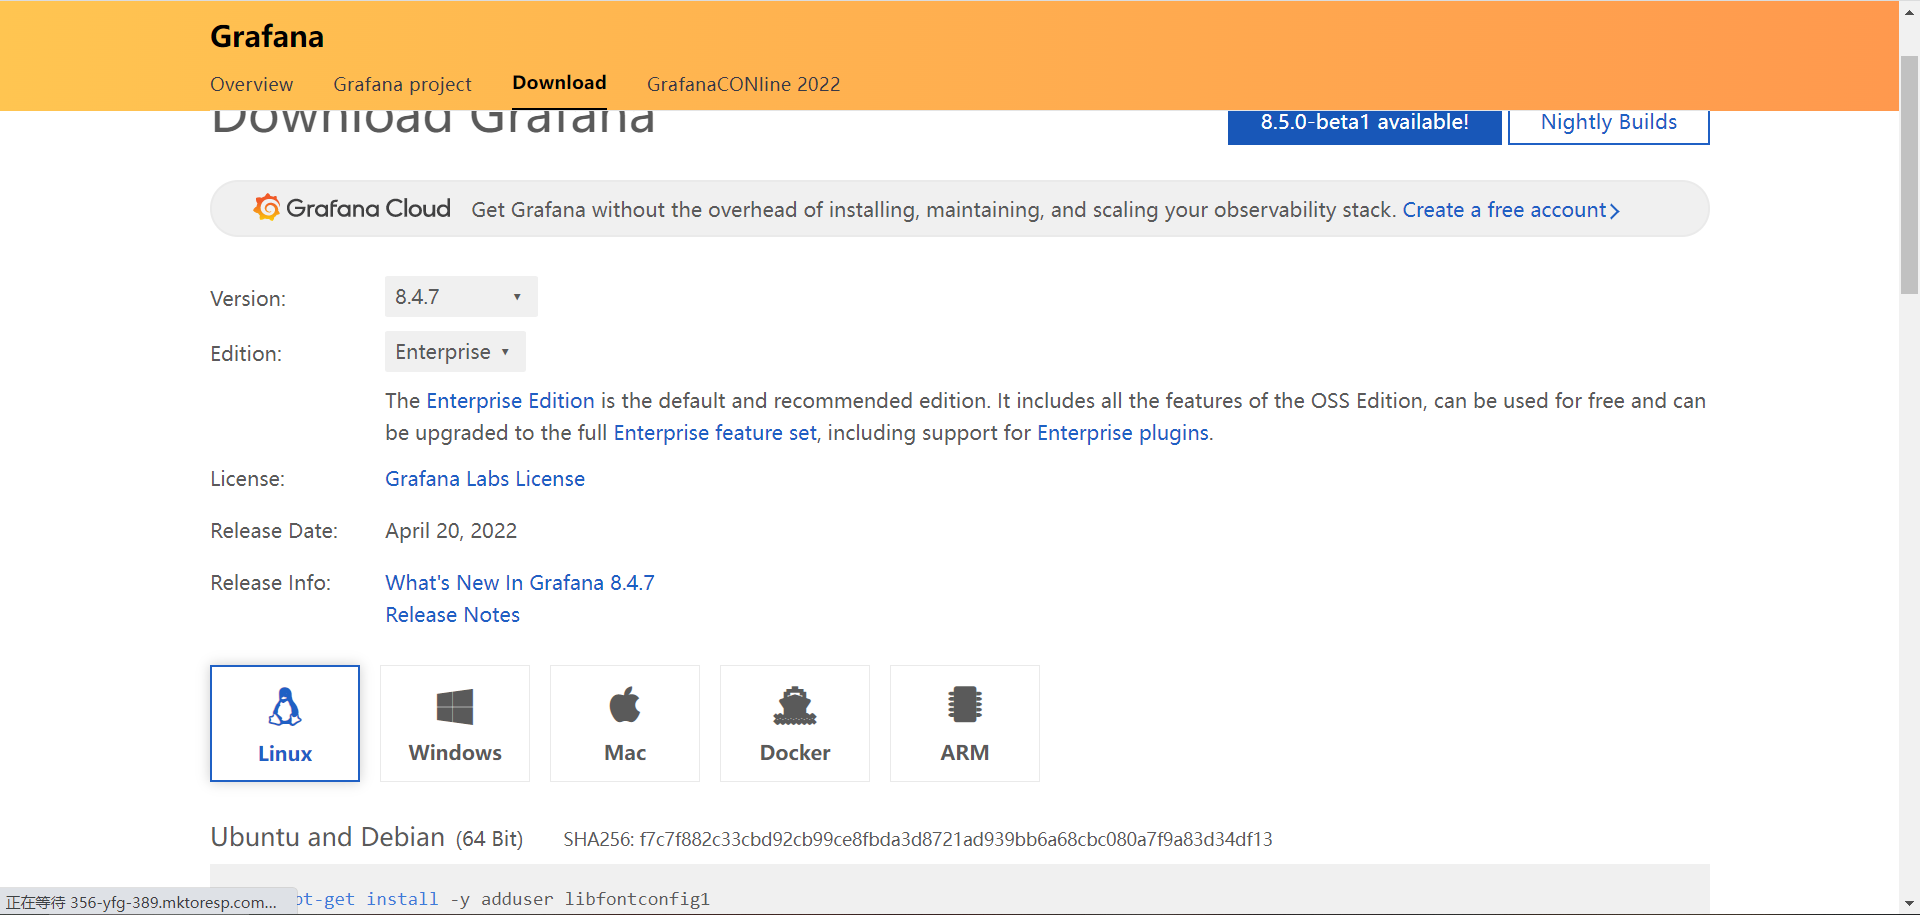
Linux 安装
官网地址:https://grafana.com/grafana/download 找到对应的系统版本 ,使用官网提供的下载命令进行下载 注:查看linux版本的方法 cat /ete/issue
百度网盘:链接: https://pan.baidu.com/s/1gW0AjLv8xKyLwoqKL4ZUqA 提取码: m6es
使用rpm命令进行安装
#rpm -ivh grafana-5.4.2-1.x86_64.rpm 安装
注:如果遇到以下情况
警告:grafana-7.1.4-1.x86_64.rpm: 头V4 RSA/SHA256 Signature, 密钥 ID 24098cb6: NOKEY
错误:依赖检测失败:
fontconfig 被 grafana-7.1.4-1.x86_64 需要
urw-fonts 被 grafana-7.1.4-1.x86_64 需要
使用yum install-y ontconfig,yum install-y urw-fonts,如果yum安装不行的话,找个可上网的服务器 yum install yum-utils 而后 yumdownloader <package-name> 便可
启动Grafana
windows启动
进入到安装目录,默认安装路径:C:\Program Files\GrafanaLabs\grafana\bin,双击运行grafana-server.exe即可
linux启动
#systemctl start grafana-server 或 #service grafana-server start 启动grafana
查看防火墙
#systemctl stop firewalld 关闭防火墙
#systemctl status firewalld 查看防火墙状态
使用 Grafana
① 打开浏览器 访问 http://ip:3000 ip为Grafana所在电脑ip
② 输入账号amdin,密码 admin
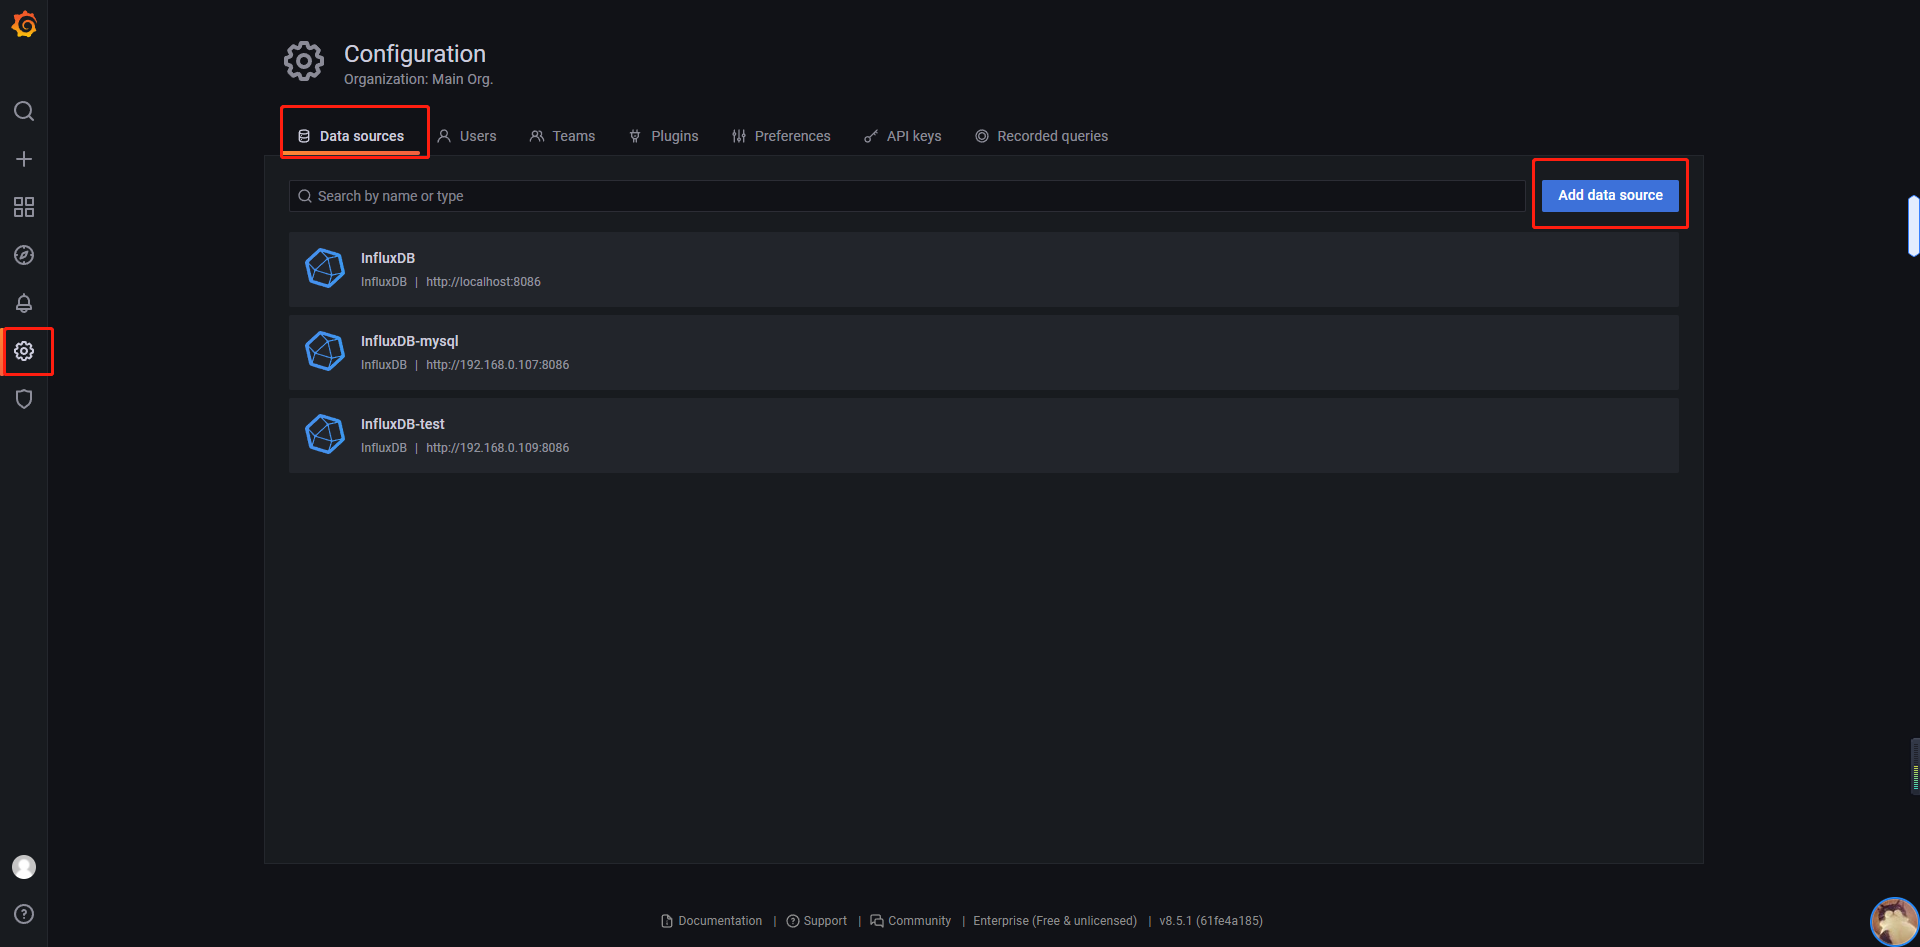
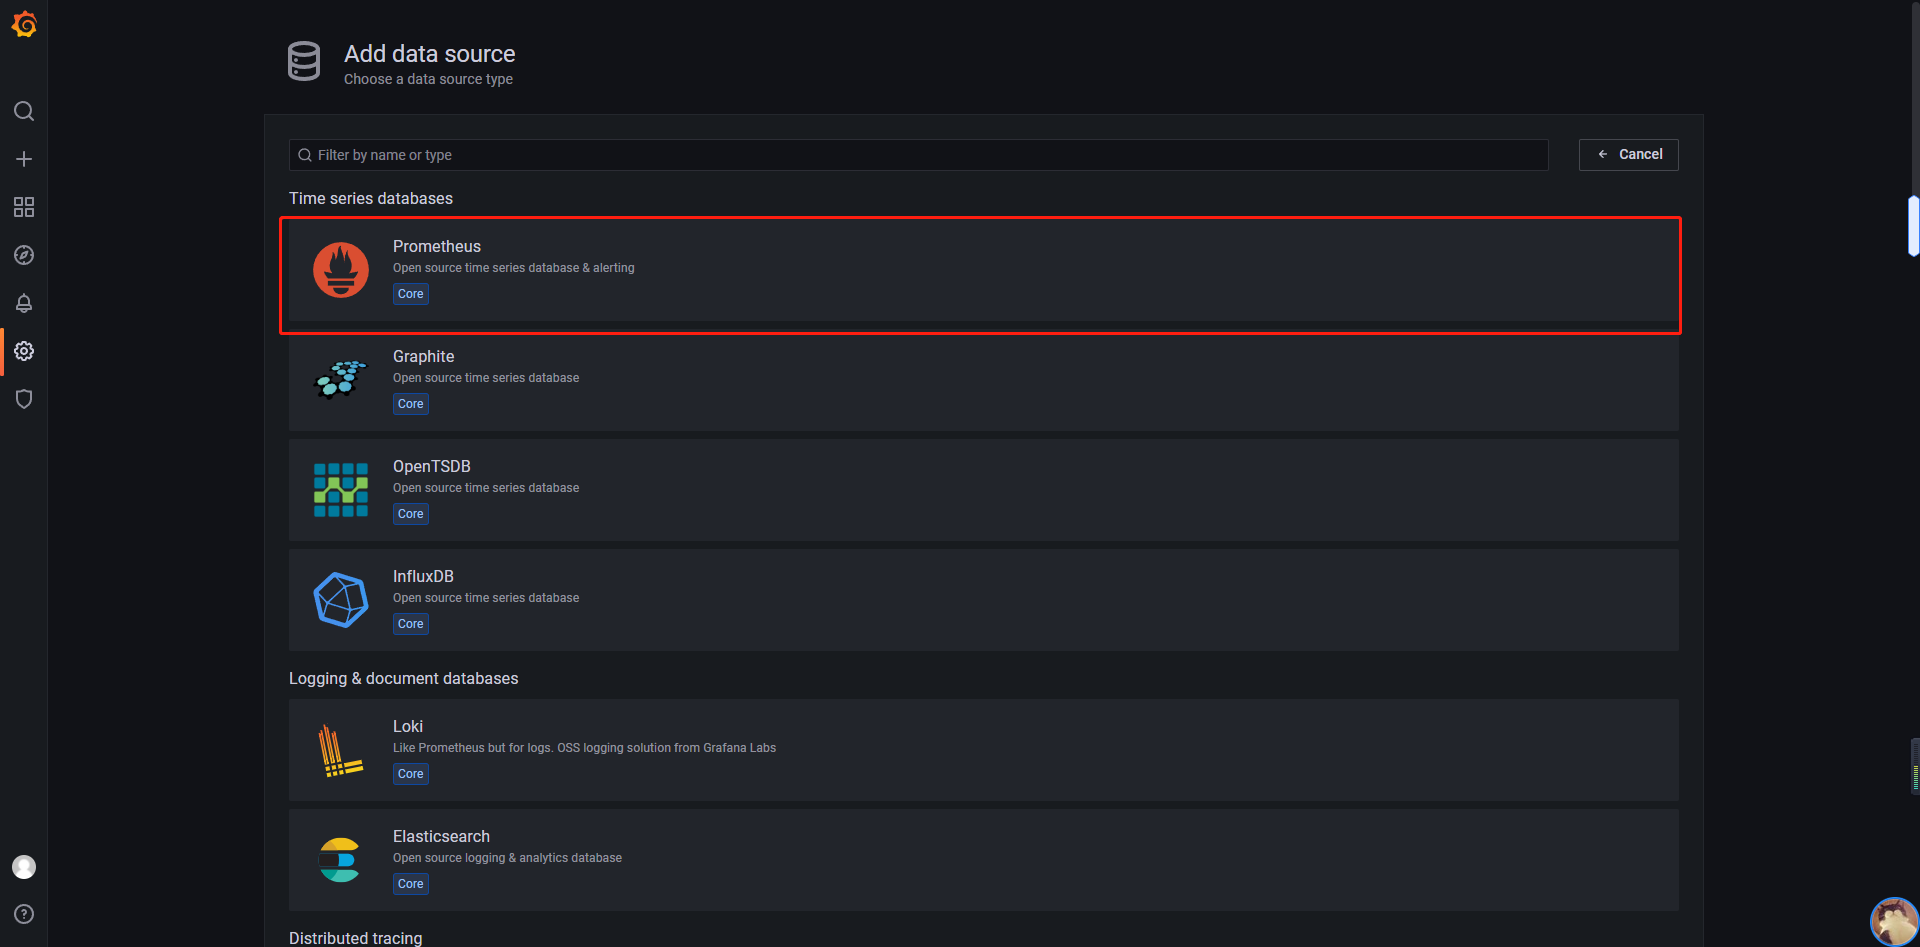
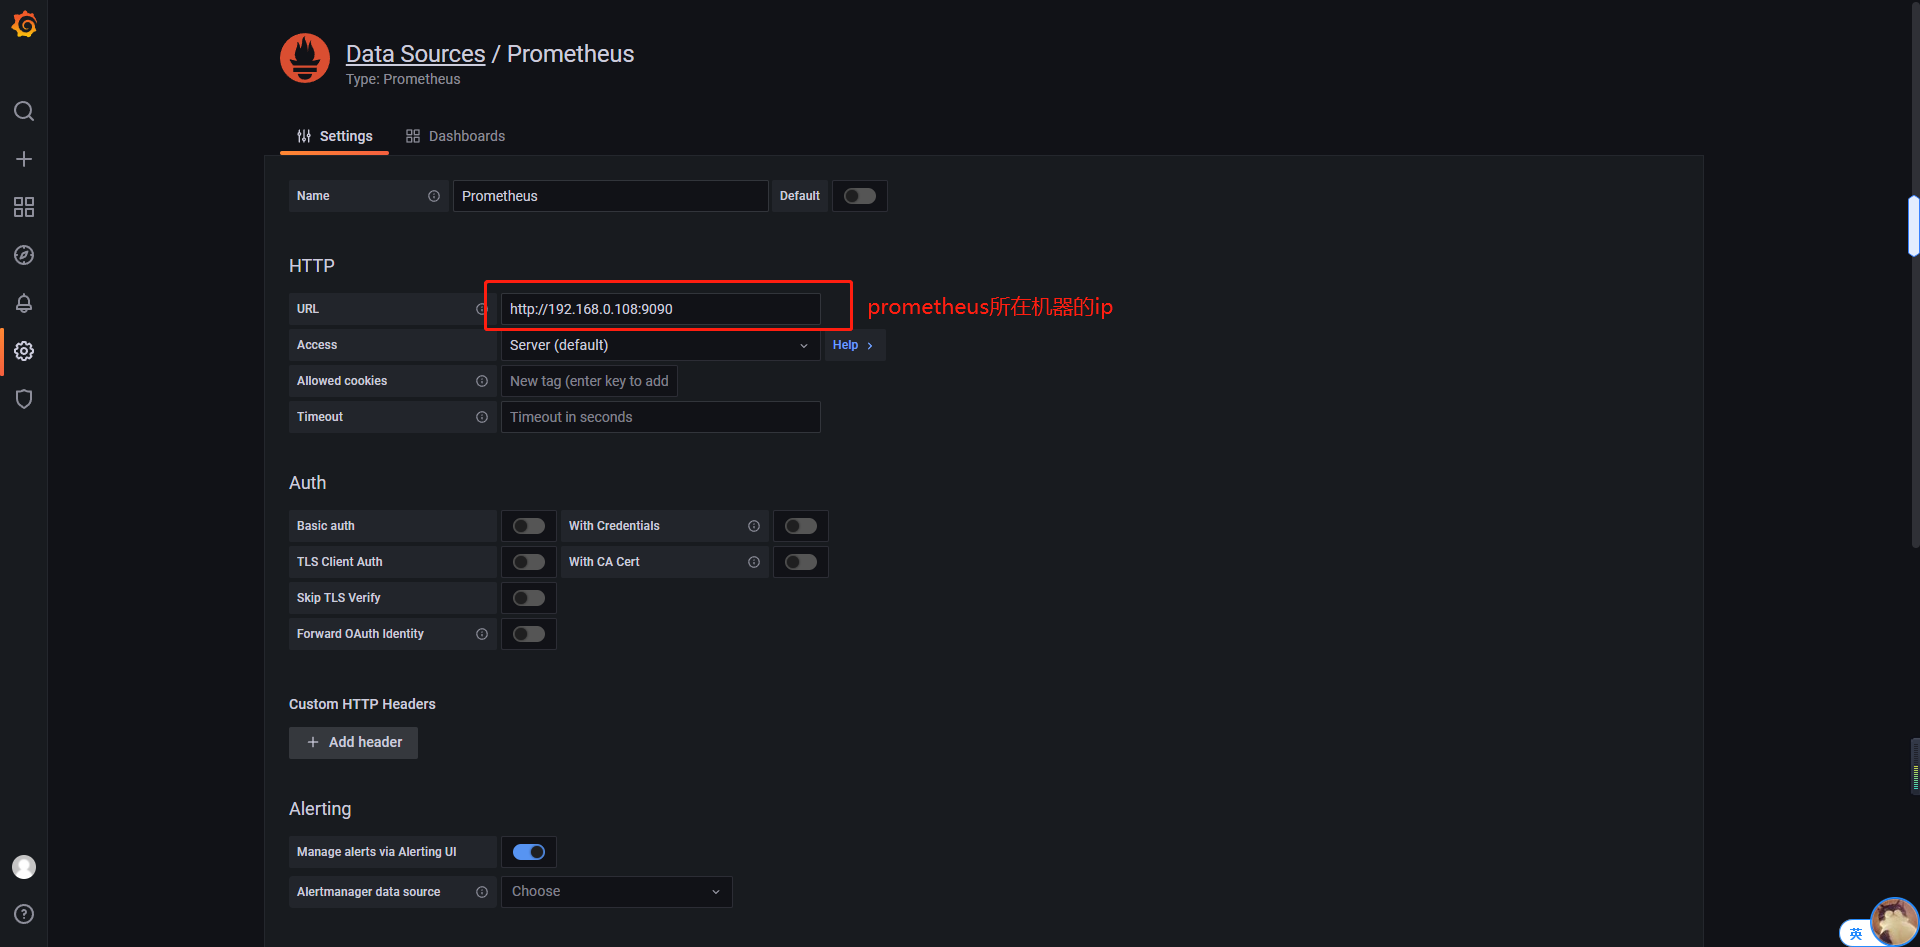
③ 新建 data sources
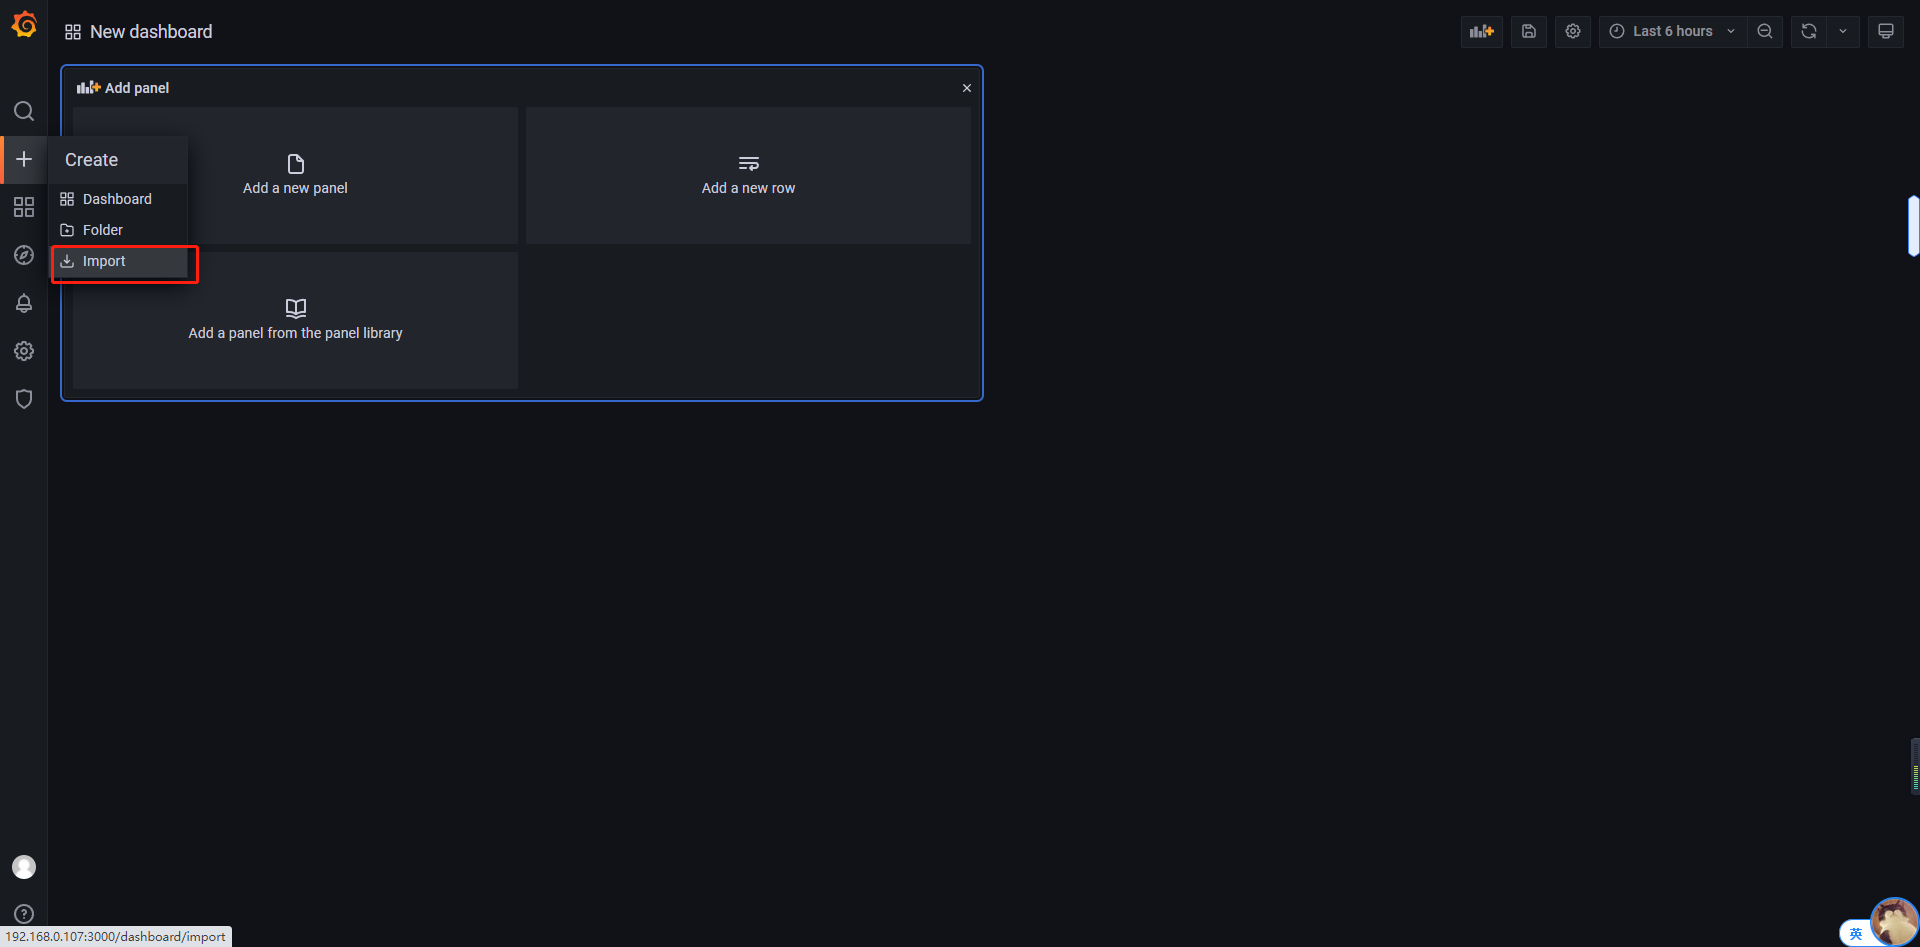
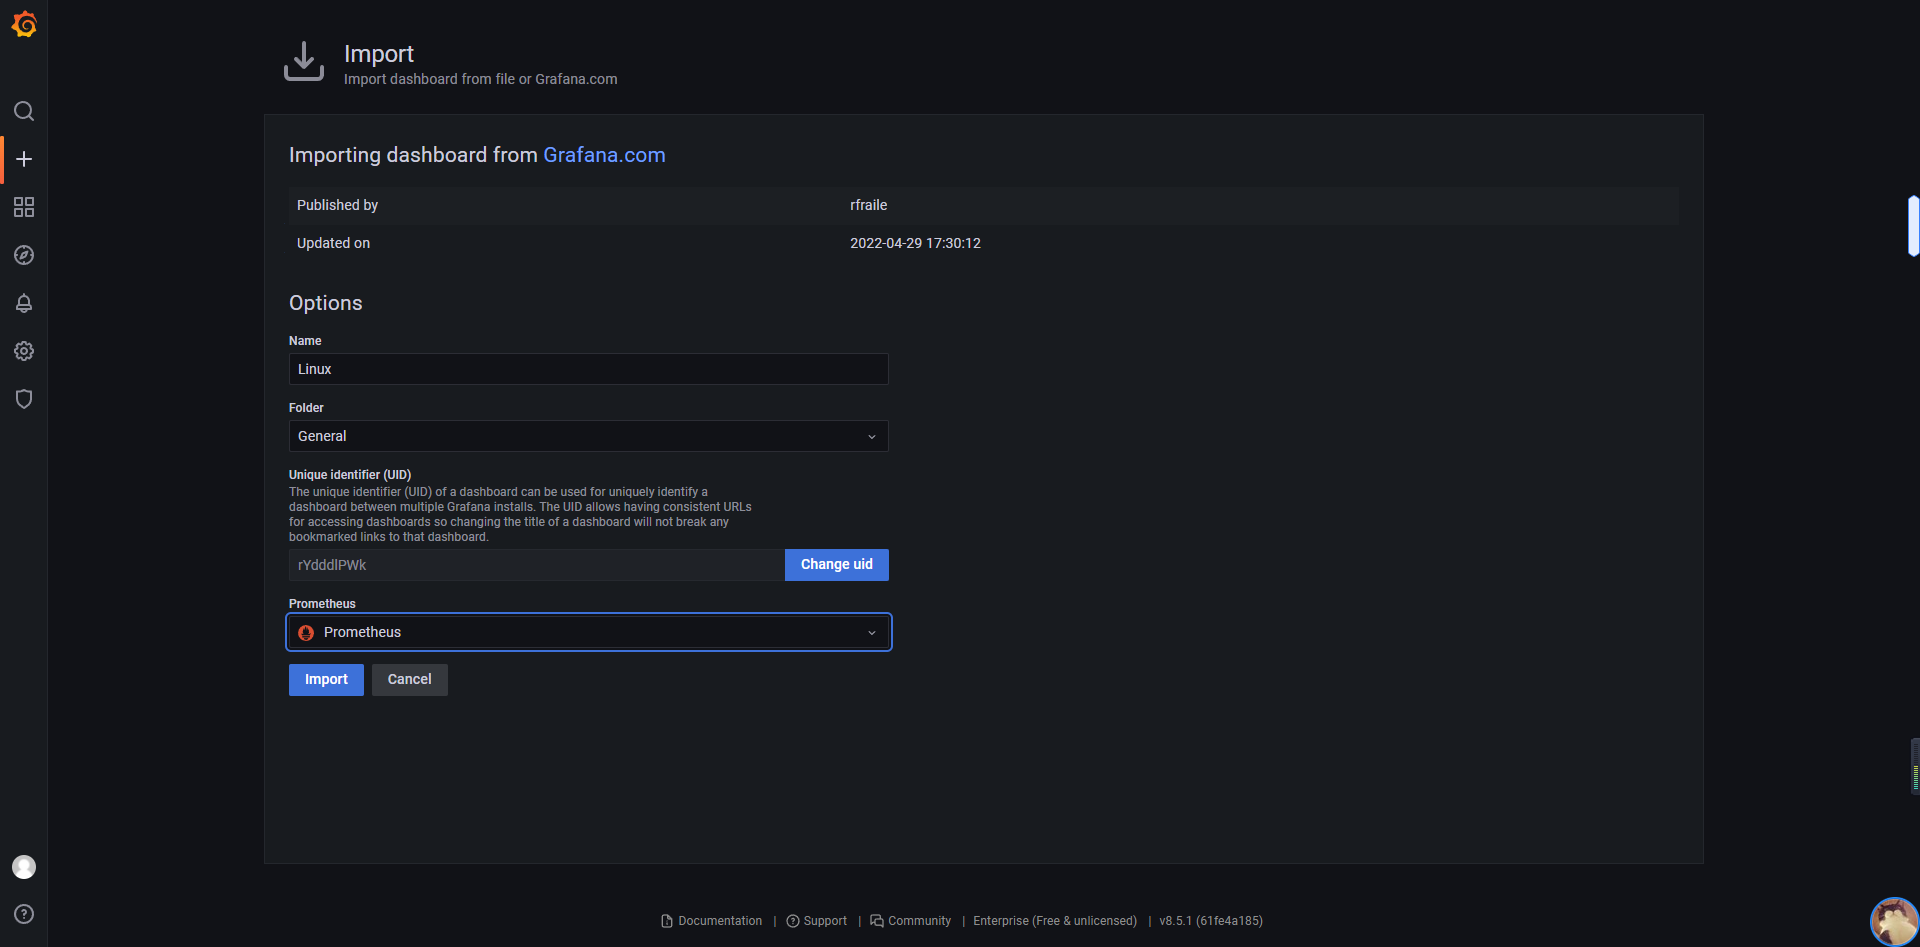
④导入仪表盘:mysql仪表盘编号:6239 linux仪表盘编号:1860
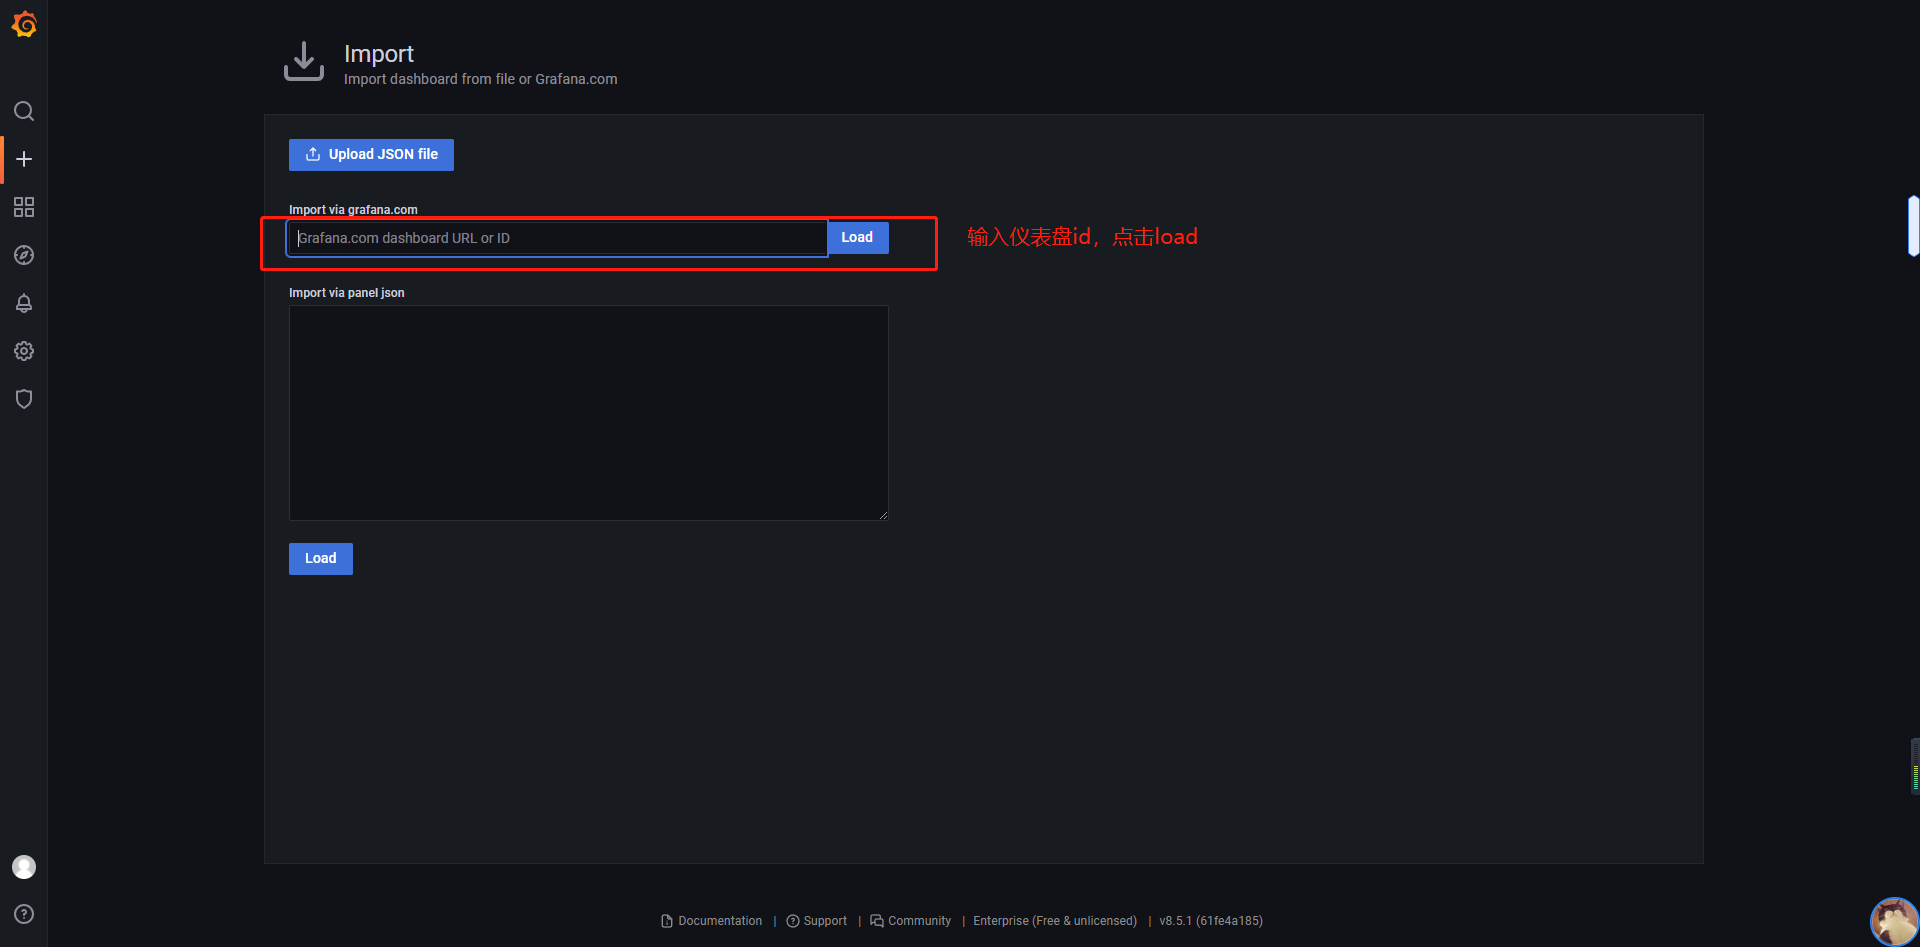
⑤配置仪表盘名称和数据源,配置完成后点击import
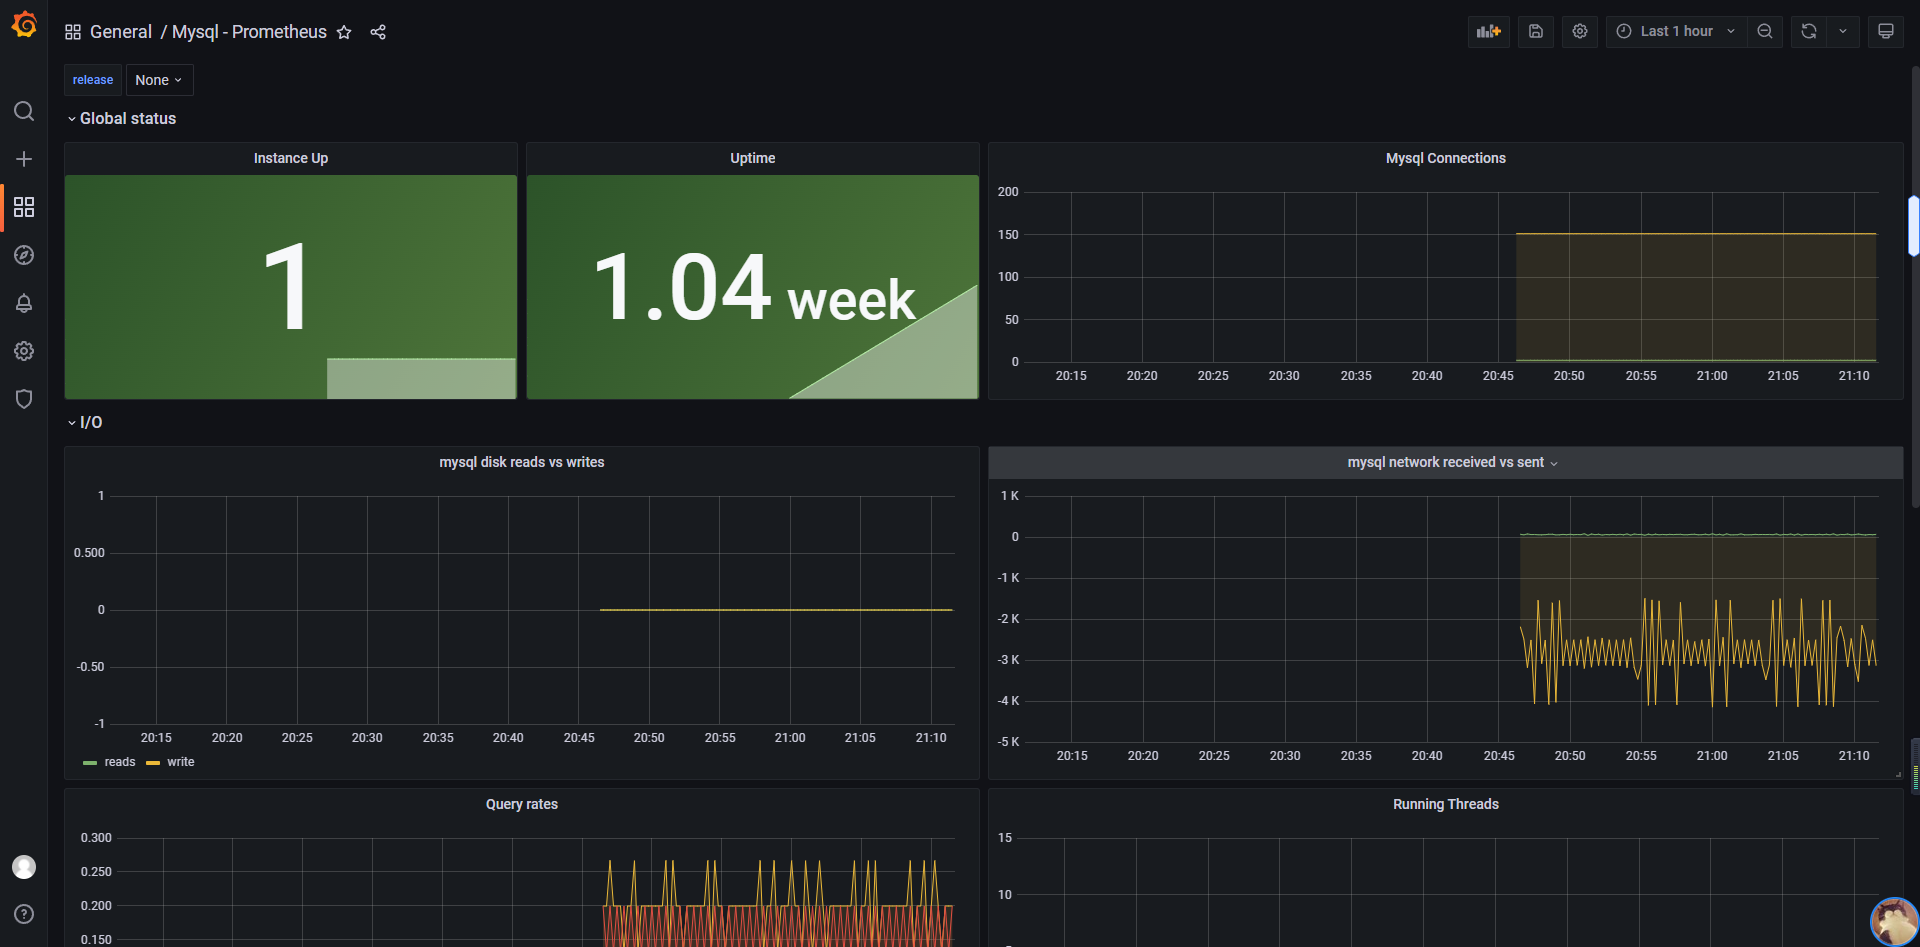
以下是搭建成功后的样子
mysql
linux

