
Telegraf + Influxdb + Grafana 监控服务器资源搭建方法
一.Telegraf
1.下载安装
# 安装方法
1.使用安装最新稳定版本的Telegrafyum包管理器:
cat <<EOF | sudo tee /etc/yum.repos.d/influxdb.repo
[influxdb]
name = InfluxData Repository - Stable
baseurl = https://repos.influxdata.com/stable/\$basearch/main
enabled = 1
gpgcheck = 1
gpgkey = https://repos.influxdata.com/influxdb.key
EOF
2.将存储库添加到后,安装telegraf配置:
sudo yum install telegraf
也可以自己去官网选择自己需要的版本 https://portal.influxdata.com/downloads/
# 启动命令
#systemctl start telegraf
# 重启命令
#systemctl restart telegraf
2.修改配置
输入命令 # vim /etc/telegraf/telegraf.conf ,修改内容如下:
[[outputs.influxdb]]
urls = ["http://localhost:8086"] # influxdb 所在的地址
database = "telegraf" # 存储telegraf 收集数据的数据库名字
retention_policy = ""
precision = "s" #收集频率
timeout = "5s" #超时时间
username = "telegraf" #influxdb 用户名
password = "123456" #influxdb密码
[agent]
logfile = "//etc/telegraf/telegraf.log" #日志输出位置
二. Influxdb 和 Grafana
1.安装及配置:https://www.cnblogs.com/zxqtest2020/p/13792451.html
需要在配置的时候做对应的修改:
1.在influxdb配置步骤中将新建的数据库名称 设置为 telegraf 数据库账户密码设置为与telegraf一致。
2.在Grafana配置步骤中将新建的数据源(Data Sources)的时候influxdb对应的配置,对于数据显示模板需要你自己配置了,或者去网上找大神做好的模板。
补充知识:Telegraf 监控 mysql
1.在 /etc/telegraf/telegraf.d/目录下新建 Telegraf-mysql.conf. 文件,内容为:
[[inputs.mysql]]
servers = ["root:root@tcp(localhost:3306)/?tls=false"] #括号内为mysql所在地址和端口
name_suffix = "_mysql"
[[outputs.influxdb]]
database = "mysql_metrics" #influxdb内保存mysql监控数据的数据库
urls = ["http://localhost:8086"] #方括号内为influxdb的地址和端口
namepass = ["*_mysql"]
username = "telegraf_mysql"
password = "123456"
2.重启influxdb:systemctl restart telegraf.service
3.在influxdb中创建库:mysql_metrics;创建对应的用户名和密码:telegraf_mysql/123456
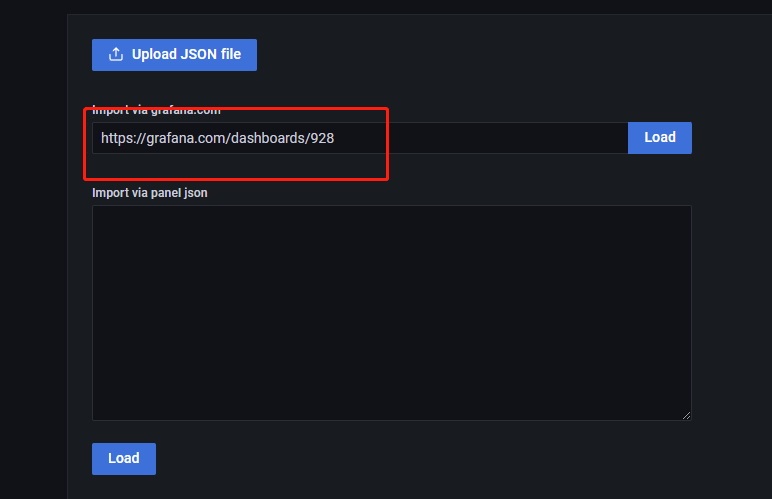
三. grafana监控服务器资源面板:https://grafana.com/dashboards/928直接复制到load中
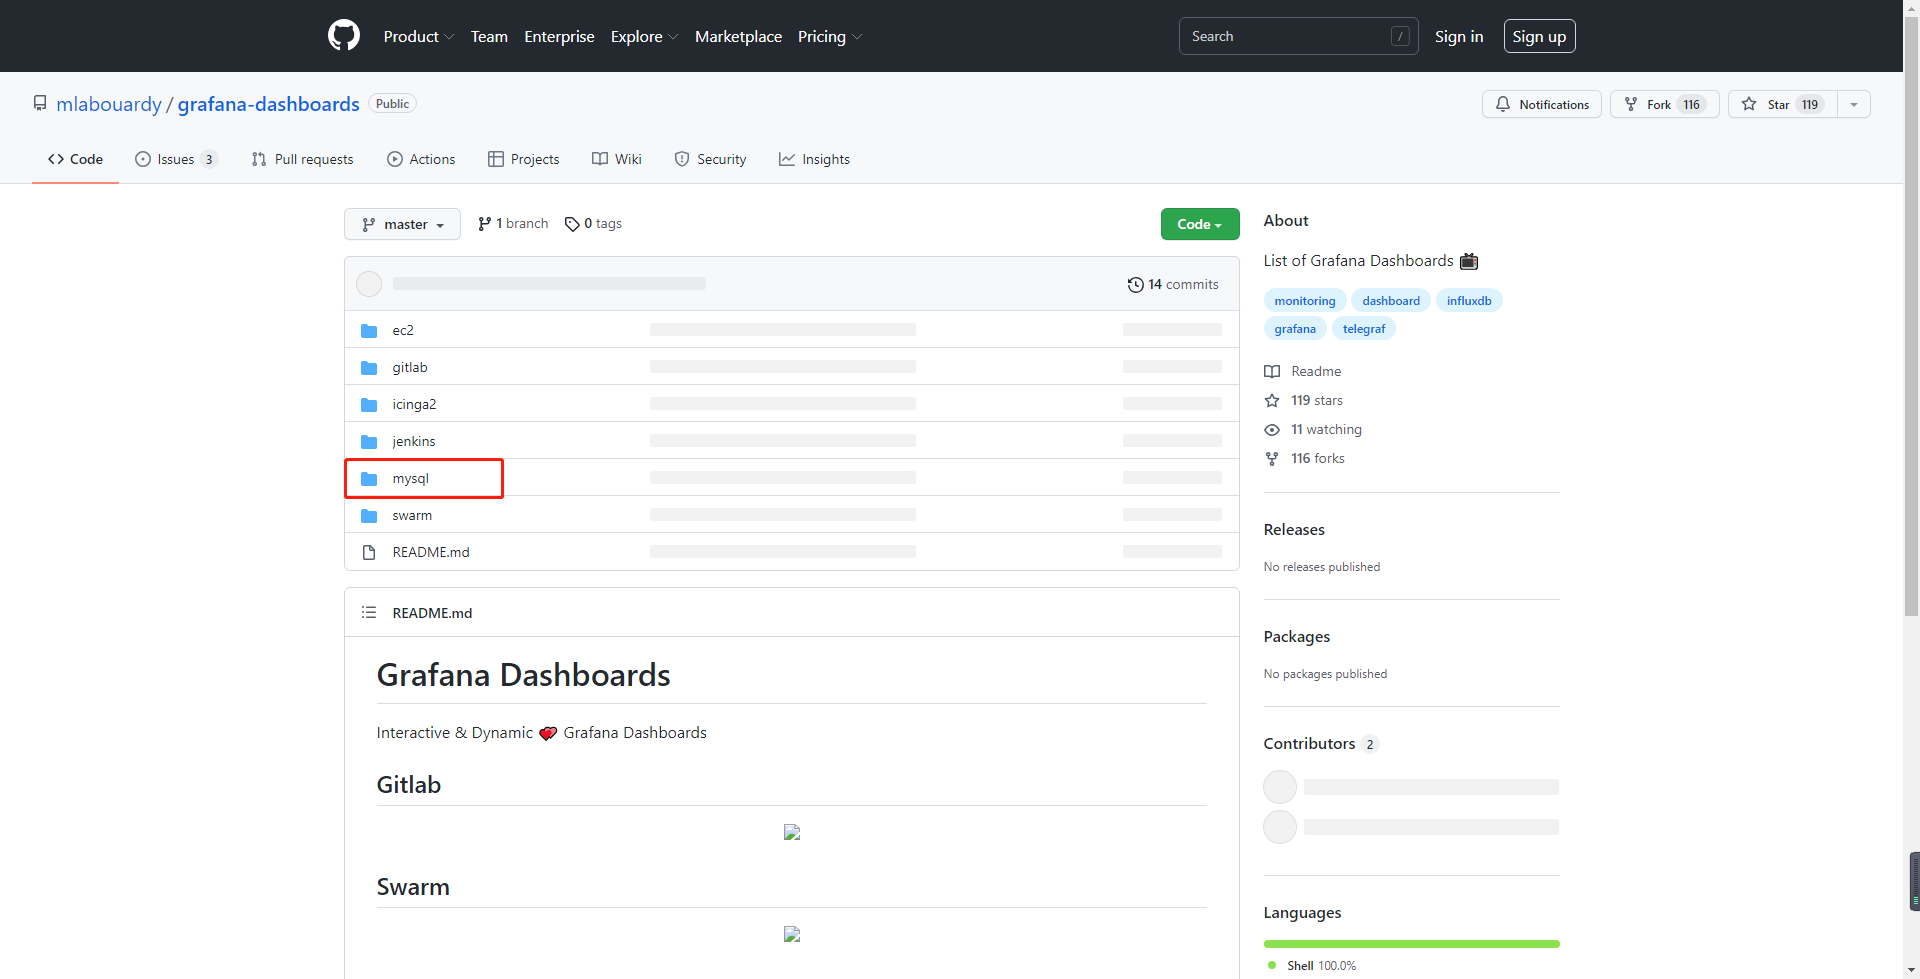
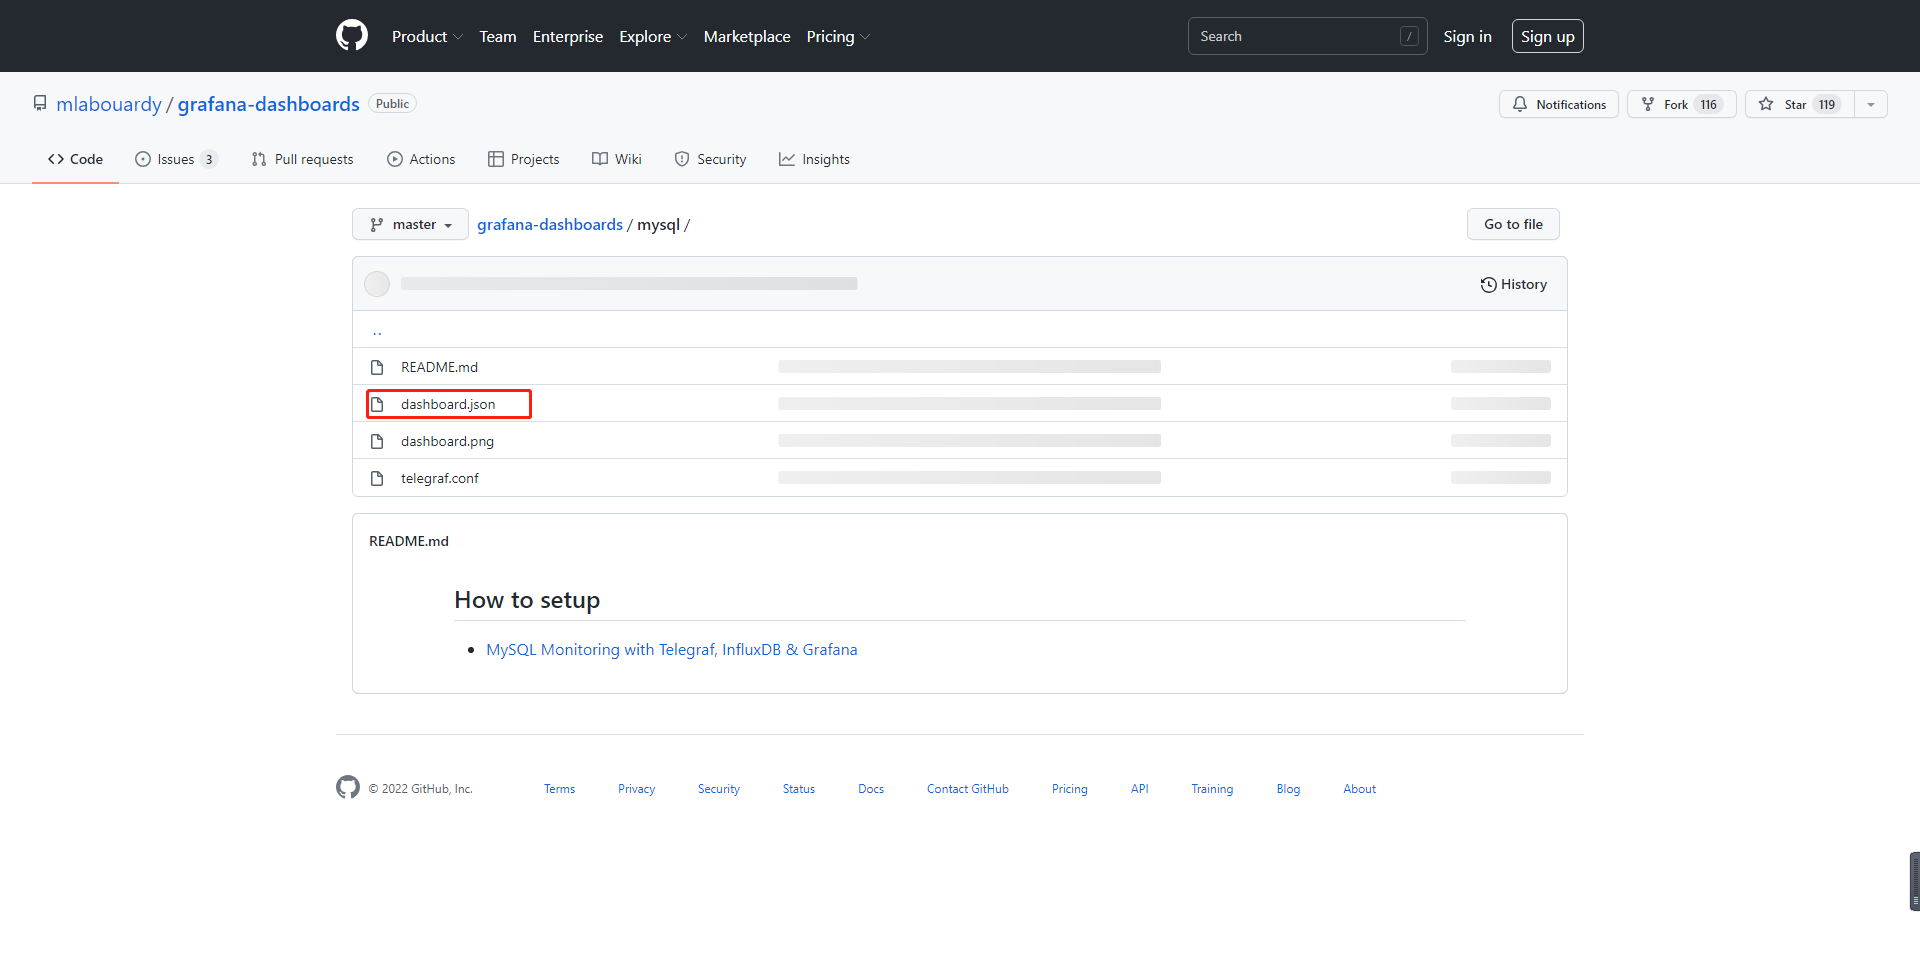
附grafana监控mysql的模板:

 浙公网安备 33010602011771号