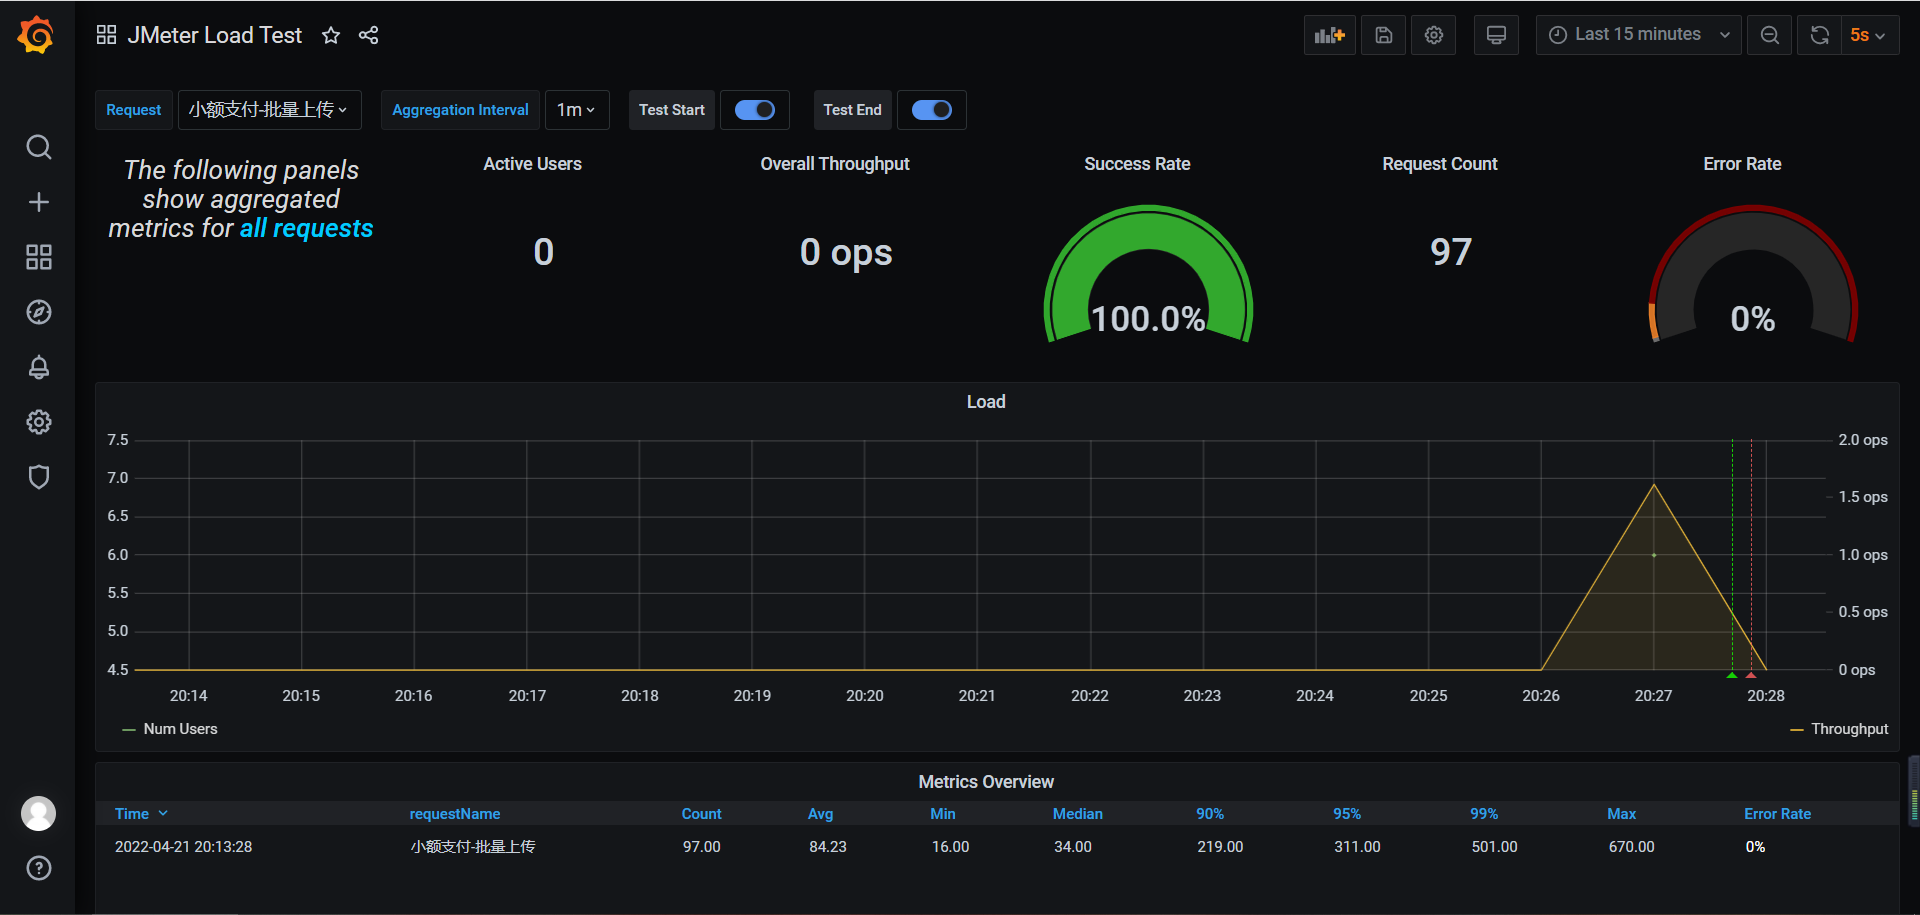
Jmeter + Influxdb + Grafana 性能监控搭建
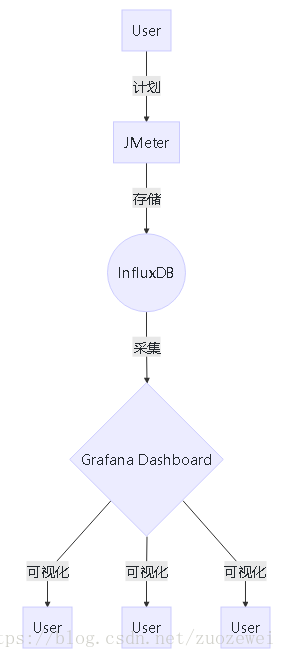
工作原理:Jmeter在压测的同时,使用后端处理器(Backend Listener)将数据写到Influxdb数据库中,Grafana从Influxdb数据库中获取数据并显示。
工作流程:
1.JDK安装:https://www.cnblogs.com/zxqtest2020/p/13792484.html
2.Jmeter安装:https://www.cnblogs.com/zxqtest2020/p/13792533.html
需要使用的Jmeter插件JMeter-InfluxDB-Writer-1.0:链接:https://pan.baidu.com/s/1pLOLJLT2XKEH7hx_h8HC4w 提取码:k720
下载后将此文件放置的Jmeter安装目录下的\lib\ext中,重启Jmeter
后端处理器添加方法:
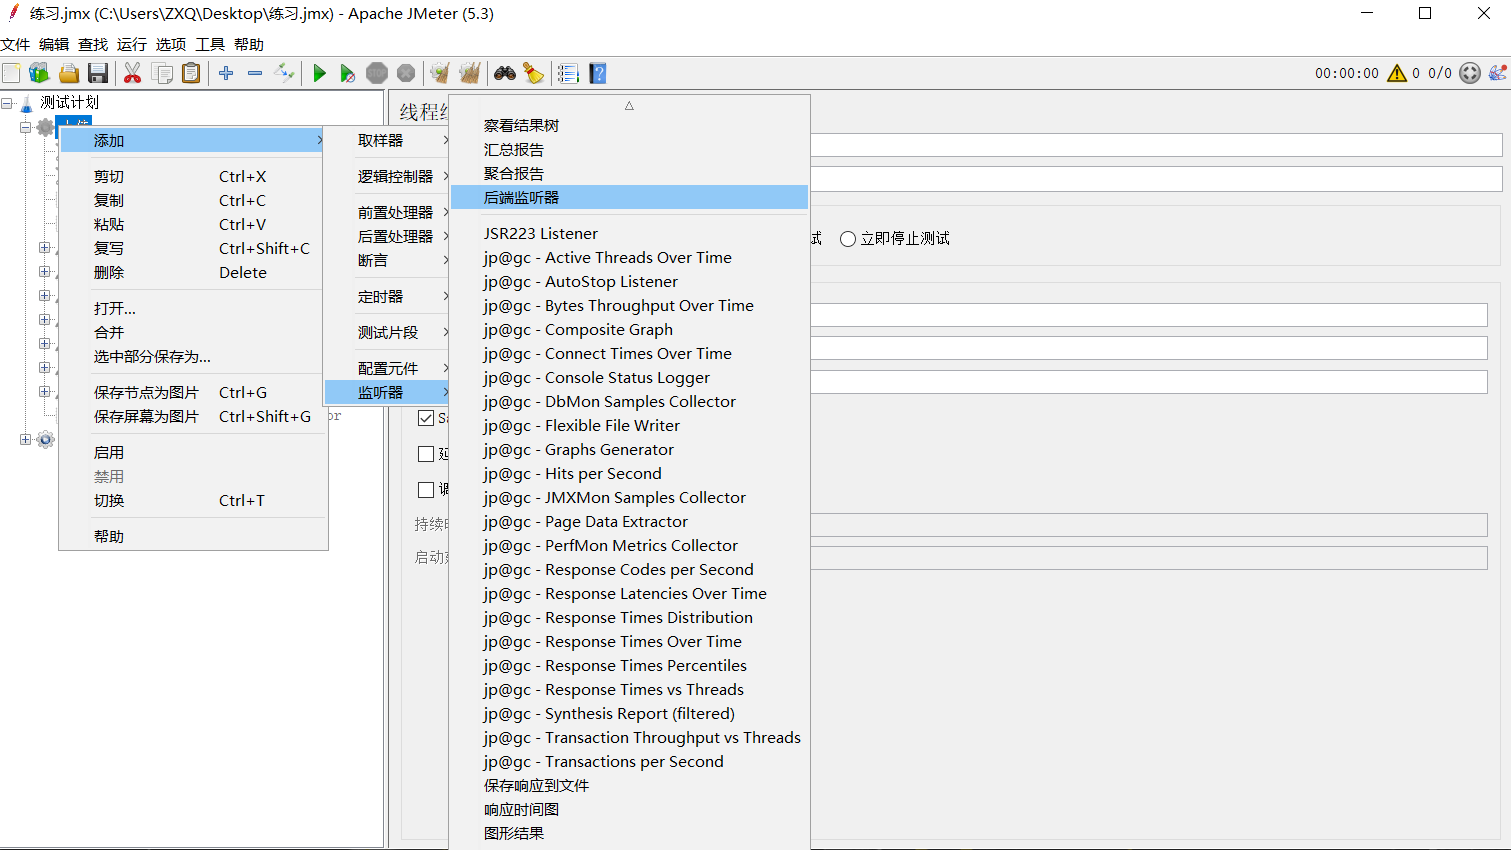
后置处理器配置方法:
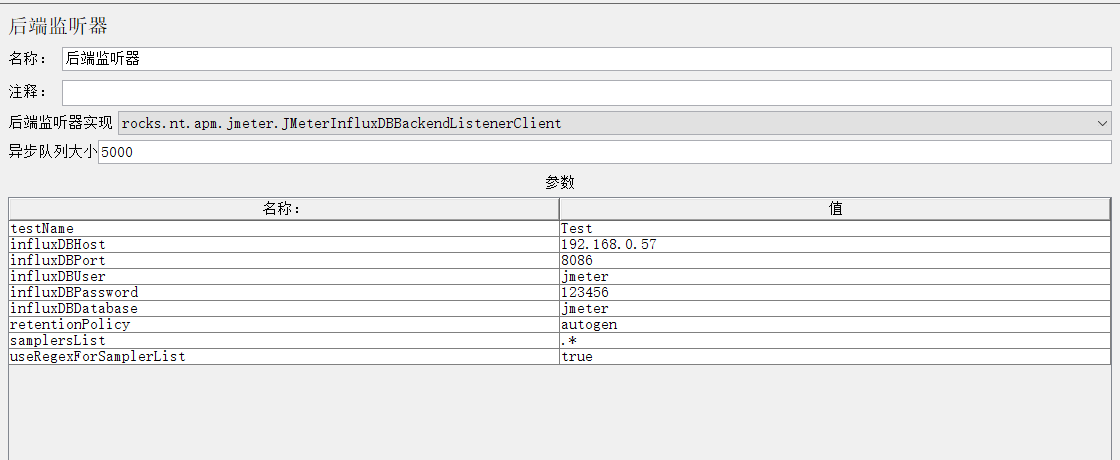
后端监听实现:我试过用其它的2个选项,数据虽然写到了Influxdb中,但是Grafana拿不到数据,选择了红框中的的选项后可以拿到。
Influxdbhost:influx数据库所在的电脑 IP
Influxdbport:8086
influxdbuser:写入数据时使用的用户
influxdbpassword:写入数据时使用的密码
influxdbdatabase:数据写入的数据库
3.Influxdb安装:
Windows安装
① 下载地址:https://portal.influxdata.com/downloads/ 下载对应的操作系统版本
② 解压并修改配置文件 :influxdb.conf
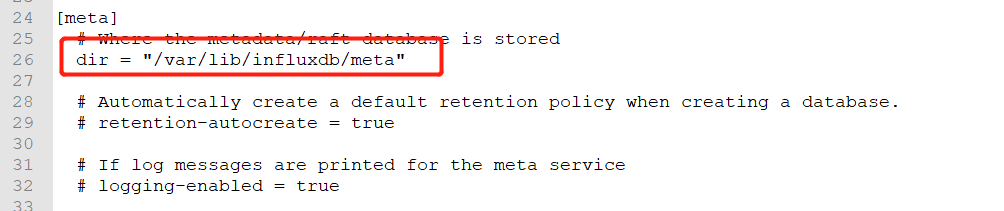
指定数据库存放的数据位置
如果是windows操作系统,则把红框中内容注释,写入存放路径:如 dir = "C:/var/lib/influxdb/meta"
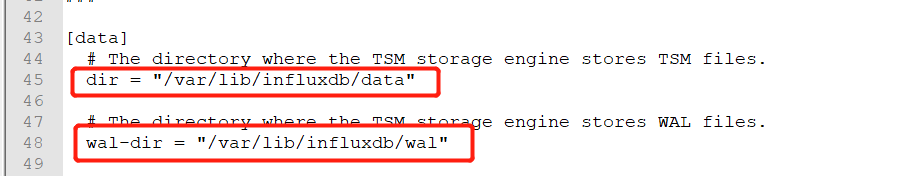
指定日志存放位置
如果是windows操作系统,则把红框中内容注释,写入存放路径:格式如 dir = "C:/var/lib/influxdb/data"
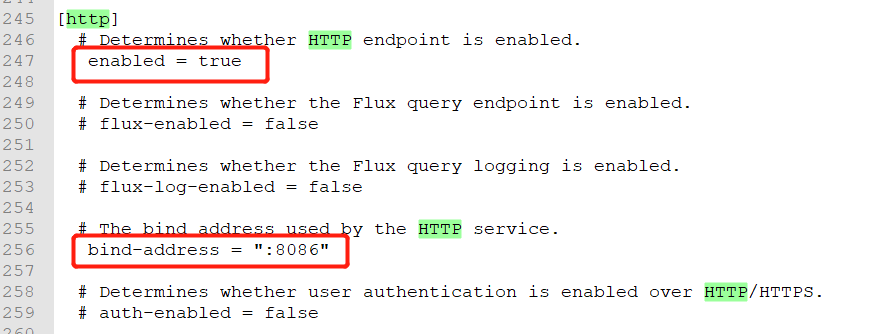
修改库与端口

修改通讯端口
③ 启动influxdb: 在influxdb安装目录下使用cmd命令模式 输入influxd -config influxdb.conf
Linux Centos7 下安装
① 百度网盘下载地址:链接:https://pan.baidu.com/s/1eJVO_8GbNWQAlxfQsBzCtg 提取码:zxfi
② 使用yum下载InfluxDB # yum install -y influxdb 未现状yum用apt-get安装 #apt-get install -y influxdb
或使用
#wget https://dl.influxdata.com/influxdb/releases/influxdb-1.8.3.x86_64.rpm#sudo yum localinstall influxdb-1.8.3.x86_64.rpm
③ 启动InfluxDB
#启动:# influxd (静默启动使用:#nohup influxd &)或# sudo service influxdb start 或# systemctl start influxdb
#重启:# sudo service influxdb restart 或 # systemctl restart influxdb
#停止:# sudo service influxdb stop 或# systemctl stop influxdb
启动成功后再浏览器输入:服务器IP+端口(8083)查看是否启动成功
④ 配置influxdb
进入InfluxDB:[root@localhost ~]#influx
查看所有数据库:[root@localhost ~]#show databases;
创建库:[root@localhost ~]#create database jmeter; 这个表就是我们用来存放Jmerter压测数据和Grafana取数据的地方
进入库:[root@localhost ~]#use jmeter; 在后端管理器中所使用的数据库
查看数据库下所有的表:[root@localhost ~]#show measurements
创建管理员用户名&密码:[root@localhost ~]#create user "JMeter"with password'123456'with all privileges; 这里的用户和密码我们要配置到jmeter中的后端管理器中
退出influx:exit/quit/ctrl+d 退出命令
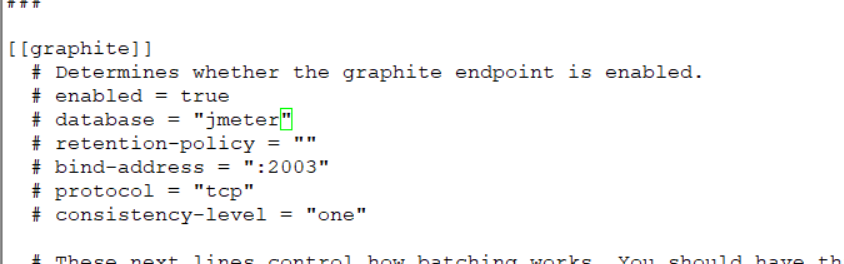
⑤修改配置:
找到配置文件所存储的位置:[root@localhost /]# cd /etc/influxdb/
修改配置文件:[root@localhost /]# cd /etc/influxdb/
database修改为自己创建的数据名字
应用修改后的配置文件:influxd -config /etc/influxdb/influxdb.conf
4.安装与使用 Grafana
Windows安装
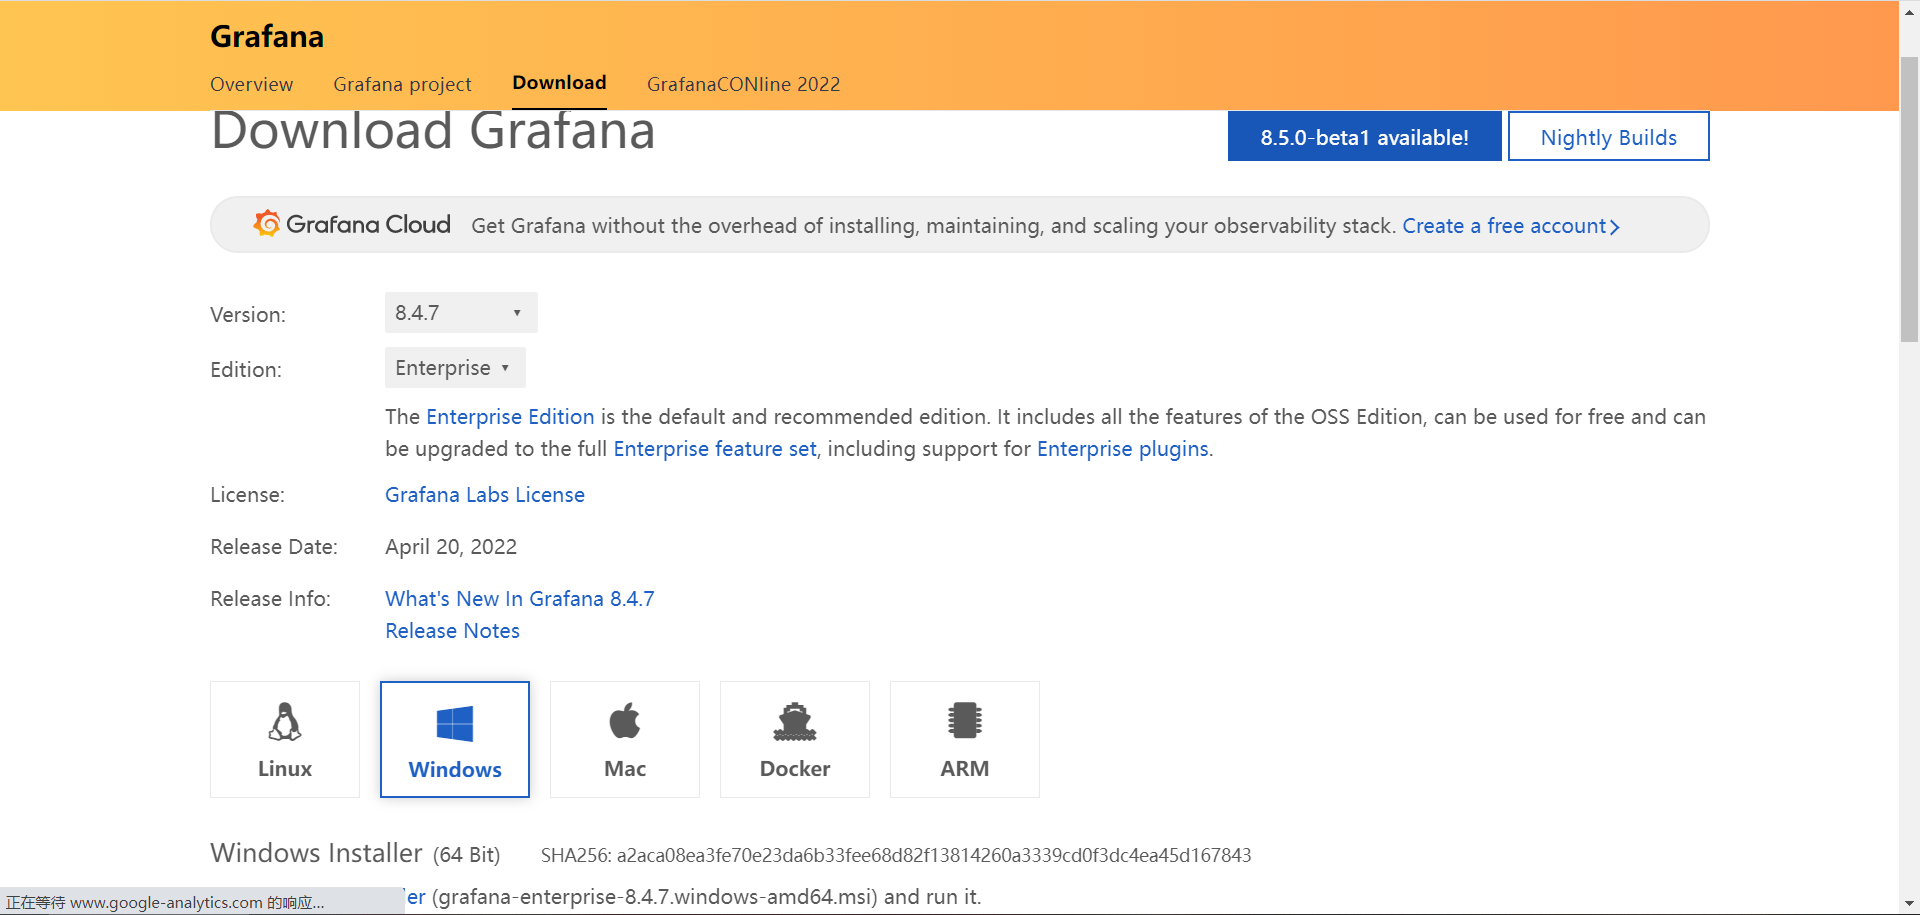
官网地址:https://grafana.com/grafana/download 下载windows版本后运行安装文件 默认安装即可 用户名: admin ,密码 :admin
百度网盘:链接: https://pan.baidu.com/s/1BLPsBDMrnB7aBwSVxyTDWw 提取码: zd8s
Linux 安装
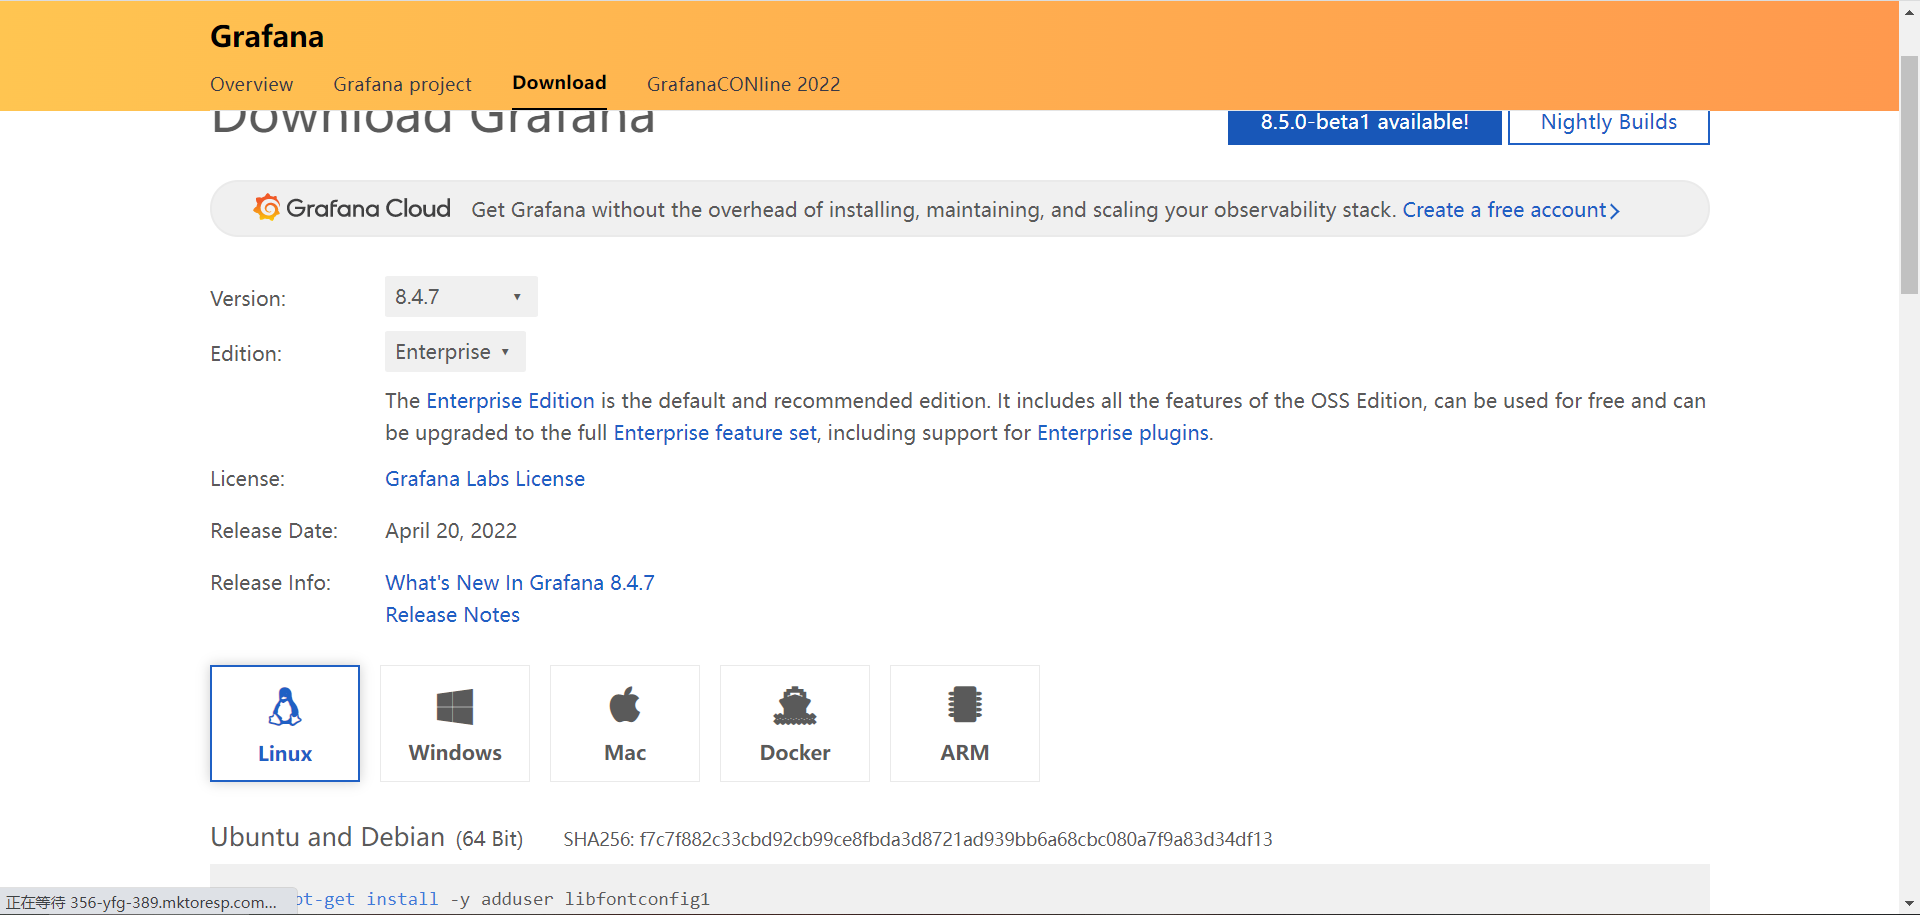
官网地址:https://grafana.com/grafana/download 找到对应的系统版本 ,使用官网提供的下载命令进行下载 注:查看linux版本的方法 cat /ete/issue
百度网盘:链接: https://pan.baidu.com/s/1gW0AjLv8xKyLwoqKL4ZUqA 提取码: m6es
使用rpm命令进行安装
#rpm -ivh grafana-5.4.2-1.x86_64.rpm 安装
注:如果遇到以下情况
警告:grafana-7.1.4-1.x86_64.rpm: 头V4 RSA/SHA256 Signature, 密钥 ID 24098cb6: NOKEY
错误:依赖检测失败:
fontconfig 被 grafana-7.1.4-1.x86_64 需要
urw-fonts 被 grafana-7.1.4-1.x86_64 需要
使用yum install-y ontconfig,yum install-y urw-fonts,如果yum安装不行的话,找个可上网的服务器 yum install yum-utils 而后 yumdownloader <package-name> 便可
启动grafana
windows启动
进入到安装目录,默认安装路径:C:\Program Files\GrafanaLabs\grafana\bin,双击运行grafana-server.exe即可
linux启动
#systemctl start grafana-server 或 #service grafana-server start 启动grafana
查看防火墙
#systemctl stop firewalld 关闭防火墙
#systemctl status firewalld 查看防火墙状态
使用 Grafana
① 打开浏览器 输入Grafana 所在的电脑 http://ip:3000
② 输入账号amdin,密码 admin
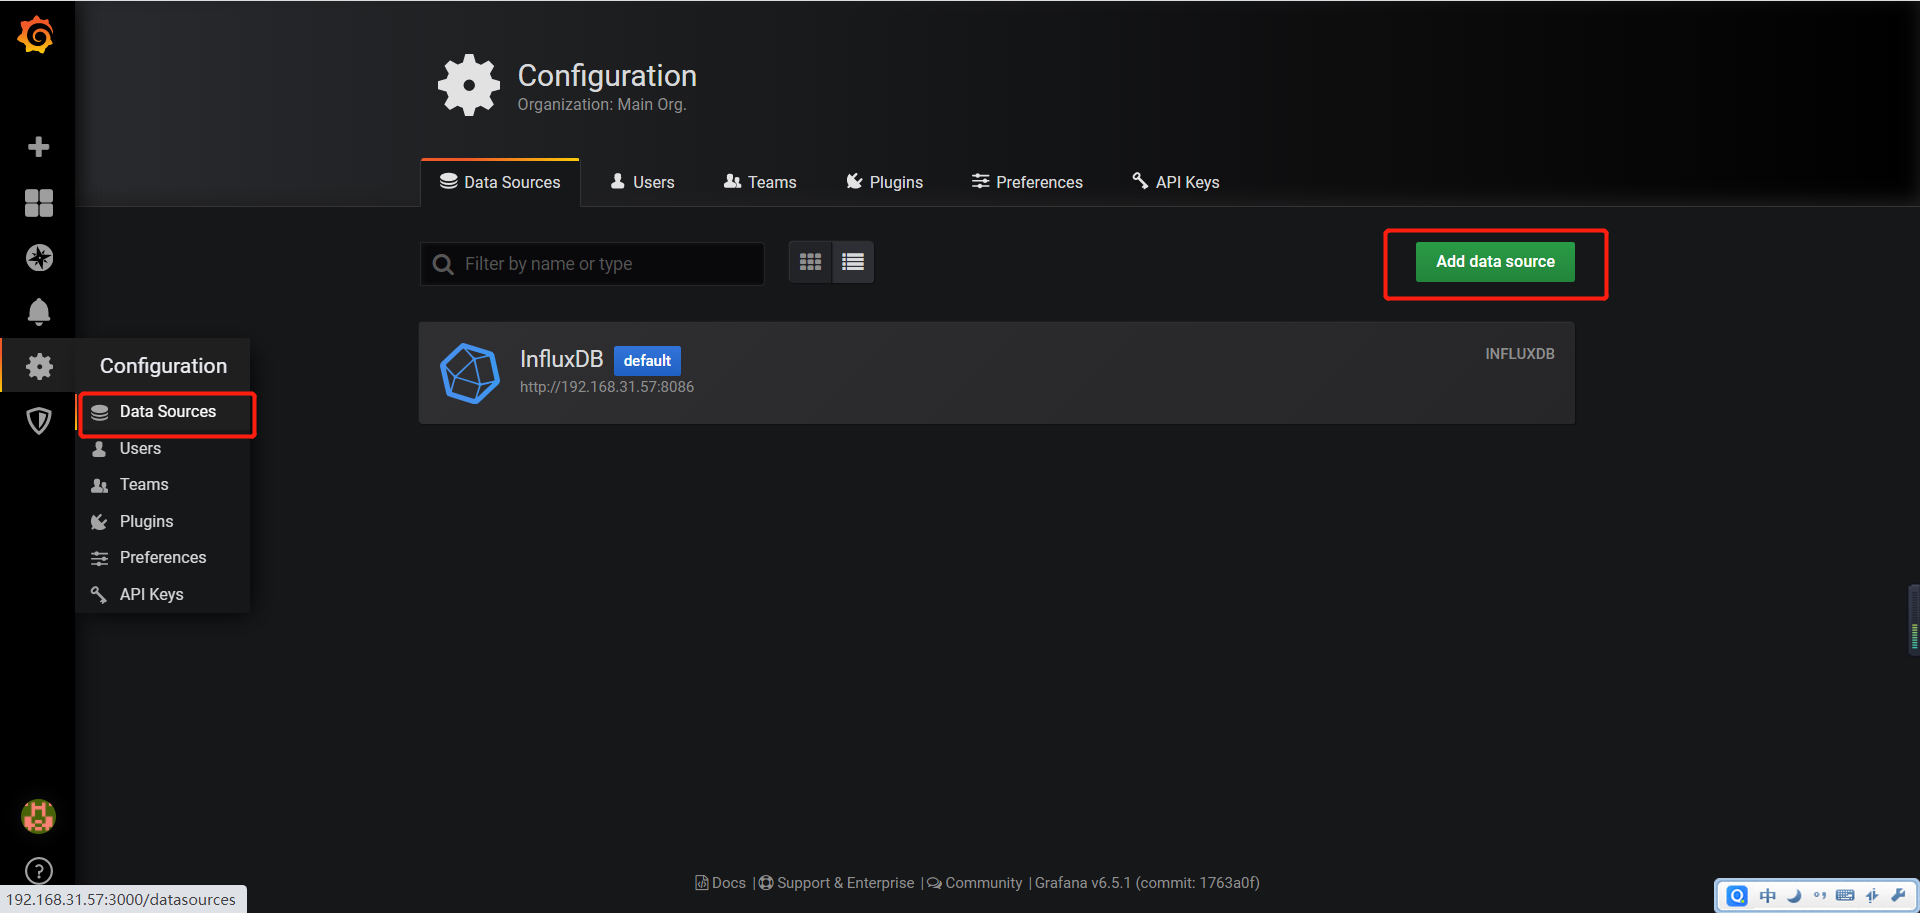
③ 新建 data sources

④ 导入jmeter模板 jmeter-load-test_rev5.json
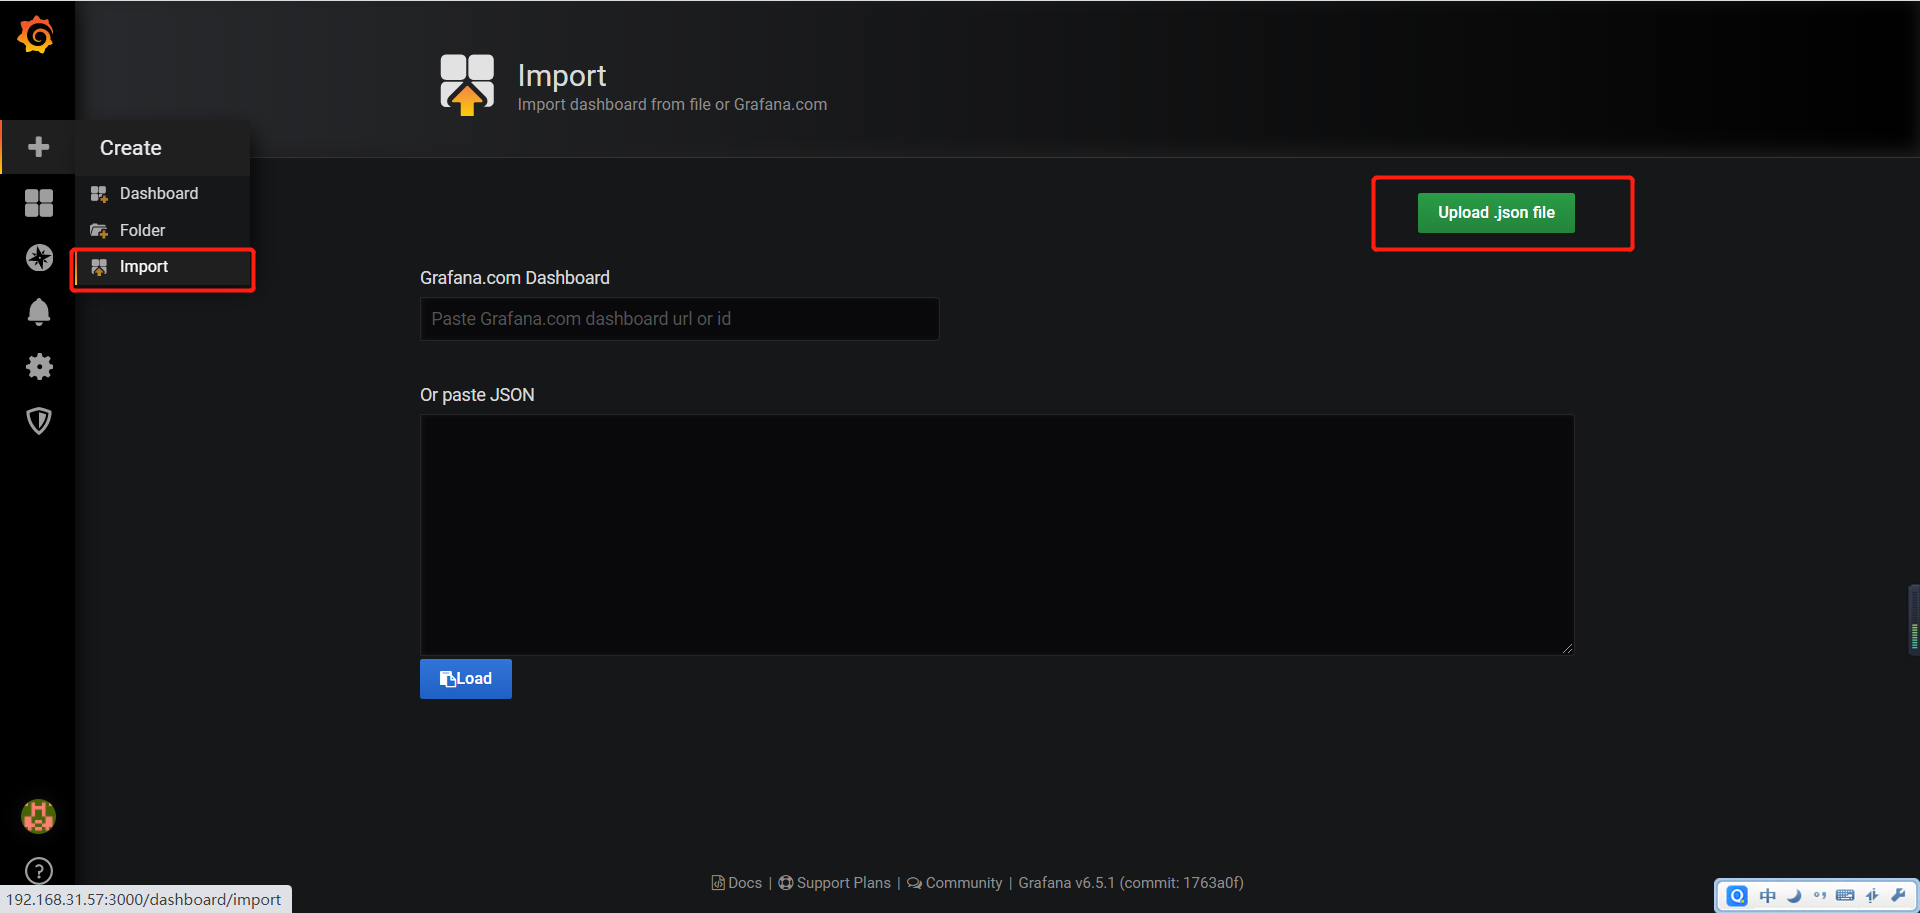
仪表盘下载地址:https://grafana.com/grafana/dashboards/
5.使用配置好的jmeter进行压测即可。