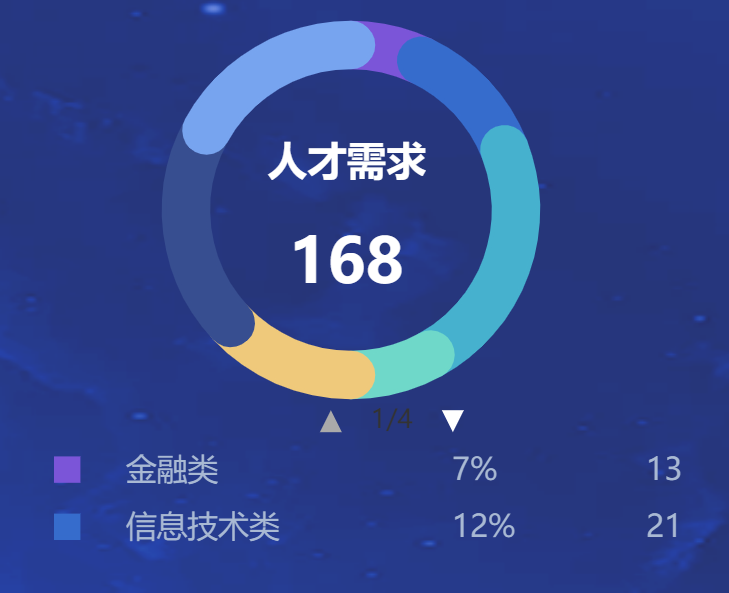
实现步骤:
1、echarts安装
npm install echarts
2、页面引入
import * as echarts from 'echarts'
3、容器
<div ref="talentDemandChart" style="width:350px;height:250px;text-align: center;position: absolute;left:10px;top:70px;"></div>
4、编写方法
initEcharts(){
      var dataList = [13, 21, 39, 14, 22,34,25];
      var nameList = ["金融类", "信息技术类", "建筑类", "批发和零售", "住宿和餐饮", "房地产", "其他"];
      var colorList = ["#7b55d8", "#366ccc", "#46b1ce", "#6fd8c9", "#efc97b", "#374e90", "#77a4ef", "#ef9f77", "#89e645", "#e67645"]
      var lengthList = []
      var totalNum = dataList.reduce((prev, curr) => { // 计算总和
        return prev + curr
      })
      var seriesList = []
      var valList = []
      dataList.forEach(function (item, index) {
        var obj = {
          value: Math.floor(((item / totalNum * 10000) / 10000) * 100), // 100份中所占的份额
          value2: item
        }
        if (index == dataList.length - 1) { // 如果是最后一个数
          var total = valList.reduce((prev, curr) => {
            return prev + curr
          })
          obj.value = Number((100 - total).toFixed(2)) // 把数字转换为字符串,并保留两位小数
          valList.push(obj.value)
        } else {
          valList.push(obj.value) // 将100份中所占的份额放入valList中
        }
        seriesList.push({
          name: nameList[index],
          type: 'bar',
          data: [obj],
          stack: 'one',
          coordinateSystem: 'polar',
          roundCap: true,
          zlevel: 20,
          itemStyle: {
            normal: {
              color: colorList[index],
              borderWidth: 2,
              borderColor: colorList[index]
            }
          },
        })
      })
      var center = ['50%', '36%']
      // 控制圆环的粗细
      var radius1 = ['50%', '70%']
      var radius2 = ['0%', '38%']
      // 给圆环中的标题进行定位
      var titleX = '48%'
      var titleY = '40%'
      var titleSize = 28;
      var legendBottom = "8%"
      seriesList.push({
        name: '外层背景',
        type: 'pie',
        radius: radius2,
        silent: true,
        center: center,
        itemStyle: { // 圆环里面的圆圈的样式
          normal: {
            opacity: 0, // 设置为0即不显示颜色
            color: "#ffffff",
          }
        },
        label: {
          normal: {
            show: false,
          },
        },
        data: [{
          value: 0,
          name: '外层背景'
        }]
      })
      nameList.forEach(function (item, index)  {
        lengthList.push({ "name": (item).toString(), "icon": "rect" ,"value":dataList[index].toString(),"percent": valList[index] +"%"})
      })
      var option = {
        tooltip: {
          trigger: 'item',
          formatter: function (params) {
            return params.seriesName + ' <br/> ' + params.marker + params.data.value2 + " <br/>  " + params.data.value + "%"
          }
        },
        title: [{
          text: '{num|' + totalNum + '}',
          x: titleX,
          y: titleY,
          textAlign: 'center',
          textStyle: { // 圆环内圆圈里面文字的样式
            rich: {
              num: {
                fontSize: titleSize,
                fontWeight: 'bold',
                lineHeight: 22,
                width: 48,
                height: 22,
                fontFamily: 'Source Han Sans CN',
                // verticalAlign:"middle",
                color: '#ffffff',
              },

            }
          },
        }],
        legend: {
          type: 'scroll',            // 设置图例翻页
          scrollDataIndex: 0,
          orient: 'vertical', //图例竖向展示
          left:'10%', // 图例距左边的距离
          top:'70%', // 图例距顶边的距离
          height:'30%',  //图例容器的高度,超过会换行展示
          width: "540",
          x: 'center',
          bottom: legendBottom,
          data: lengthList,  //图例数据
          itemHeight: 10, //图标宽设置
          itemWidth: 10, //图标长设置
          formatter: function(name) {// 图例自定义展示设置
            // let total = 0
            let target
            let percent
            for (let i = 0; i < lengthList.length; i++) {
              // total += dataValue[i].value
              if (lengthList[i].name === name) {
                if(name.length===3){
                  name = name + "    "
                }
                target = lengthList[i].value
                percent = lengthList[i].percent
              }
            }
            var arr = [
              '    '+'{name|' + name + '}',
              '{percent|' + percent + '}',
              '{target|' + target + '}'
            ]
            return arr.join('  ')
          },
          textStyle: { // 图例样式
            padding: [2, 0, 0, 0],
            color: "#A9B9D3",
            fontSize: 14,
            lineHeight: 14,
            fontFamily: 'Source Han Sans CN',
            fontWeight: 500,
            rich: { // 设置图列每一列的宽度
              name: {
                fontSize: 14,
                width: 140
              },
              percent: {
                fontSize: 14,
                width: 80
              },
              target: {
                fontSize: 14,
                width: 38,
                // color: '#c1c1c1'
              }
            }
          },
          tooltip: {
            show: true,
            formatter: function (params) {
              var name = params.name
              var i = nameList.indexOf(name)
              var value = dataList[i]
              var color = colorList[i]
              var marker = `<span style="display:inline-block;margin-right:5px;border-radius:10px;width:10px;height:10px;background-color:${color};"></span>`
              return name + ' <br/> ' + marker + value + ' <br/> ' + valList[i] + "%"
            },
          },
          icon: 'arrow', // 将图标设置为箭头
          pageButtonGap: 8, // 滚动条和翻页按钮之间的距离
          pageIconColor: '#ffffff', // 翻页按钮的颜色
          pageIconInactiveColor: '#aaa', // 非当前页翻页按钮的颜色
          pageButtonItemGap: 8,
          pageButtonPosition: 'start',
          pageFormatter:'{current}/{total}',
          pageIconSize: 10,
          pageTextStyle: {
            color: '#333', // 文字的颜色

          },

        },
        angleAxis: {
          max: 100,
          clockwise: true, // 逆时针
          show: false
        },
        radiusAxis: {
          type: 'category',
          show: true,
          axisLabel: {
            show: false,
          },
          axisLine: {
            show: false,

          },
          axisTick: {
            show: false
          },
        },
        polar: {
          center: center,
          radius: radius1,
        },
        series: seriesList

      };
      var myChart = echarts.init(this.$refs.talentDemandChart);
      myChart.setOption(option)

    },
5、调用方法
mounted (){
    this.initEcharts()
  },
6、效果如下:


