一、入门案例
新建一个页面,在wxml文件中编写下面的代码
<map/>
效果如下:
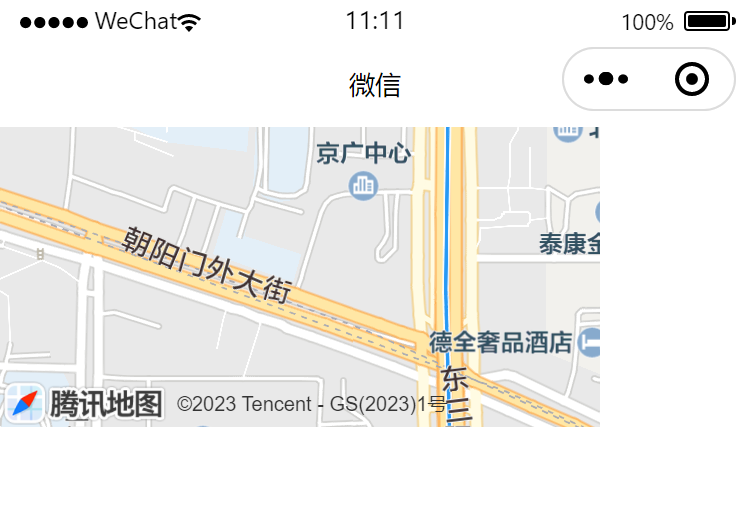
发现此时地点在北京。
我们设置一下地图的宽和高
<map style="width:100%;height: 600rpx;"/>
效果如下:
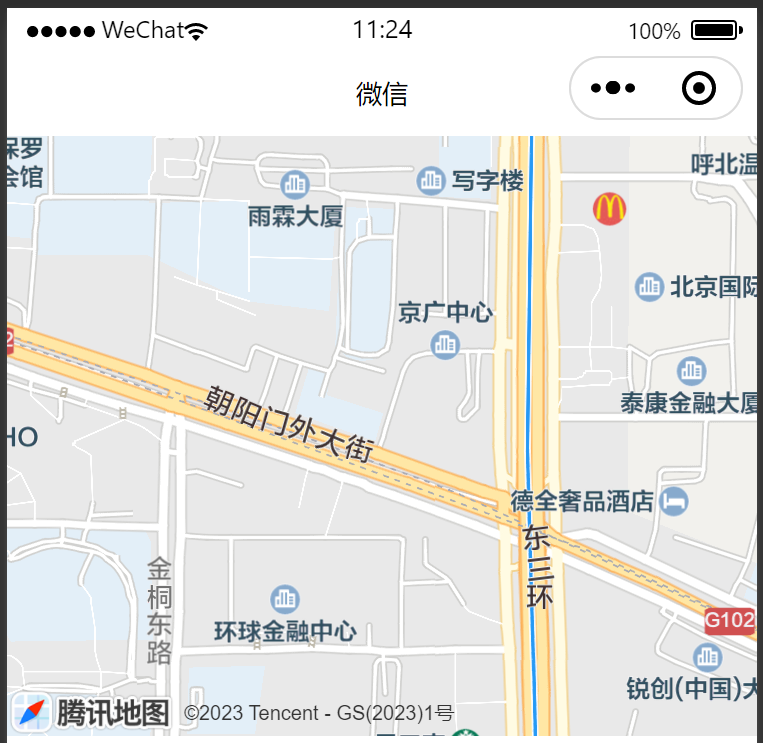
没错,通过这段代码,默认就能调用出一个地图组件,但是仅仅能显示地图而已,并无其他功能,如果我想要一些自定的功能怎么办?我们可以调用map组件提供的一些属性,具体属性如下表。
|
属性名 |
类型 |
默认值 |
说明 |
|---|---|---|---|
|
longitude |
Number |
中心经度 |
|
|
latitude |
Number |
中心纬度 |
|
|
scale |
Number |
16 |
缩放级别,取值范围为5-18 |
|
markers |
Array |
标记点 |
|
|
polyline |
Array |
路线 |
|
|
polygons |
Array |
多边形 |
|
|
circles |
Array |
圆 |
|
|
include-points |
Array |
缩放视野以包含所有给定的坐标点 |
|
|
show-location |
Boolean |
显示带有方向的当前定位点 |
|
|
subkey |
String |
'' |
个性化地图使用的key,仅初始化地图时有效 |
|
enable-3D |
Boolean |
false |
展示3D楼块(工具暂不支持) |
|
show-compass |
Boolean |
false |
显示指南针 |
|
enable-overlooking |
Boolean |
false |
开启俯视 |
|
enable-zoom |
Boolean |
true |
是否支持缩放 |
|
enable-scroll |
Boolean |
true |
是否支持拖动 |
|
enable-rotate |
Boolean |
false |
是否支持旋转 |
|
bindmarkertap |
EventHandle |
点击标记点时触发,会返回marker的id |
|
|
bindcallouttap |
EventHandle |
点击标记点对应的气泡时触发,会返回marker的id |
|
|
bindcontroltap |
EventHandle |
点击控件时触发,会返回control的id |
|
|
bindregionchange |
EventHandle |
视野发生变化时触发 |
|
|
bindtap |
EventHandle |
点击地图时触发 |
|
|
bindupdated |
EventHandle |
在地图渲染更新完成时触发 |
|
|
bindpoitap |
EventHandle |
点击地图poi点时触发 |
1、添加经纬度
我们以武汉的经纬度为例
wxml
<map style="width:100%;height: 600rpx;" latitude="{{latitude}}" longitude="{{longitude}}"/>
js
data: {
        latitude: '30.51667',
        longitude: '114.31667',
    },
效果如下:
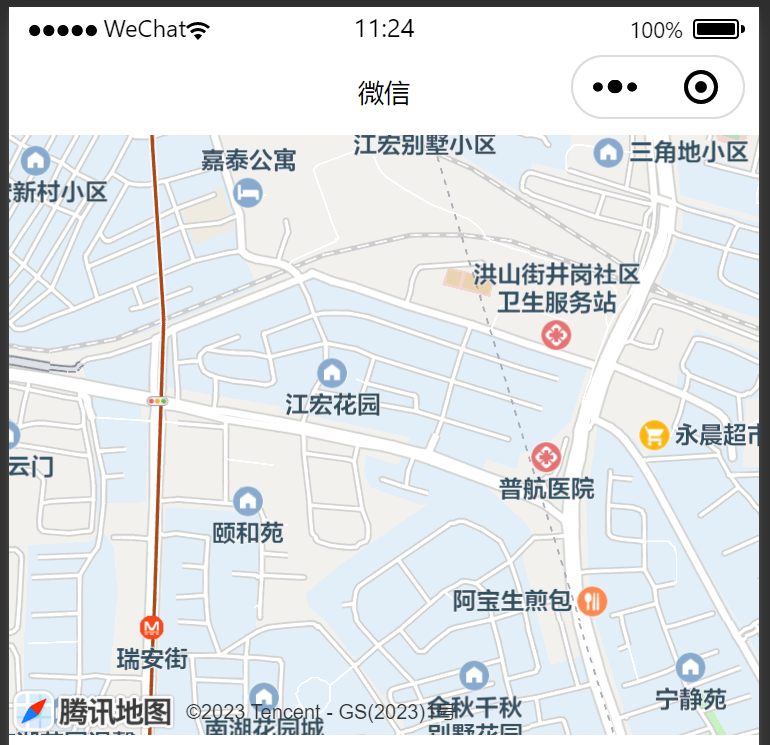
发现此时的定位为武汉。
经纬度的使用案例:
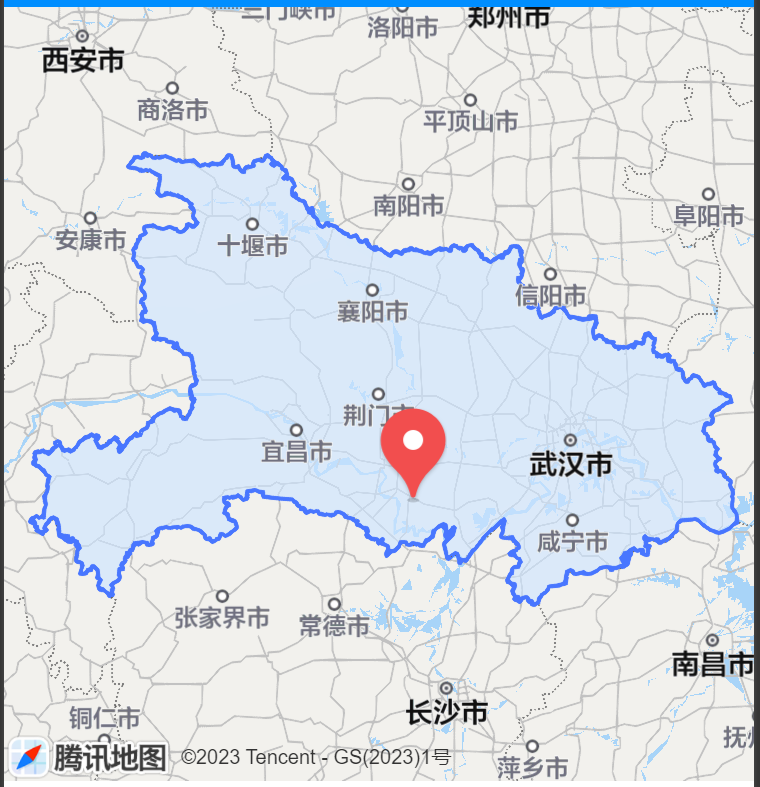
当我们在微信小程序中展示地图时,如湖北省地图,如下所示:
<map style="width:100%;height: 775rpx;" latitude="29.995051" longitude="112.574526" polygons="{{polygons}}" scale="{{scale}}" markers='{{markers}}'/>
效果如下:
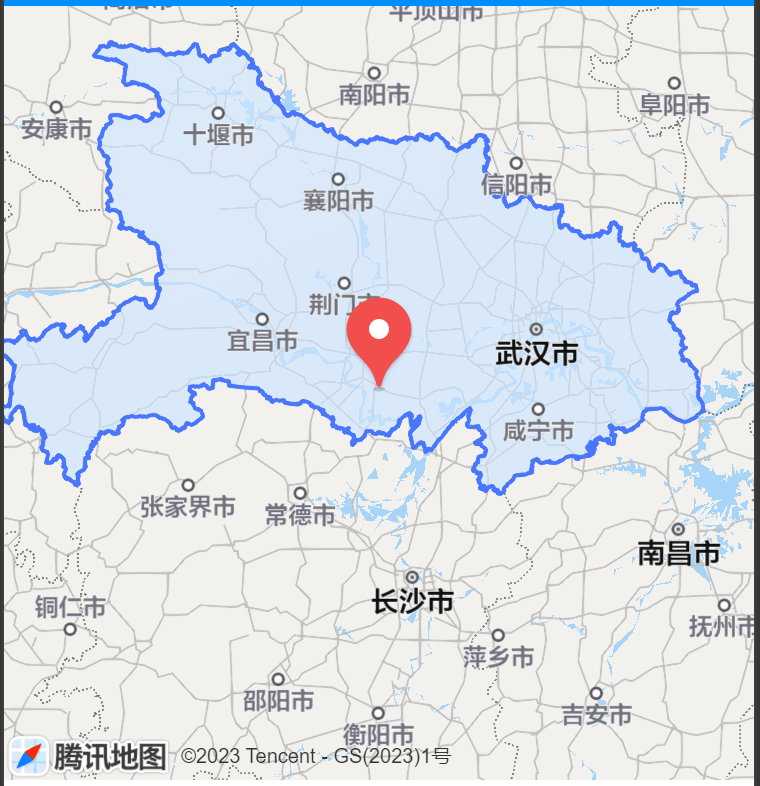
我们想让湖北省地图居中展示,此时可以通过调整地图的经纬度来调整湖北省地图的位置。
<map style="width:100%;height: 775rpx;" latitude="31.035423" longitude="112.199265" polygons="{{polygons}}" scale="{{scale}}" markers='{{markers}}'/>
效果如下:
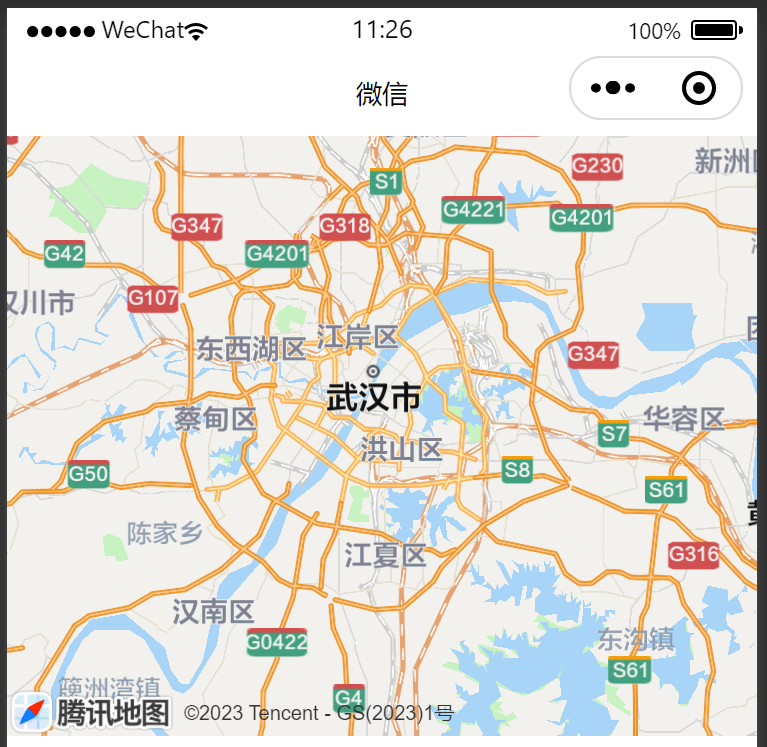
2、设置缩放级别
缩放级别,取值范围为5-18
wxml
<map style="width:100%;height: 600rpx;" latitude="{{latitude}}" longitude="{{longitude}}" scale="{{scale}}"/>
js
data: {
        latitude: '30.51667',
        longitude: '114.31667',
        scale: 9
    },
效果
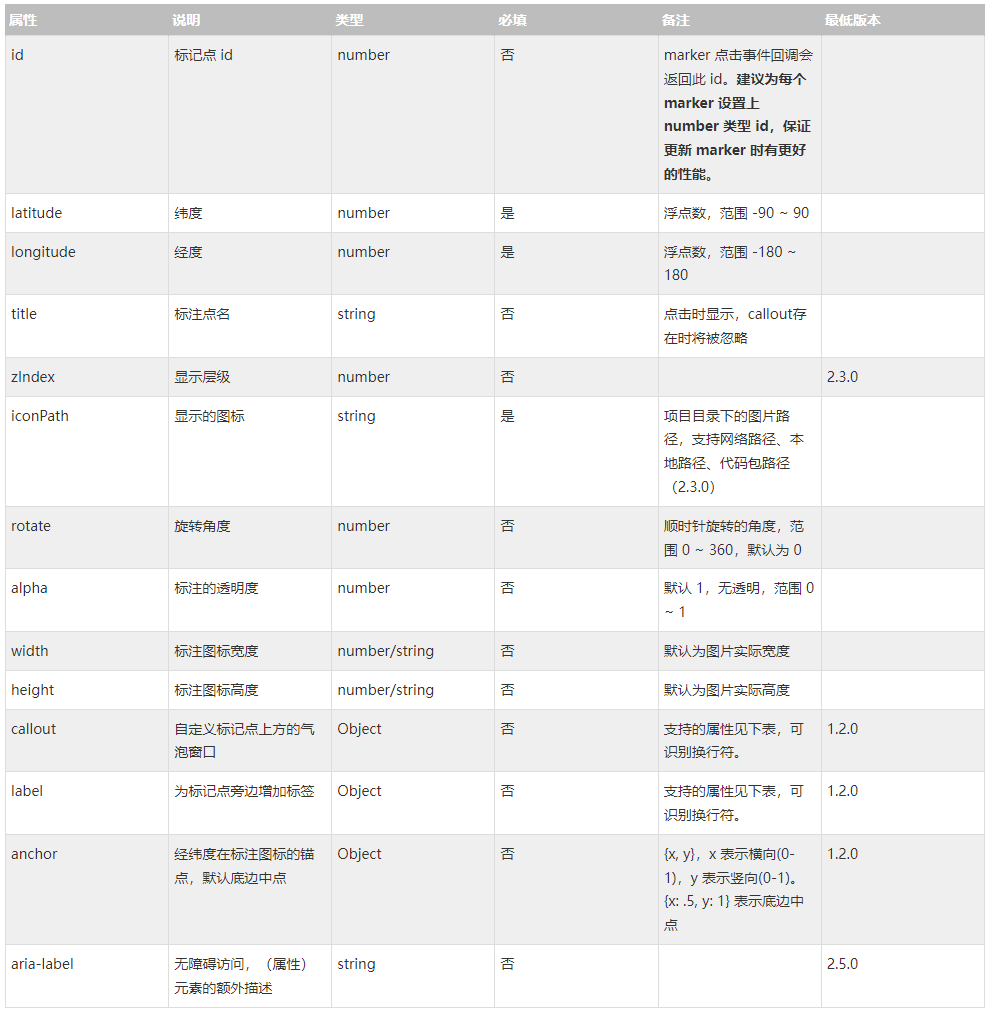
3、设置标记点
标记点用于在地图上显示标记的位置
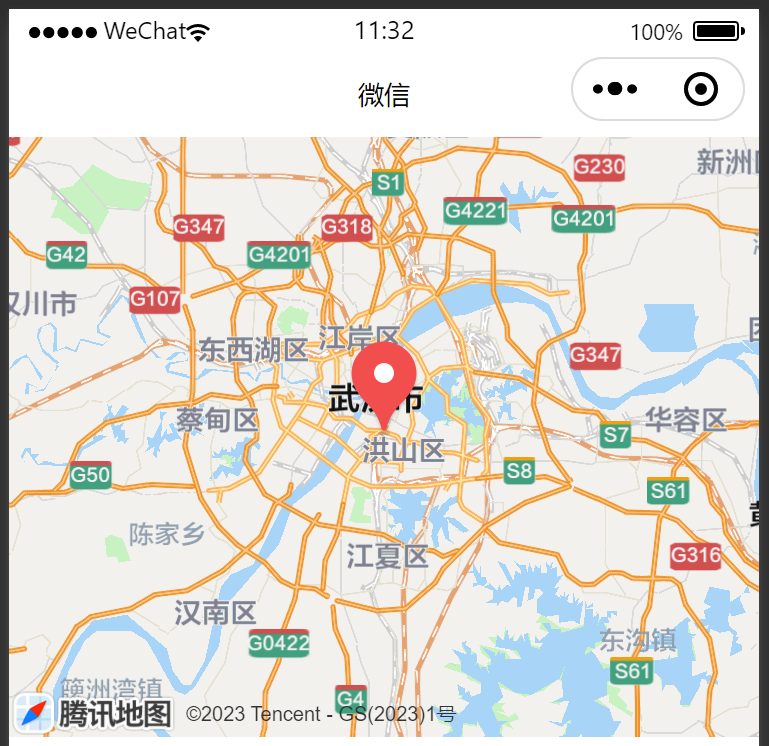
wxml
<map style="width:100%;height: 600rpx;" latitude="{{latitude}}" longitude="{{longitude}}" scale="{{scale}}" markers='{{markers}}'/>
js
data: {
        latitude: '30.51667',
        longitude: '114.31667',
        scale: 9,
        markers: [{
            id: 1,
            latitude: '30.51667',
            longitude: '114.31667'
        }],
    },
效果
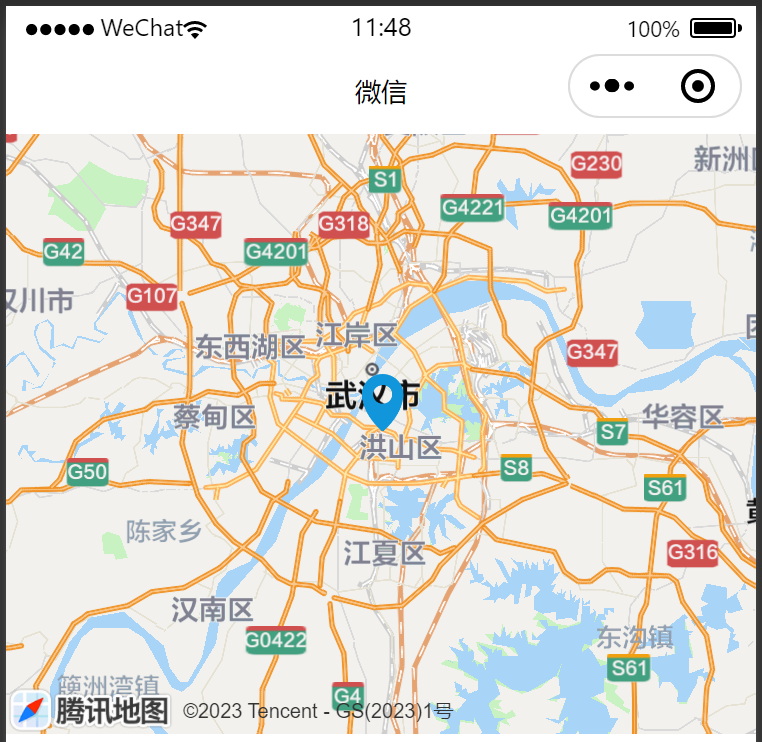
设置标记点的图标和宽高
data: {
        latitude: '30.51667',
        longitude: '114.31667',
        scale: 9,
        markers: [{
            id:1,
            latitude: '30.51667',
            longitude: '114.31667',
            iconPath: "/image/marker1.png",
            width: 30,
            height: 30,
          }],
    },
效果如下:
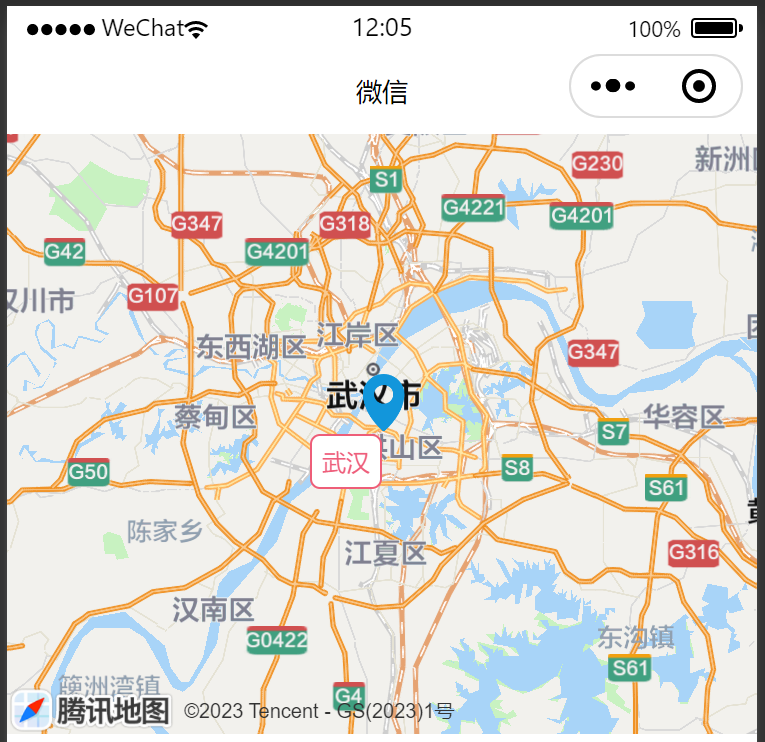
marker上的标签label设置

data: {
        latitude: '30.51667',
        longitude: '114.31667',
        scale: 9,
        markers: [{
            id:1,
            latitude: '30.51667',
            longitude: '114.31667',
            iconPath: "/image/marker1.png",
            width: 30,
            height: 30,

            label:{
              content:"武汉",
              color:"#EE5E7B",
              borderWidth:1,
              borderColor:"#EE5E78",
              borderRadius:5,
              padding:5,
              bgColor: "#fff",
              textAlign: 'left'
            }
          },

        ]
    },
效果如下:
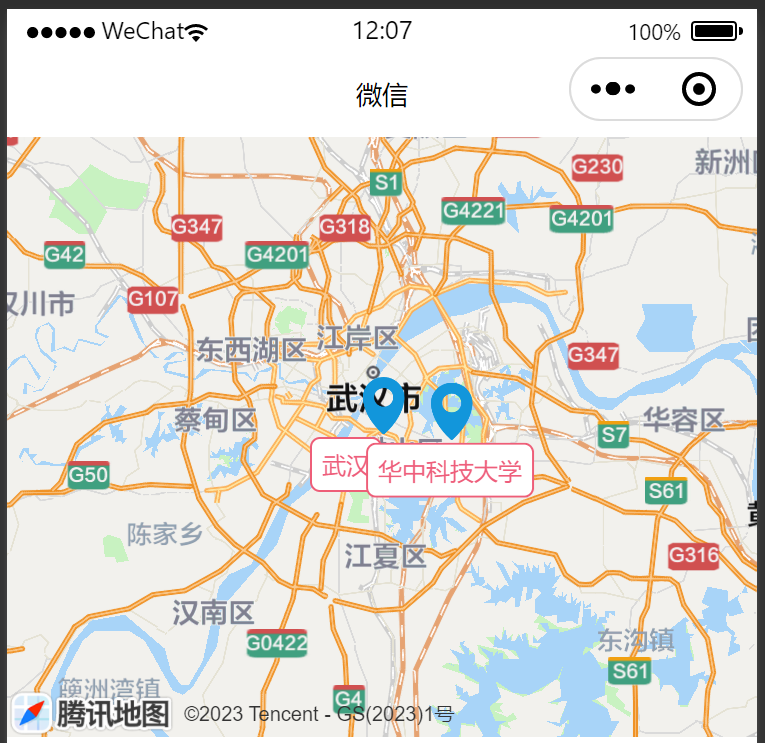
地图上实现标记多个位置
    data: {
        latitude: '30.51667',
        longitude: '114.31667',
        scale: 9,
        markers: [{
            id:1,
            latitude: '30.51667',
            longitude: '114.31667',
            iconPath: "/image/marker1.png",
            width: 30,
            height: 30,

            label:{
              content:"武汉",
              color:"#EE5E7B",
              borderWidth:1,
              borderColor:"#EE5E78",
              borderRadius:5,
              padding:5,
              bgColor: "#fff",
              textAlign: 'left'
            },
          },
          {
            id:2,
            latitude: '30.51',
            longitude: '114.41',
            iconPath: "/image/marker1.png",
            width: 30,
            height: 30,
            label:{
                content:"华中科技大学",
                color:"#EE5E7B",
                borderWidth:1,
                borderColor:"#EE5E78",
                borderRadius:5,
                padding:5,
                bgColor: "#fff",
                textAlign: 'center'
              },
          }
        ]
    },
效果如下:
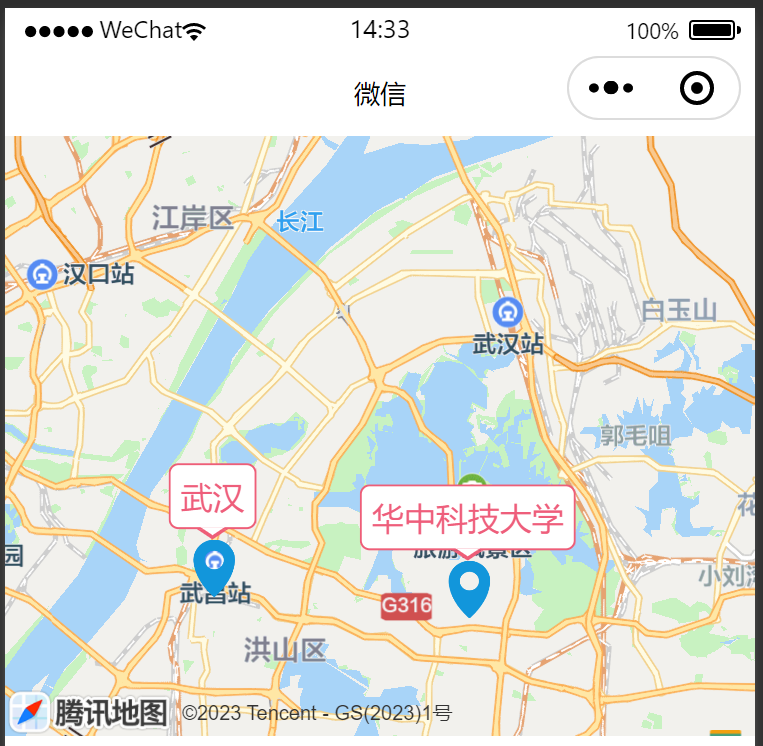
marker 上的气泡 callout
    data: {
        latitude: '30.51667',
        longitude: '114.31667',
        scale: 9,
        markers: [{
            id:1,
            latitude: '30.51667',
            longitude: '114.31667',
            iconPath: "/image/marker1.png",
            width: 30,
            height: 30,
            callout:{
              content:"武汉",
              color:"#EE5E7B",
              borderWidth:1,
              borderColor:"#EE5E78",
              borderRadius:5,
              padding:5,
              fontSize: 16,
              textAlign: 'center',
              display: "ALWAYS"
            }
          },
          {
            id:2,
            latitude: '30.51',
            longitude: '114.41',
            iconPath: "/image/marker1.png",
            width: 30,
            height: 30,
              callout:{
                content:"华中科技大学",
                color:"#EE5E7B",
                borderWidth:1,
                borderColor:"#EE5E78",
                borderRadius:5,
                padding:5,
                fontSize: 16,
                textAlign: 'center',
                display: "ALWAYS"
              }
          }
        ]
    },
效果:
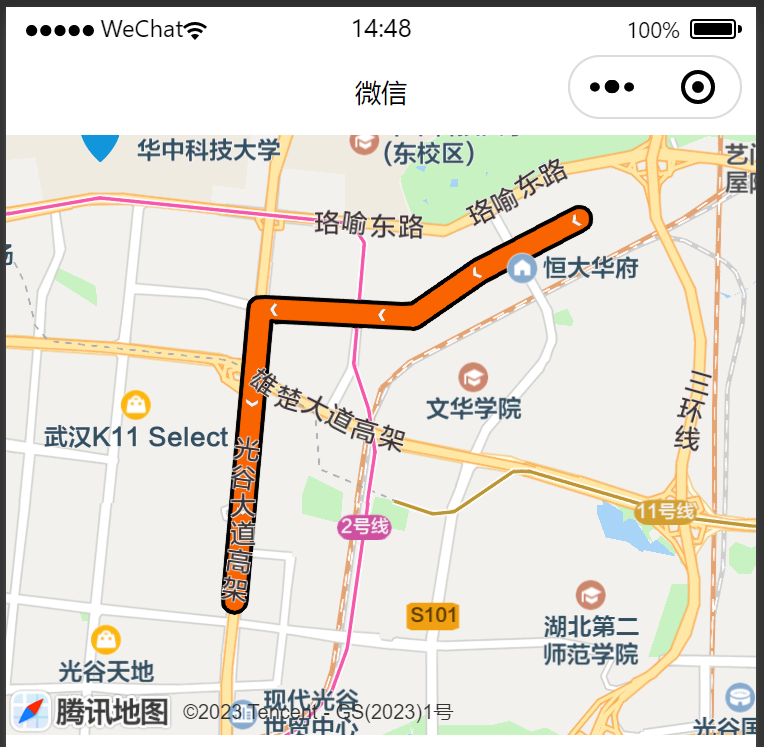
4、设置路线polyline
指定一系列坐标点,从数组第一项连线至最后一项

wxml
<map style="width:100%;height: 600rpx;" latitude="{{latitude}}" longitude="{{longitude}}" scale="{{scale}}" markers='{{markers}}' polyline='{{polyline}}'/>
js
data: {
        latitude: '30.51667',
        longitude: '114.31667',
        scale: 9,
        markers: [{
            id:1,
            latitude: '30.51667',
            longitude: '114.31667',
            iconPath: "/image/marker1.png",
            width: 30,
            height: 30,
            callout:{
              content:"武汉",
              color:"#EE5E7B",
              borderWidth:1,
              borderColor:"#EE5E78",
              borderRadius:5,
              padding:5,
              fontSize: 16,
              textAlign: 'center',
              display: "ALWAYS"
            }
          },
          {
            id:2,
            latitude: '30.51',
            longitude: '114.41',
            iconPath: "/image/marker1.png",
            width: 30,
            height: 30,
              callout:{
                content:"华中科技大学",
                color:"#EE5E7B",
                borderWidth:1,
                borderColor:"#EE5E78",
                borderRadius:5,
                padding:5,
                fontSize: 16,
                textAlign: 'center',
                display: "ALWAYS"
              }
          }
        ],
        polyline: [{
            points: [{
              latitude: "30.506244",
              longitude: "114.448641"
            },
            {
              latitude: "30.503899",
              longitude: "114.443437"
            },
            {
              latitude: "30.502638",
              longitude: "114.440635"
            }
            ,
            {
              latitude: "30.499478",
              longitude: "114.435335"
            }
            ,
            {
              latitude: "30.50002",
              longitude: "114.423009"
            },
            {
              latitude: "30.479808",
              longitude: "114.420928"
            }
          ],
            color: "#FA6400",
            width: 10,
            arrowLine: true,
            borderWidth: 2 //线的边框宽度,还有很多参数,请看文档
          }]
    },
效果如下:
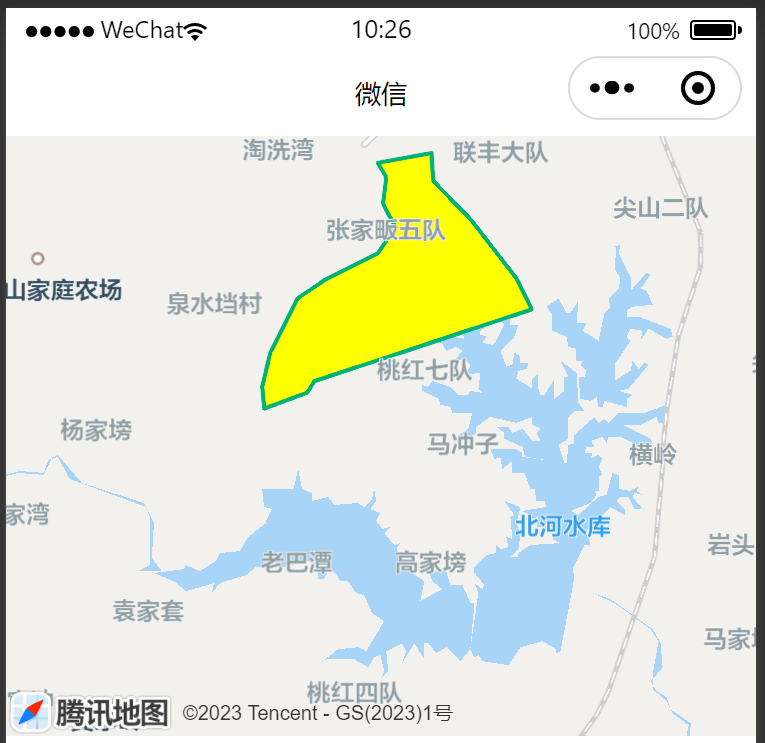
5、设置多边形polygons
指定一系列坐标点,根据 points 坐标数据生成闭合多边形

wxml
<map style="width:100%;height: 600rpx;" latitude="30.145935" longitude="111.583911" scale="13" polygons="{{polygons}}"/>
js
 data: {
        polygons: [{
            points:  [
                {
                    "longitude": 111.596827,
                    "latitude": 30.155319
                },
                {
                    "longitude": 111.595524,
                    "latitude": 30.157613
                },
                {
                    "longitude": 111.591657,
                    "latitude": 30.161923
                },
                {
                    "longitude": 111.588356,
                    "latitude": 30.164869
                },
                {
                    "longitude": 111.588275,
                    "latitude": 30.166908
                },
                {
                    "longitude": 111.583639,
                    "latitude": 30.166177
                },
                {
                    "longitude": 111.584367,
                    "latitude": 30.165114
                },
                {
                    "longitude": 111.584084,
                    "latitude": 30.163148
                },
                {
                    "longitude": 111.58516,
                    "latitude": 30.161378
                },
                {
                    "longitude": 111.583647,
                    "latitude": 30.159486
                },
                {
                    "longitude": 111.579068,
                    "latitude": 30.157481
                },
                {
                    "longitude": 111.576778,
                    "latitude": 30.156143
                },
                {
                    "longitude": 111.574424,
                    "latitude": 30.152133
                },
                {
                    "longitude": 111.573736,
                    "latitude": 30.149608
                },
                {
                    "longitude": 111.573898,
                    "latitude": 30.147965
                },
                {
                    "longitude": 111.577603,
                    "latitude": 30.149152
                },
                {
                    "longitude": 111.578194,
                    "latitude": 30.149995
                },
                {
                    "longitude": 111.596827,
                    "latitude": 30.155319
                }
            ],//给个空数组在页面刚开始渲染的时候会报错,但是不影响使用
            fillColor: "#ffff00",
            strokeColor: "#00B277",
            strokeWidth: 2,
            zIndex: 1
          }],
    },
效果如下:
通过点击地图上的点来画多边形
wxml
<map  style="width:100%;height: 600rpx;" latitude="{{latitude}}" longitude="{{longitude}}" scale="{{scale}}" markers='{{markers}}' polyline='{{polyline}}'
bindtap="bindMap"  polygons="{{polygons}}"/>
<button type="primary" bindtap="clearGon">清除点或面</button>
js
    data: {
        latitude: '30.51667',
        longitude: '114.31667',
        scale: 9,
        markers: [{
            id:1,
            latitude: '30.51667',
            longitude: '114.31667',
            iconPath: "/image/marker1.png",
            width: 30,
            height: 30,

            callout:{
              content:"武汉",
              color:"#EE5E7B",
              borderWidth:1,
              borderColor:"#EE5E78",
              borderRadius:5,
              padding:5,
              fontSize: 16,
              textAlign: 'center',
              display: "ALWAYS"
            }
          },
          {
            id:2,
            latitude: '30.51',
            longitude: '114.41',
            iconPath: "/image/marker1.png",
            width: 30,
            height: 30,
              callout:{
                content:"华中科技大学",
                color:"#EE5E7B",
                borderWidth:1,
                borderColor:"#EE5E78",
                borderRadius:5,
                padding:5,
                fontSize: 16,
                textAlign: 'center',
                display: "ALWAYS"
              }
          }
        ],
        polyline: [{
            points: [{
              latitude: "30.506244",
              longitude: "114.448641"
            },
            {
              latitude: "30.503899",
              longitude: "114.443437"
            },
            {
              latitude: "30.502638",
              longitude: "114.440635"
            }
            ,
            {
              latitude: "30.499478",
              longitude: "114.435335"
            }
            ,
            {
              latitude: "30.50002",
              longitude: "114.423009"
            },
            {
              latitude: "30.479808",
              longitude: "114.420928"
            }
          ],
            color: "#FA6400",
            width: 10,
            arrowLine: true,
            borderWidth: 2 //线的边框宽度,还有很多参数,请看文档
          }],
          polygons: [{
            points: [],//给个空数组在页面刚开始渲染的时候会报错,但是不影响使用
            fillColor: "#ffff00",
            strokeColor: "#00B277",
            strokeWidth: 2,
            zIndex: 1
          }],
          gonsArr:[],
    },
//点击地图的时候
bindMap(e) {
    let arr=this.data.gonsArr    //不直接使用polygons[0].points是因为如果不够三个点会报错
    let arr1=this.data.markers   //点击地图添加一个标记点
    let latitude=e.detail.latitude
    let longitude=e.detail.longitude
    arr.push({latitude,longitude})
    arr1.push({
        latitude,
        longitude,
        iconPath: "../../image/map.png",
        id: latitude,
        width: '63rpx',
        height: '88rpx'
    })
    //判断如果标记的点数大于等于3就给polygons[0].points赋值,如果小于3只添加点并且给gonsArr push一下
    if(arr.length>2){
      this.data.polygons[0].points=arr
      this.setData({
        polygons:this.data.polygons,
        markers:arr1,
        gonsArr:arr
      })
    }else{
      this.setData({
        markers:arr1,
        gonsArr:arr
      })
    }
  },
  //清除标记点和面
  clearGon(){
    let arr=this.data.polygons
    arr[0].points=[]
    this.setData({
      polygons:arr,
      markers:[],
      gonsArr:[]
    })
  },
效果:
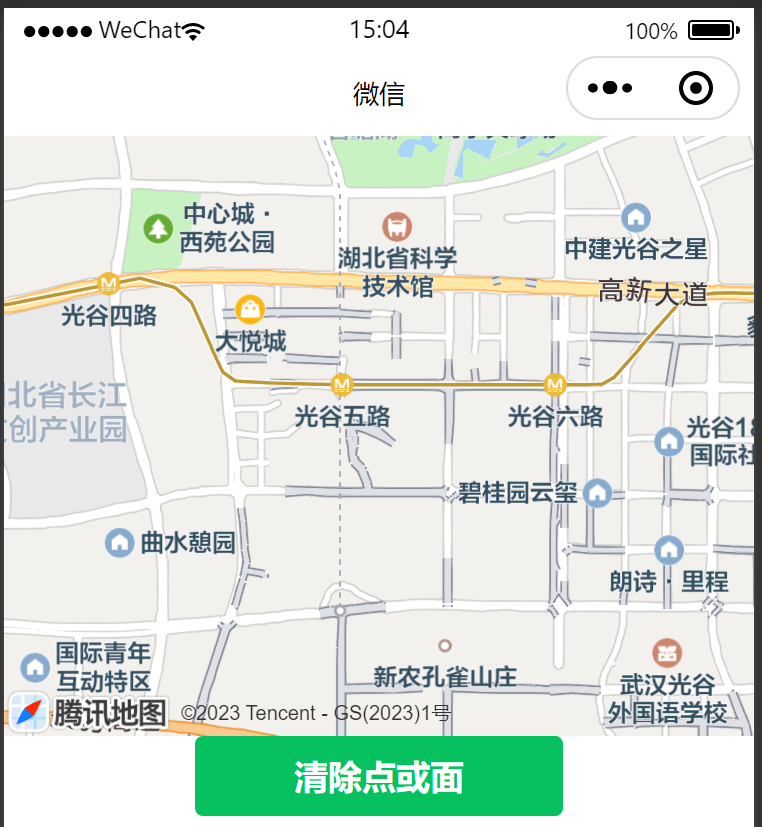
在地图上随便点几个点,生成如下所示多边形
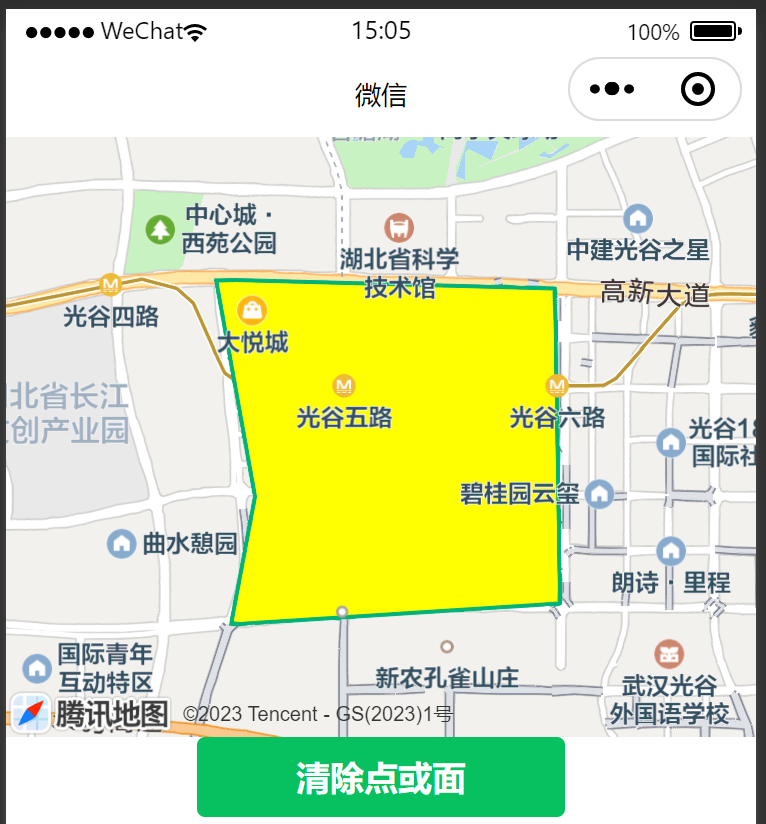
点击按钮可以清楚多边形。
6、设置圆circle
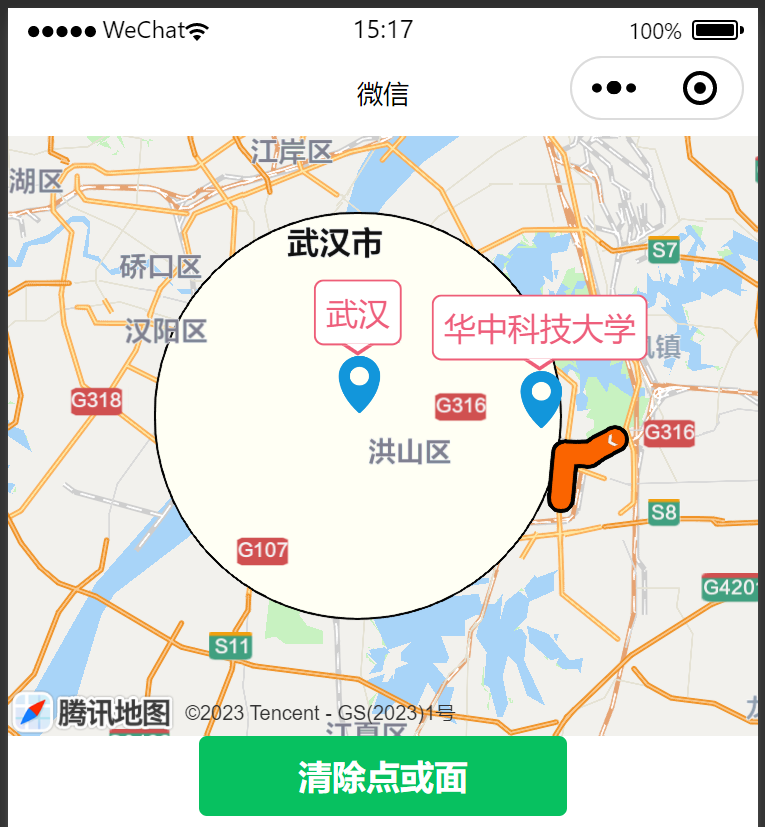
在地图上显示圆,circle是在map地图上画一个圆,这个圆只需要知道圆心和半径大小即可,属性如表所示:

wxml
<map  style="width:100%;height: 600rpx;" latitude="{{latitude}}" longitude="{{longitude}}" scale="{{scale}}" markers='{{markers}}' polyline='{{polyline}}'
bindtap="bindMap"  polygons="{{polygons}}" circles="{{circles}}"/>
js
data: {
        latitude: '30.51667',
        longitude: '114.31667',
        scale: 9,
        markers: [{
            id:1,
            latitude: '30.51667',
            longitude: '114.31667',
            iconPath: "/image/marker1.png",
            width: 30,
            height: 30,
            callout:{
              content:"武汉",
              color:"#EE5E7B",
              borderWidth:1,
              borderColor:"#EE5E78",
              borderRadius:5,
              padding:5,
              fontSize: 16,
              textAlign: 'center',
              display: "ALWAYS"
            }
          },
          {
            id:2,
            latitude: '30.51',
            longitude: '114.41',
            iconPath: "/image/marker1.png",
            width: 30,
            height: 30,
              callout:{
                content:"华中科技大学",
                color:"#EE5E7B",
                borderWidth:1,
                borderColor:"#EE5E78",
                borderRadius:5,
                padding:5,
                fontSize: 16,
                textAlign: 'center',
                display: "ALWAYS"
              }
          }
        ],
        polyline: [{
            points: [{
              latitude: "30.506244",
              longitude: "114.448641"
            },
            {
              latitude: "30.503899",
              longitude: "114.443437"
            },
            {
              latitude: "30.502638",
              longitude: "114.440635"
            }
            ,
            {
              latitude: "30.499478",
              longitude: "114.435335"
            }
            ,
            {
              latitude: "30.50002",
              longitude: "114.423009"
            },
            {
              latitude: "30.479808",
              longitude: "114.420928"
            }
          ],
            color: "#FA6400",
            width: 10,
            arrowLine: true,
            borderWidth: 2 //线的边框宽度,还有很多参数,请看文档
          }],
          polygons: [{
            points: [],//给个空数组在页面刚开始渲染的时候会报错,但是不影响使用
            fillColor: "#ffff00",
            strokeColor: "#00B277",
            strokeWidth: 2,
            zIndex: 1
          }],
          gonsArr:[],
          circles:[{
              latitude: '30.51667',
              longitude: '114.31667',
              fillColor:"#FFFFF0",
              radius:10000
            }]
    },
效果如下:
7、设置控件control
在地图上显示控件,控件不随着地图移动。即将废弃,请使用 cover-view

本来微信小程序的map 里面的 controls控件可以轻松实现,但是官方说要废弃了,说采用 cover-view代替,其实就是一个点击事件。用不用cover-view 都可以的。被误导了一个多小时。
wxml
<map  id="myMap"  show-location="true"  show-compass="true" style="width:100%;height: 600rpx;" latitude="{{latitude}}" longitude="{{longitude}}" scale="{{scale}}" markers='{{markers}}' polyline='{{polyline}}' bindtap="bindMap"  polygons="{{polygons}}" circles="{{circles}}" controls="{{controls}}"/>
<!-- 这个就是地图上图标的代码 用不用 cover-view  都行的   设置了一个绑定事件 moveTolocation -->
 <view class="viewlistd"  bindtap="moveTolocation">
    <view class="viewlistblock" style="background:none;">
      <view class="viewlittle" style="padding:0;">
        <image src="/image/miaozhun.png" mode="" class="" id="" style="width:120rpx;height:120rpx;"></image>
      </view>
    </view>
</view>
<button type="primary" bindtap="clearGon">清除点或面</button>
js
data: {
        latitude: '30.479049',
        longitude: '114.417156',
        scale: 9,
        markers: [{
            id:1,
            latitude: '30.51667',
            longitude: '114.31667',
            iconPath: "/image/marker1.png",
            width: 30,
            height: 30,
            callout:{
              content:"武汉",
              color:"#EE5E7B",
              borderWidth:1,
              borderColor:"#EE5E78",
              borderRadius:5,
              padding:5,
              fontSize: 16,
              textAlign: 'center',
              display: "ALWAYS"
            }
          },
          {
            id:2,
            latitude: '30.51',
            longitude: '114.41',
            iconPath: "/image/marker1.png",
            width: 30,
            height: 30,
              callout:{
                content:"华中科技大学",
                color:"#EE5E7B",
                borderWidth:1,
                borderColor:"#EE5E78",
                borderRadius:5,
                padding:5,
                fontSize: 16,
                textAlign: 'center',
                display: "ALWAYS"
              }
          }
        ],
        polyline: [{
            points: [{
              latitude: "30.506244",
              longitude: "114.448641"
            },
            {
              latitude: "30.503899",
              longitude: "114.443437"
            },
            {
              latitude: "30.502638",
              longitude: "114.440635"
            }
            ,
            {
              latitude: "30.499478",
              longitude: "114.435335"
            }
            ,
            {
              latitude: "30.50002",
              longitude: "114.423009"
            },
            {
              latitude: "30.479808",
              longitude: "114.420928"
            }
          ],
            color: "#FA6400",
            width: 10,
            arrowLine: true,
            borderWidth: 2 //线的边框宽度,还有很多参数,请看文档
          }],
          polygons: [{
            points: [],//给个空数组在页面刚开始渲染的时候会报错,但是不影响使用
            fillColor: "#ffff00",
            strokeColor: "#00B277",
            strokeWidth: 2,
            zIndex: 1
          }],
          gonsArr:[],
        //   circles:[{
        //       latitude: '30.51667',
        //       longitude: '114.31667',
        //       fillColor:"#FFFFF0",
        //       radius:10000
        //     }],
            controls: [{
                id: 1,
                iconPath: '/resources/location.png',
                position: {
                  left: 0,
                  top: 300 - 50,
                  width: 50,
                  height: 50
                },
                clickable: true
              }],
              mapId: "myMap" //wxml中的map的Id值
    },
    /**
    * 跳转到当前的位置
    */
  moveTolocation: function () {
    //mapId 就是你在 map 标签中定义的 id
    let Id = this.data.mapId
    var mapCtx = wx.createMapContext(Id);
    mapCtx.moveToLocation();
  },
当我们把自己的位置移到外面,如下所示:
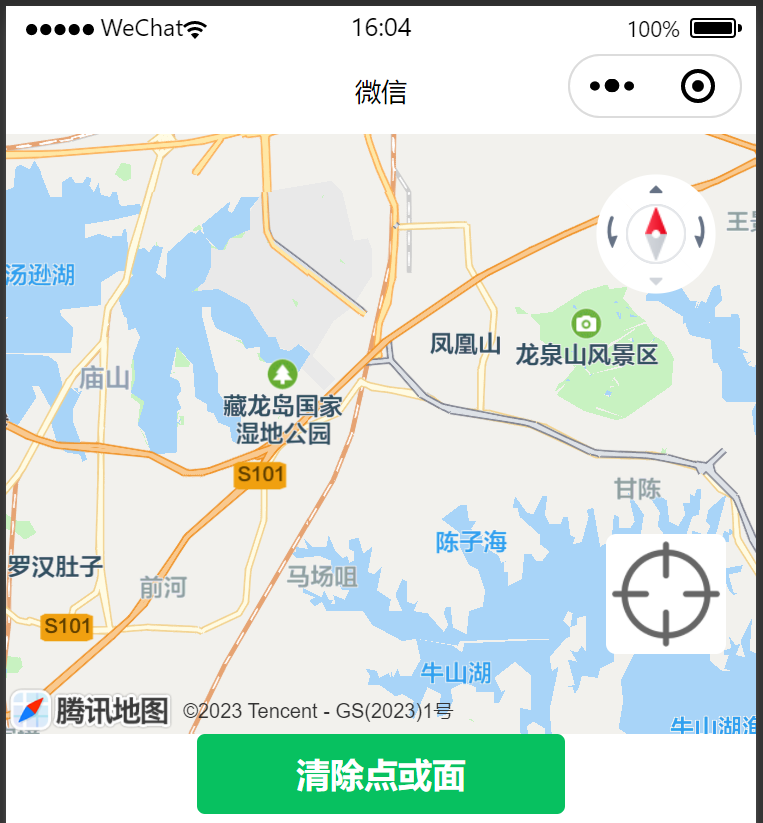
此时单击控件,自己的位置就会回到视野中,如下所示:


