Python 科研绘图总结2 一 子图,三维立方体
Python 科研绘图总结2 一 子图,三维立方体
1 子图
相关函数
axins = ax.inset_axes((0.5, 0.6, 0.2, 0.3)) #子图

axins.plot() #子图绘画

mark_inset(ax, axins, loc1=1, loc2=4, fc="none", ec='k', lw=1)#设置连线
代码
import numpy as np
import matplotlib.pyplot as plt
from mpl_toolkits.axes_grid1.inset_locator import mark_inset
from mpl_toolkits.axes_grid1.inset_locator import inset_axes
def dPlot():
data = np.load('ab1500.npz')
dList1= data['distance_advantage_us_List']
dList2=data['distance_advantage_enemy_List']
sn = len(dList1)
optimalDistanceAdvantage = [1] * sn
sLt = range(sn)
# 将数据对应图标
y_1 = dList1
y_2 = dList2
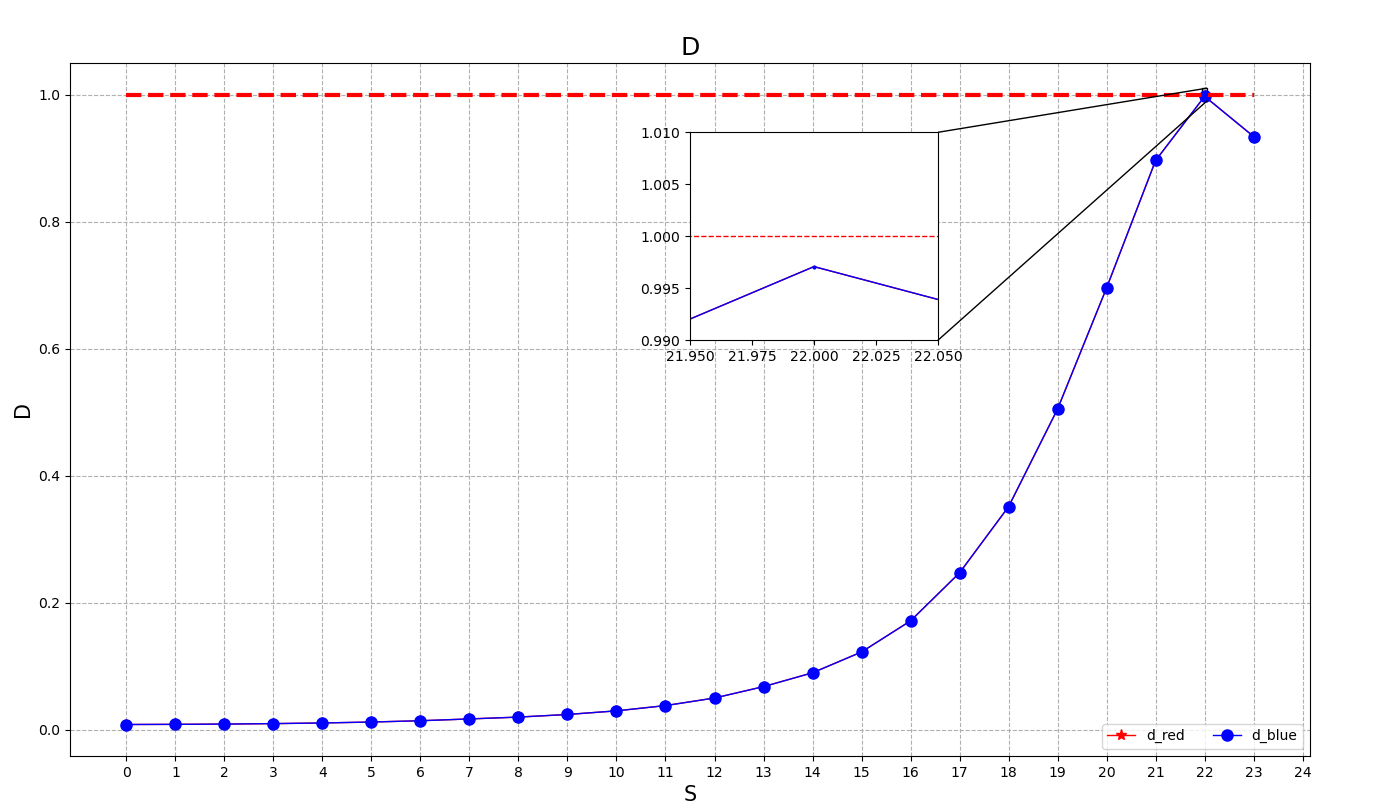
#绘制大图
fig, ax = plt.subplots(1, 1, figsize=(16, 9))
ax.plot(sLt, y_1, color='red', linestyle='-', linewidth=1,
marker='*', markersize=8,
markerfacecolor='red')
ax.plot(sLt, y_2, color='blue', linestyle='-', linewidth=1,
marker='o', markersize=8,
markerfacecolor='blue')
ax.plot(sLt, optimalDistanceAdvantage, color='red', linestyle='--', linewidth=3, )
#设置坐标轴等信息
plt.grid(ls='--')
my_ticks = np.arange(0, sn + 1, 1)
plt.xticks(my_ticks)
ax.set_title('D', fontsize=18)
ax.set_xlabel('S', fontsize=15)
ax.set_ylabel('D', fontsize=15)
# bbox_props = dict(boxstyle="round", fc='w', ec="w", lw=2)
# ax.text(0, 1400, 'D=1200',
# ha="left", va="center", size=15, bbox=bbox_props)
#嵌入局部放大图的坐标系
ax.legend(labels=["d_red", "d_blue"], ncol=3)
# axins = inset_axes(ax, width="40%", height="30%", loc='upper left',
# bbox_to_anchor=(0.75, 0.2, 0.6, 0.6),
# bbox_transform=ax.transAxes)
axins = ax.inset_axes((0.5, 0.6, 0.2, 0.3))
# #在子图中绘制原始数据
axins.plot(sLt, y_1, color='red', linestyle='-', linewidth=1,
marker='*', markersize=2,
markerfacecolor='red')
#
axins.plot(sLt, y_2, color='blue', linestyle='-', linewidth=1,
marker='o', markersize=2,
markerfacecolor='blue')
#
axins.plot(sLt, optimalDistanceAdvantage, color='RED', linestyle='--', linewidth=1,
)
#
# #设置放大区间
# # 设置放大区间
# zone_left = 21
# zone_right = 22
#
# # 坐标轴的扩展比例(根据实际数据调整)
# x_ratio = 0.8 # x轴显示范围的扩展比例
# y_ratio = 0.8 # y轴显示范围的扩展比例
#
# # X轴的显示范围
# # xlim0 = x[zone_left] - (x[zone_right] - x[zone_left]) * x_ratio
# # xlim1 = x[zone_right] + (x[zone_right] - x[zone_left]) * x_ratio
xlim0 = 21.95
xlim1 = 22.05
# # Y轴的显示范围
#
ylim0 = 0.99
ylim1 = 1.01
#
# # 调整子坐标系的显示范围
axins.set_xlim(xlim0, xlim1)
axins.set_ylim(ylim0, ylim1)
#
# #设置基本信息
#
#
# # 建立父坐标系与子坐标系的连接线
# # loc1 loc2: 坐标系的四个角
# # 1 (右上) 2 (左上) 3(左下) 4(右下)
mark_inset(ax, axins, loc1=1, loc2=4, fc="none", ec='k', lw=1)
# 显示
plt.savefig('dA.pdf')
plt.show()
dPlot()
效果
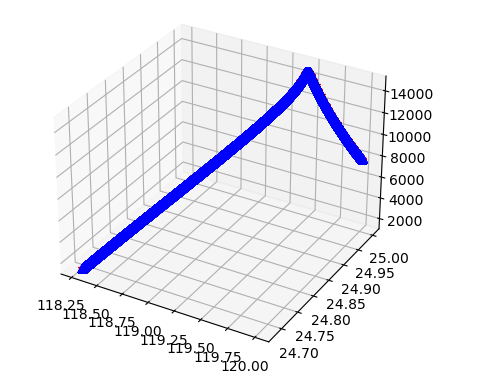
2 三维图
相关函数
ax = fig.add_subplot(projection='3d')
ax.plot
代码
fig = plt.figure()
ax = fig.add_subplot(projection='3d')
ax.plot(pos_101_lon[0: i + 1:1000], pos_101_lat[0: i + 1:1000],pos_101_alt[0: i + 1:1000], color='r', label="R001", marker="*")
效果
3 三维动图
相关函数
imageio.mimsave()
代码
import imageio

image_list = []
plt.rcParams.update({'figure.max_open_warning': 0})

for i in range(0,step,1000):
    print(i)
    fig = plt.figure()
    ax = fig.add_subplot(projection='3d')
    # ax.set_xlabel('X', fontsize=15)
    # ax.set_ylabel('Y', fontsize=15)
    #
    # plt.xticks(size=15)
    # plt.yticks(size=15)
    # ax.set_title('Battle Process', fontsize=18)
    # ax.set_xlim(-2500, 750)
    # ax.set_ylim(-1250, 750)

    ax.plot(pos_101_lon[0: i + 1:1000], pos_101_lat[0: i + 1:1000],pos_101_alt[0: i + 1:1000], color='r', label="R001", marker="*")
    ax.plot(pos_201_lon[0: i + 1], pos_201_lat[0: i + 1],pos_201_alt[0: i + 1], color='b', label="B001", marker='^')
    # ax.legend(loc='upper left')
    plt.savefig('temp.png')

    image_list.append(imageio.imread('temp.png'))
    # plt.pause(0.1)
imageio.mimsave('uav_battle.gif', image_list, duration=0.2)
效果
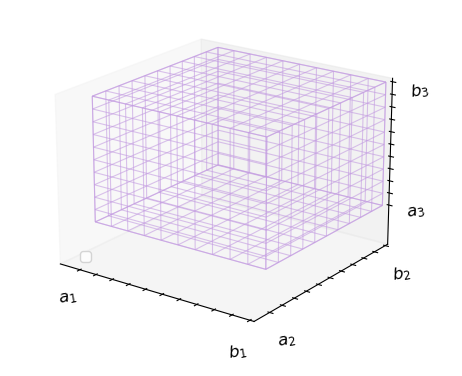
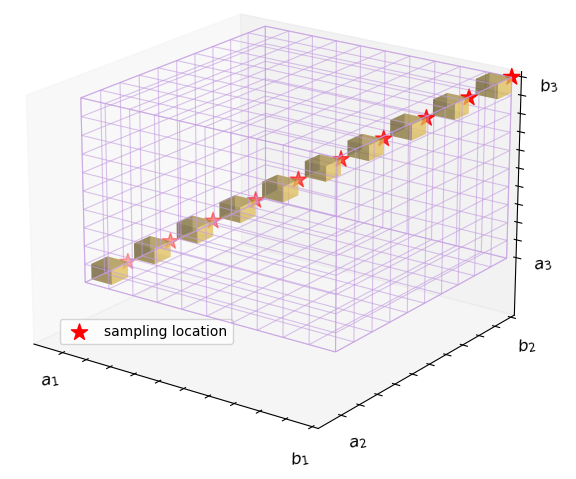
4 三维立方体
相关函数
ax.plot_wireframe()
ax.bar3d()
ax.scatte
代码
import numpy as np
from matplotlib import pyplot as plt
from mpl_toolkits.mplot3d import Axes3D, axes3d
import matplotlib as mpl

# 这里给出封装好的函数,接下来我们进行解析


def plot_cuboid(center, size):
    """
     Create a data array for cuboid plotting.


     ============= ================================================
     Argument  Description
     ============= ================================================
     center  center of the cuboid, triple
     size   size of the cuboid, triple, (x_length,y_width,z_height)
     :type size: tuple, numpy.array, list
     :param size: size of the cuboid, triple, (x_length,y_width,z_height)
     :type center: tuple, numpy.array, list
     :param center: center of the cuboid, triple, (x,y,z)
    """


    ox, oy, oz = center
    l, w, h = size
    color = '#C39BE1'
    width = 0.8

    x = np.linspace(ox - l / 2, ox + l / 2, num=11)
    y = np.linspace(oy - w / 2, oy + w / 2, num=11)
    z = np.linspace(oz - h / 2, oz + h / 2, num=11)

    x1, z1 = np.meshgrid(x, z)
    y11 = np.ones_like(x1) * (oy - w / 2)
    y12 = np.ones_like(x1) * (oy + w / 2)
    x2, y2 = np.meshgrid(x, y)
    z21 = np.ones_like(x2) * (oz - h / 2)
    z22 = np.ones_like(x2) * (oz + h / 2)
    y3, z3 = np.meshgrid(y, z)
    x31 = np.ones_like(y3) * (ox - l / 2)
    x32 = np.ones_like(y3) * (ox + l / 2)

    #设置图片大小

    fig = plt.figure( frameon=False) #
    ax = fig.add_subplot(111, projection='3d')

    # fig ,ax = plt.subplots( projection='3d')
    # outside surface
    ax.plot_wireframe(x1, y11, z1, color=color, rstride=1, cstride=1, alpha=0.6,linewidth=width)
    # inside surface
    ax.plot_wireframe(x1, y12, z1, color=color, rstride=1, cstride=1, alpha=0.6,linewidth=width)
    # bottom surface
    ax.plot_wireframe(x2, y2, z21, color=color, rstride=1, cstride=1, alpha=0.6,linewidth=width)
    # # upper surface
    ax.plot_wireframe(x2, y2, z22, color=color, rstride=1, cstride=1, alpha=0.6,linewidth=width)
    # left surface
    ax.plot_wireframe(x31, y3, z3, color=color, rstride=1, cstride=1, alpha=0.6,linewidth=width)
    # # right surface
    ax.plot_wireframe(x32, y3, z3, color=color, rstride=1, cstride=1, alpha=0.6,linewidth=width)

    # # 设置坐标轴范围
    # ax.set_xlim(-2,11)
    # ax.set_ylim(-2, 11)
    # ax.set_zlim(-2, 11)

    # 设置显示网格线
    ax.grid(False)


    #设置坐标轴范围
    ax.set_xlim(12)
    ax.set_ylim(12)
    ax.set_zlim(14)
    # 设置数值
    ax.set_xticks(np.linspace(1, 11, 11))
    ax.set_yticks(np.linspace(1, 11, 11))
    ax.set_zticks(np.linspace(1, 11, 11))

    # 设置标签
    ax.set_xticklabels(
        ["$b_1$", " ", " ", " ", " ", " ", " ", " ", " ", " ", "$a_1$"],
        fontsize=12, rotation=10)
    ax.set_yticklabels(
        [ "$b_2$", " ", " ", " ", " ", " ", " ", " ", " ", " ", "$a_2$"],
        fontsize=12, rotation=10)
    ax.set_zticklabels(
        [ "$b_3$", " ", " ", " ", " ", " ", " ", " ", " ", " ", "$a_3$"],
        fontsize=12, rotation=10)

    #绘制取样点和取样区域
    X = np.arange(1,11)
    print(X)
    Y = np.arange(1,11)
    print(Y)
    Z = np.arange(1,11)
    print(Z)
    width = 0.85
    depth =  0.85
    height =  0.85

    mpl.rcParams['legend.fontsize'] = 10
    ax.bar3d(X, Y, Z, dx=width, dy=depth, dz=height, color='#FFD966', alpha=0.5, shade=True)  # 绘制条形图
    ax.scatter(X, Y, Z, s= 150,c='red', marker='*',label='sampling location',norm=1)  # 绘制散点图

    plt.legend(loc='lower left',bbox_to_anchor=(0.1, 0.25))

    #设置图例位置
    #ax.legend( bbox_to_anchor=(1.05, 0), loc=3, borderaxespad=0)# borderaxespad=0

    #改变视角
    ax.view_init(elev=20,azim=-54)
    #消除边框空白
    # plt.tight_layout()
    # plt.margins(0,0,0)
    # plt.subplots_adjust(top=1,bottom=0,left=0,right=1,hspace=0,wspace=0)


    #保存并展示
    #plt.savefig('plteps.eps', format='eps', bbox_inches='tight',dpi=100) #
    plt.show()


def mPrint():
    center = [6, 6, 6]
    length = 10
    width = 10
    height = 10
    plot_cuboid(center, (length, width, height))

mPrint()
效果
本文来自博客园,作者:{珇逖},转载请注明原文链接:https://www.cnblogs.com/zuti666/p/17118808.html
