Python 科研绘图总结1 一 颜色、散点图、中文及字体
Python 科研绘图总结1 一 颜色、散点图、中文及字体
1 颜色
plot函数的color属性 ,
[matplotlib] 颜色设置及Matplotlib颜色对照表 - 知乎 (zhihu.com)
如果想要画出来特定的颜色,当自己又不确定是啥,可以先把图放到ppt中,使用取色器得到颜色的代码,然后直接将代码作为颜色的属性,就可以得到想要的那个颜色了
2 设置中文及字体
plt.rcParams['font.sans-serif'] = ['SimHei']
plt.rcParams['axes.unicode_minus'] = False
plt.rcParams.update({'font.size': 12})
3 散点图
[python 散点图点的大小_python散点图绘制scatter_一颗青木的博客-CSDN博客](https://blog.csdn.net/weixin_31556371/article/details/112224367#:~:text=随机生成数据,绘制默认情况下的散点图 1 %23 s和原始数组大小一样 2 area%3D ( 30*,(x%2C y%2Cs %3Darea) 8 plt .title ( "点大小不同"))
matplotlib scatter 散点图 用文字标注每个点_蓄发的博客-CSDN博客_matplotlib 散点图标注
plt.scatter([target_x[1], target_x[5], target_x[6]],
            [target_y[1], target_y[5], target_y[6]],
            s=[target_value[1], target_value[5], target_value[6]],
            color='#C05046', label='智能体1分配目标')
 plt.annotate( i + 1,
              xy=(target_x[i], target_y[i]),
              xytext=(target_x[i] - 10, target_y[i] - 10))
4 给图上添加箭头
matplotlib 画箭头的两种方式_带着耳机去梦游的博客-CSDN博客_matplotlib 画图箭头
matplotlib绘制箭头_呆萌的代Ma的博客-CSDN博客_matplotlib 画图箭头
相关函数
plt.arrow()
plt.annotate()
plt.arrow(agent_x[0], agent_y[0], target_x[1] - agent_x[0], target_y[1] - agent_y[0],
          shape='full', width=1, head_width=10, head_length=15, length_includes_head=True,
          linestyle='-',
          fc='red', ec='#C05046', alpha=0.9, overhang=0.2)
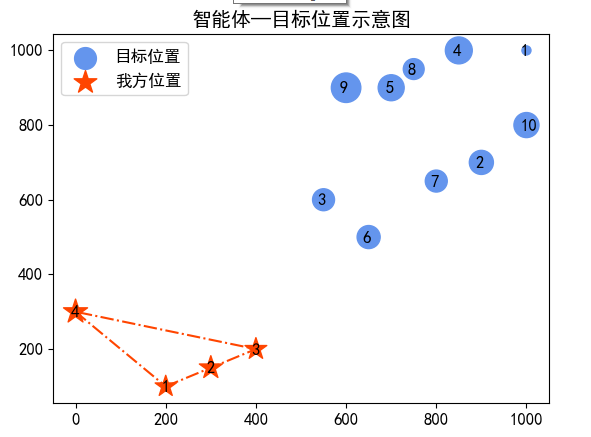
5 效果
本文来自博客园,作者:{珇逖},转载请注明原文链接:https://www.cnblogs.com/zuti666/p/17118686.html
