
Prometheus源码专题【左扬精讲】——Prometheus基本概念
Prometheus源码专题精讲——Prometheus基本概念
https://prometheus.io/docs/concepts
一、Prometheus中的FPoint:时间序列数据的基础
在Prometheus这个开源监控和警报工具套件中,FPoint是一个核心且基础的数据结构。它扮演着表示给定时间戳下的浮点数数据点的角色,是Prometheus数据处理和查询机制中的关键要素。
深入理解FPoint对于掌握Prometheus的工作原理至关重要。Prometheus.io 官网找了半天也没有找到这块的描述,但是 Prometheus 源码有,借此就讲讲。
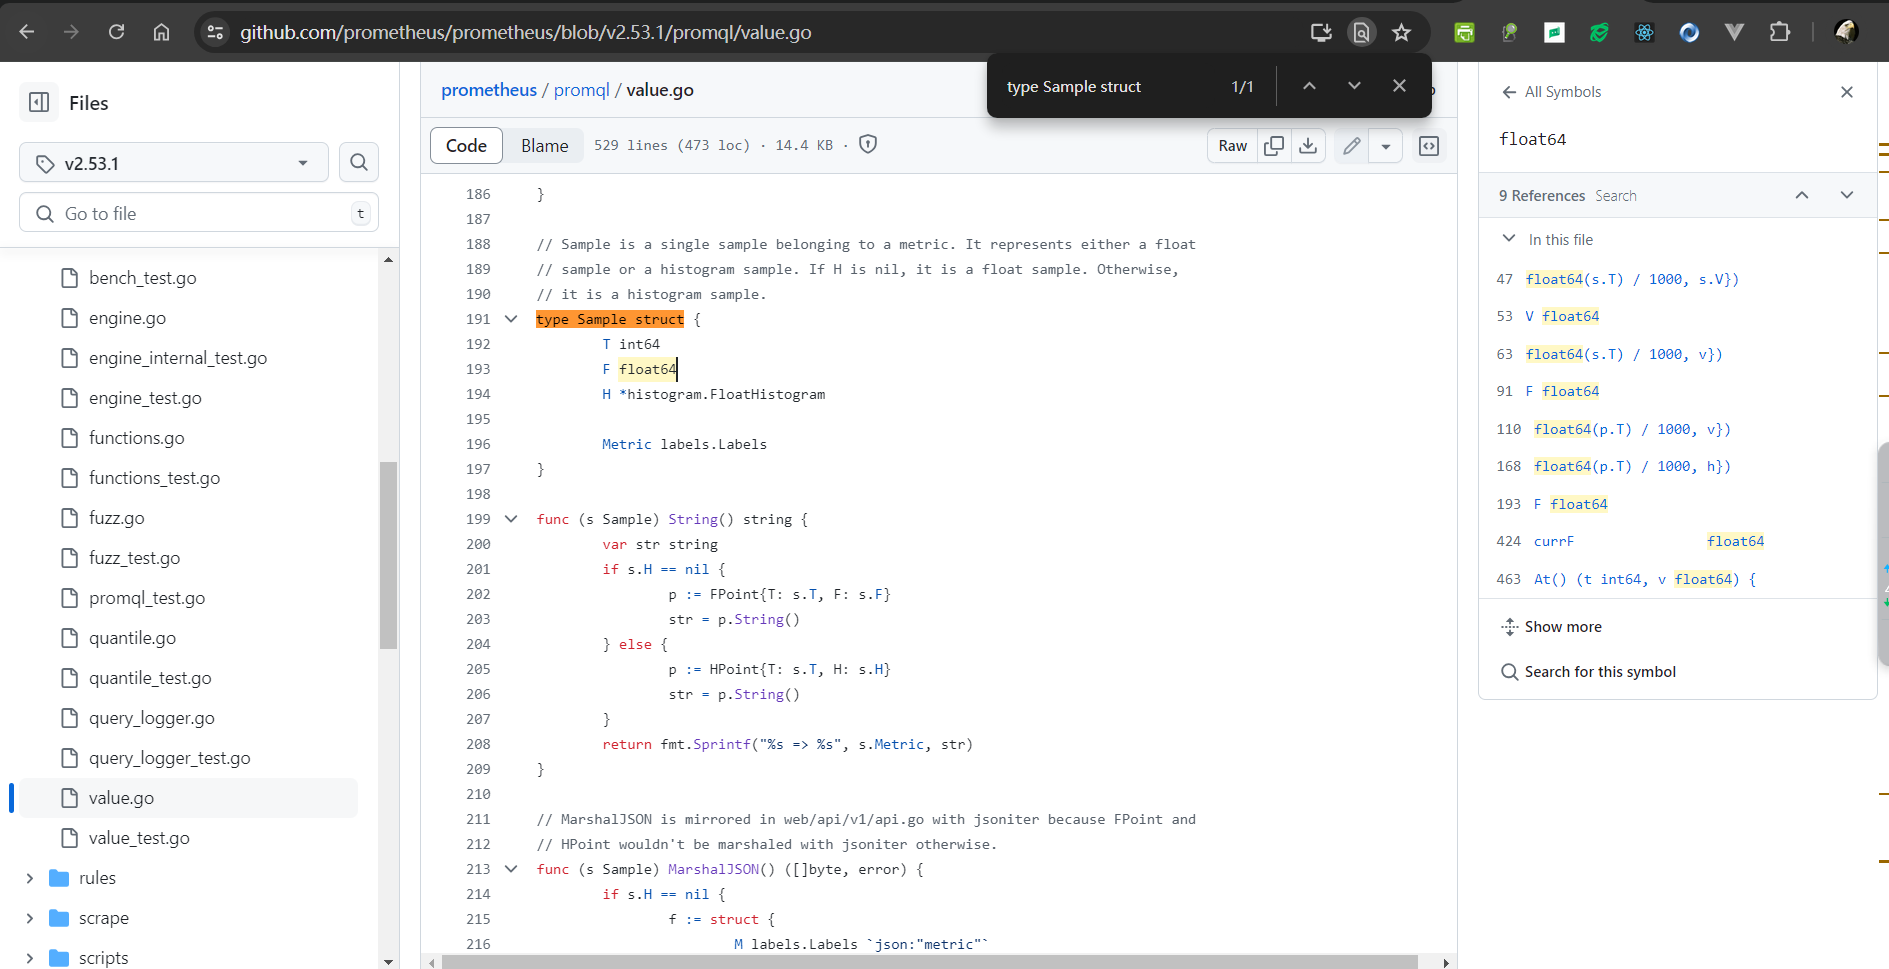
以prometheus-v2.53.1(Current Latest Release)源代码位置为例:https://github.com/prometheus/prometheus/blob/release-2.53.1/promql/value.go
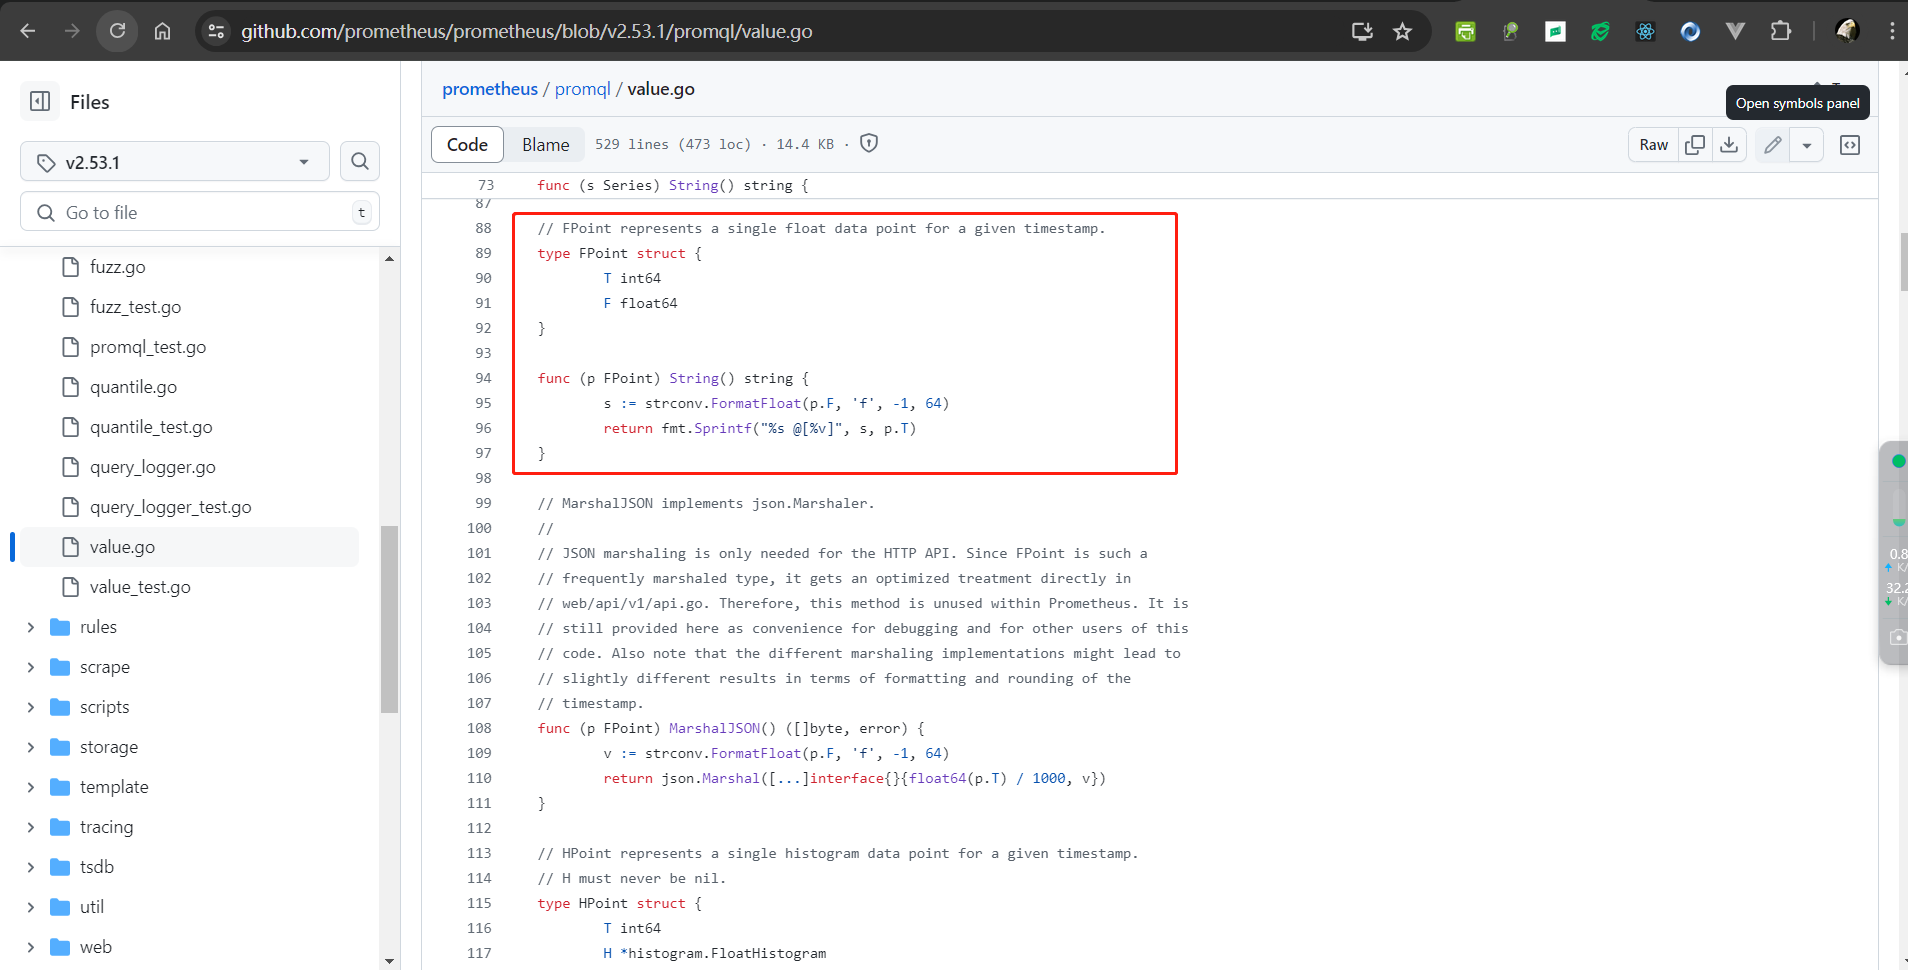
1.1、FPoint结构体解析
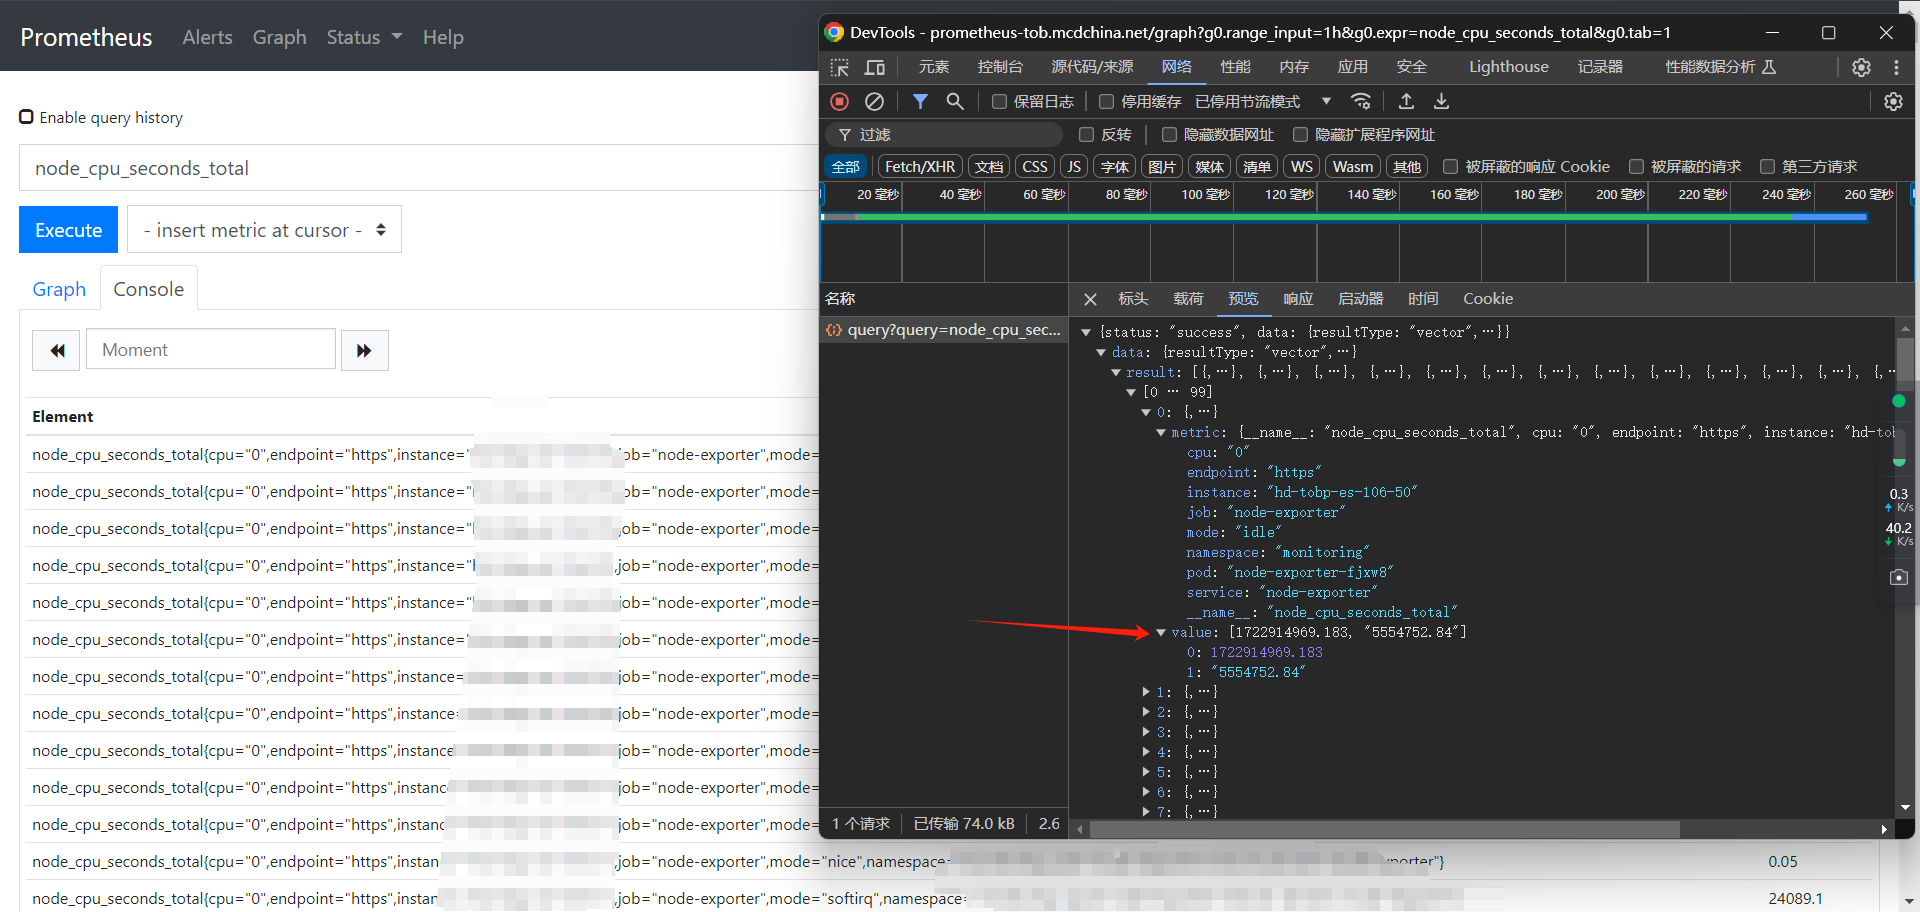
FPoint结构体由两个主要字段组成:T和F,就是下图中红色箭头指向的那个value的值,分别对应T字段和F字段。
T字段是一个int64类型,它代表数据点的时间戳。在Prometheus中,时间戳以毫秒为单位的Unix时间戳来表示,这提供了高精度的时间记录。F字段是一个float64类型,它表示在给定时间戳T下的实际浮点数值。这个值可以是任何类型的度量指标,如CPU使用率、内存消耗或网络流量等。
1.2、FPoint的作用
FPoint是Prometheus存储和查询时间序列数据的基础单元。每个时间序列数据点都可以用FPoint来表示,这使得Prometheus能够有效地处理和分析大量的时间序列数据。
当你通过PromQL(Prometheus Query Language)查询某些指标时,Prometheus会从其存储系统中检索相应的数据点,并将它们作为FPoint对象的序列返回。这使得你可以对时间序列数据进行各种操作,如聚合、计算或绘制图表。
1.3、使用场景
FPoint在Prometheus中的使用场景非常广泛:
- 数据存储:Prometheus在存储时间序列数据时,会将每个数据点转换为
FPoint格式,并存储在磁盘上。 - 数据查询:当你执行PromQL查询时,Prometheus会返回一系列
FPoint对象,每个对象代表查询结果中的一个数据点。 - 数据处理:在Prometheus内部,对时间序列数据的各种处理操作(如聚合、计算等)都会涉及到
FPoint。这使得Prometheus能够高效地处理和分析时间序列数据。
二、Prometheus中的DATA MODEL
https://prometheus.io/docs/concepts/data_model/#data-model
在Prometheus的源码(特别是release-2.53.1版本)和文档体系中,数据模型是理解其存储、查询及操作的基础。
从Prometheus官方文档中的“Data Model”部分以及GitHub上的源码来看,Prometheus将所有数据根本性地存储为时间序列(Time Series)。这些时间序列是同一指标(metric)和相同标签集(label set)下的带时间戳值的流。此外,Prometheus还能通过查询生成临时的派生时间序列。
2.1、时间序列(Time Series)
https://prometheus.io/docs/concepts/data_model/#metric-names-and-labels
在Prometheus中,时间序列是数据模型的核心。每个时间序列由以下几部分组成:
-
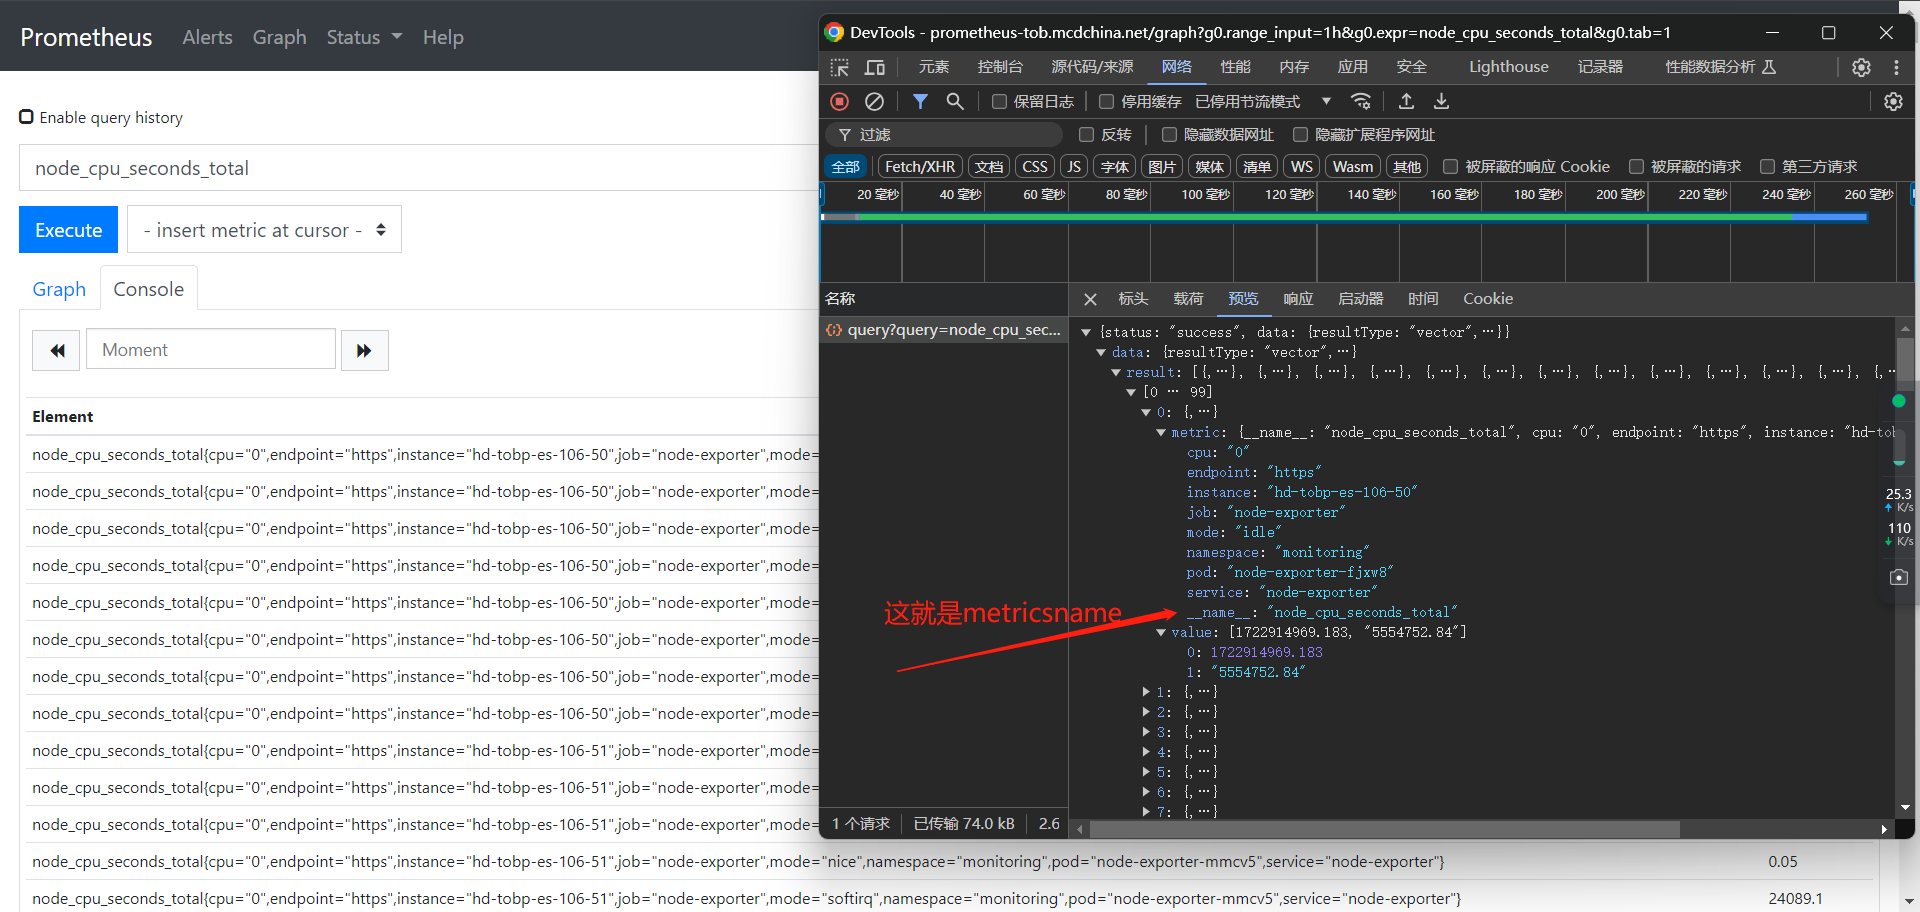
Metric Name:标识测量的特定特征或属性,例如
http_requests_total表示接收到的HTTP请求总数。- https://prometheus.io/docs/concepts/data_model/#metric-names-and-labels
- Specify the general feature of a system that is measured (e.g.
http_requests_total- the total number of HTTP requests received). - Metric names may contain ASCII letters, digits, underscores, and colons. It must match the regex
[a-zA-Z_:][a-zA-Z0-9_:]*.
- Specify the general feature of a system that is measured (e.g.
- https://prometheus.io/docs/concepts/data_model/#metric-names-and-labels
-
Labels:标签是键值对,用于对指标进行额外的维度描述。比如,一个HTTP请求指标可以有
method="POST"和handler="/messages"这样的标签,以区分不同方法或处理程序的请求。这些标签共同定义了时间序列的维度。- https://prometheus.io/docs/concepts/data_model/#metric-names-and-labels
- Enable Prometheus's dimensional data model to identify any given combination of labels for the same metric name. It identifies a particular dimensional instantiation of that metric (for example: all HTTP requests that used the method
POSTto the/api/trackshandler). The query language allows filtering and aggregation based on these dimensions. - The change of any label's value, including adding or removing labels, will create a new time series.
- Labels may contain ASCII letters, numbers, as well as underscores. They must match the regex
[a-zA-Z_][a-zA-Z0-9_]*. - Label names beginning with
__(two "_") are reserved for internal use. - Label values may contain any Unicode characters.
- Labels with an empty label value are considered equivalent to labels that do not exist.
- Enable Prometheus's dimensional data model to identify any given combination of labels for the same metric name. It identifies a particular dimensional instantiation of that metric (for example: all HTTP requests that used the method
- https://github.com/prometheus/prometheus/blob/v2.53.1/model/labels/labels.go
https://github.com/prometheus/prometheus/blob/v2.53.1/model/labels/labels.go:

//go:build !stringlabels && !dedupelabels

package labels

import (
	"bytes"
	"slices"
	"strings"

	"github.com/cespare/xxhash/v2"
)

// Labels is a sorted set of labels. Order has to be guaranteed upon
// instantiation.
type Labels []Label
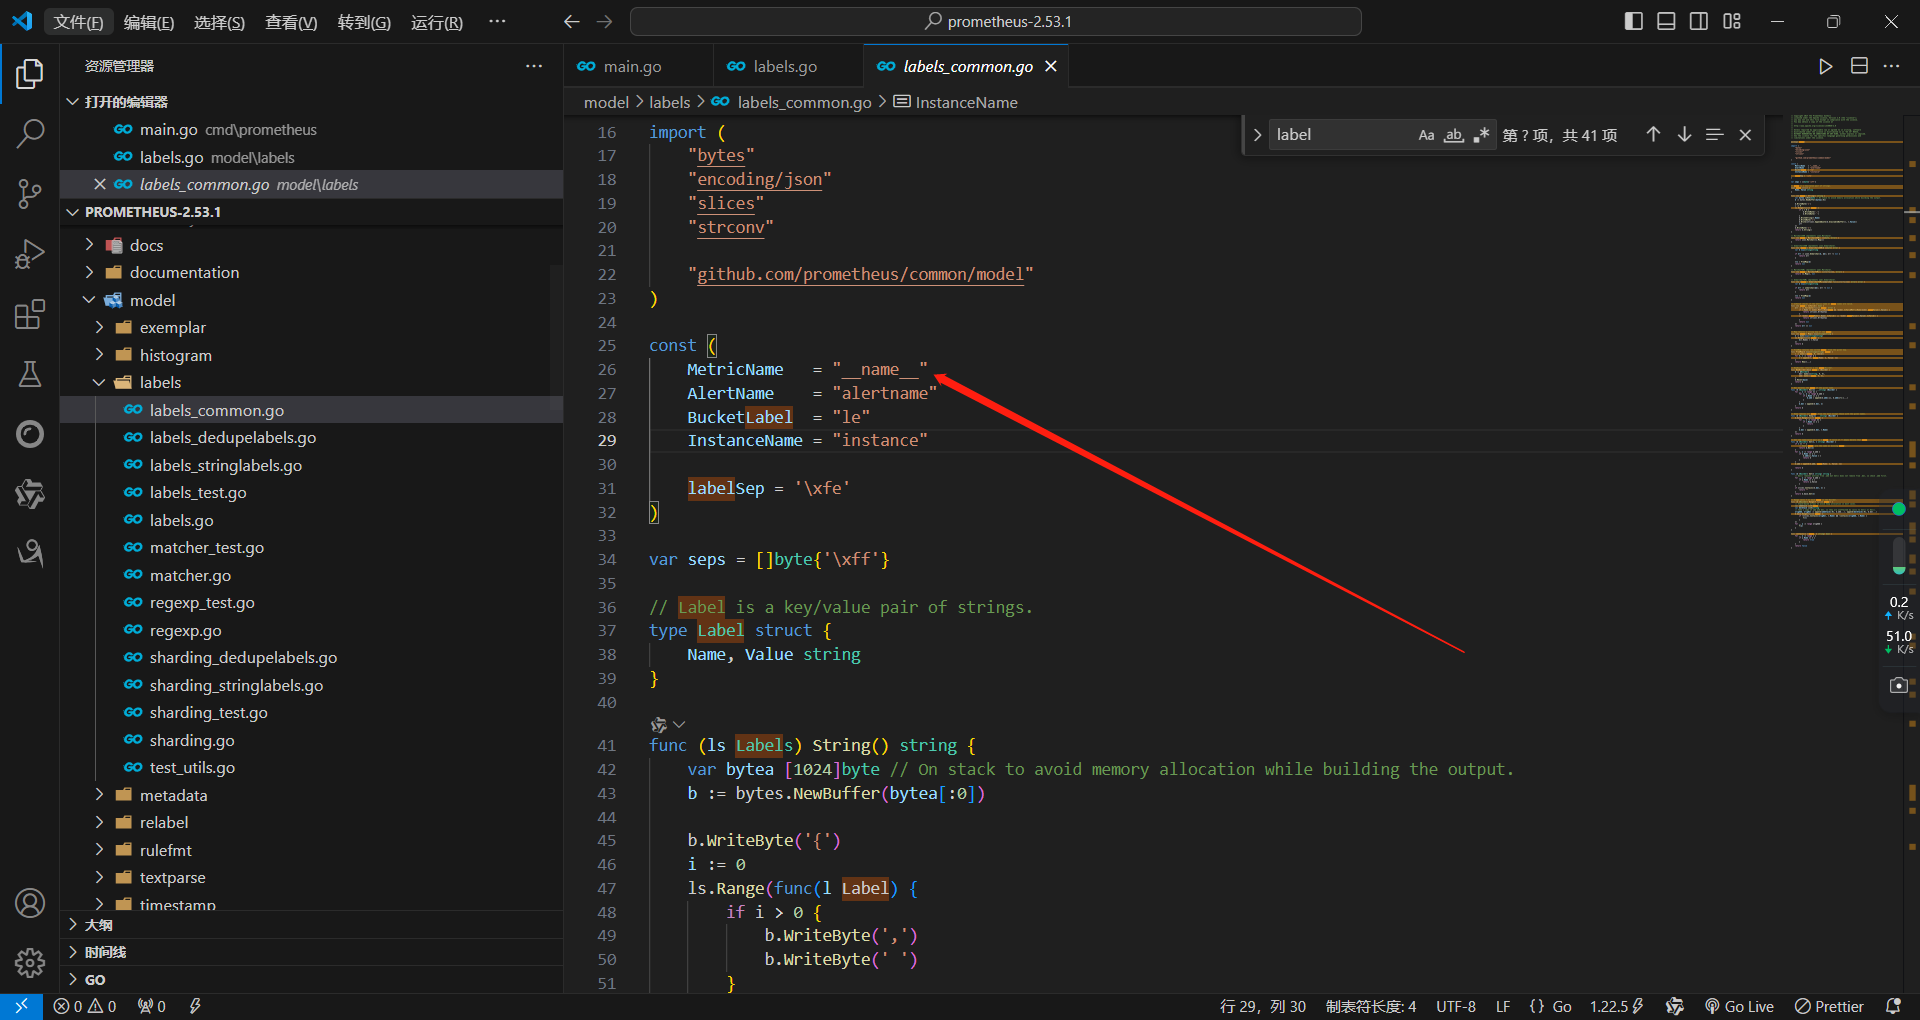
https://github.com/prometheus/prometheus/blob/v2.53.1/model/labels/labels_common.go:

package labels

import (
	"bytes"
	"encoding/json"
	"slices"
	"strconv"

	"github.com/prometheus/common/model"
)

const (
	MetricName   = "__name__"
	AlertName    = "alertname"
	BucketLabel  = "le"
	InstanceName = "instance"

	labelSep = '\xfe'
)

var seps = []byte{'\xff'}

// Label is a key/value pair of strings.
type Label struct {
	Name, Value string
}
- https://prometheus.io/docs/concepts/data_model/#metric-names-and-labels
-
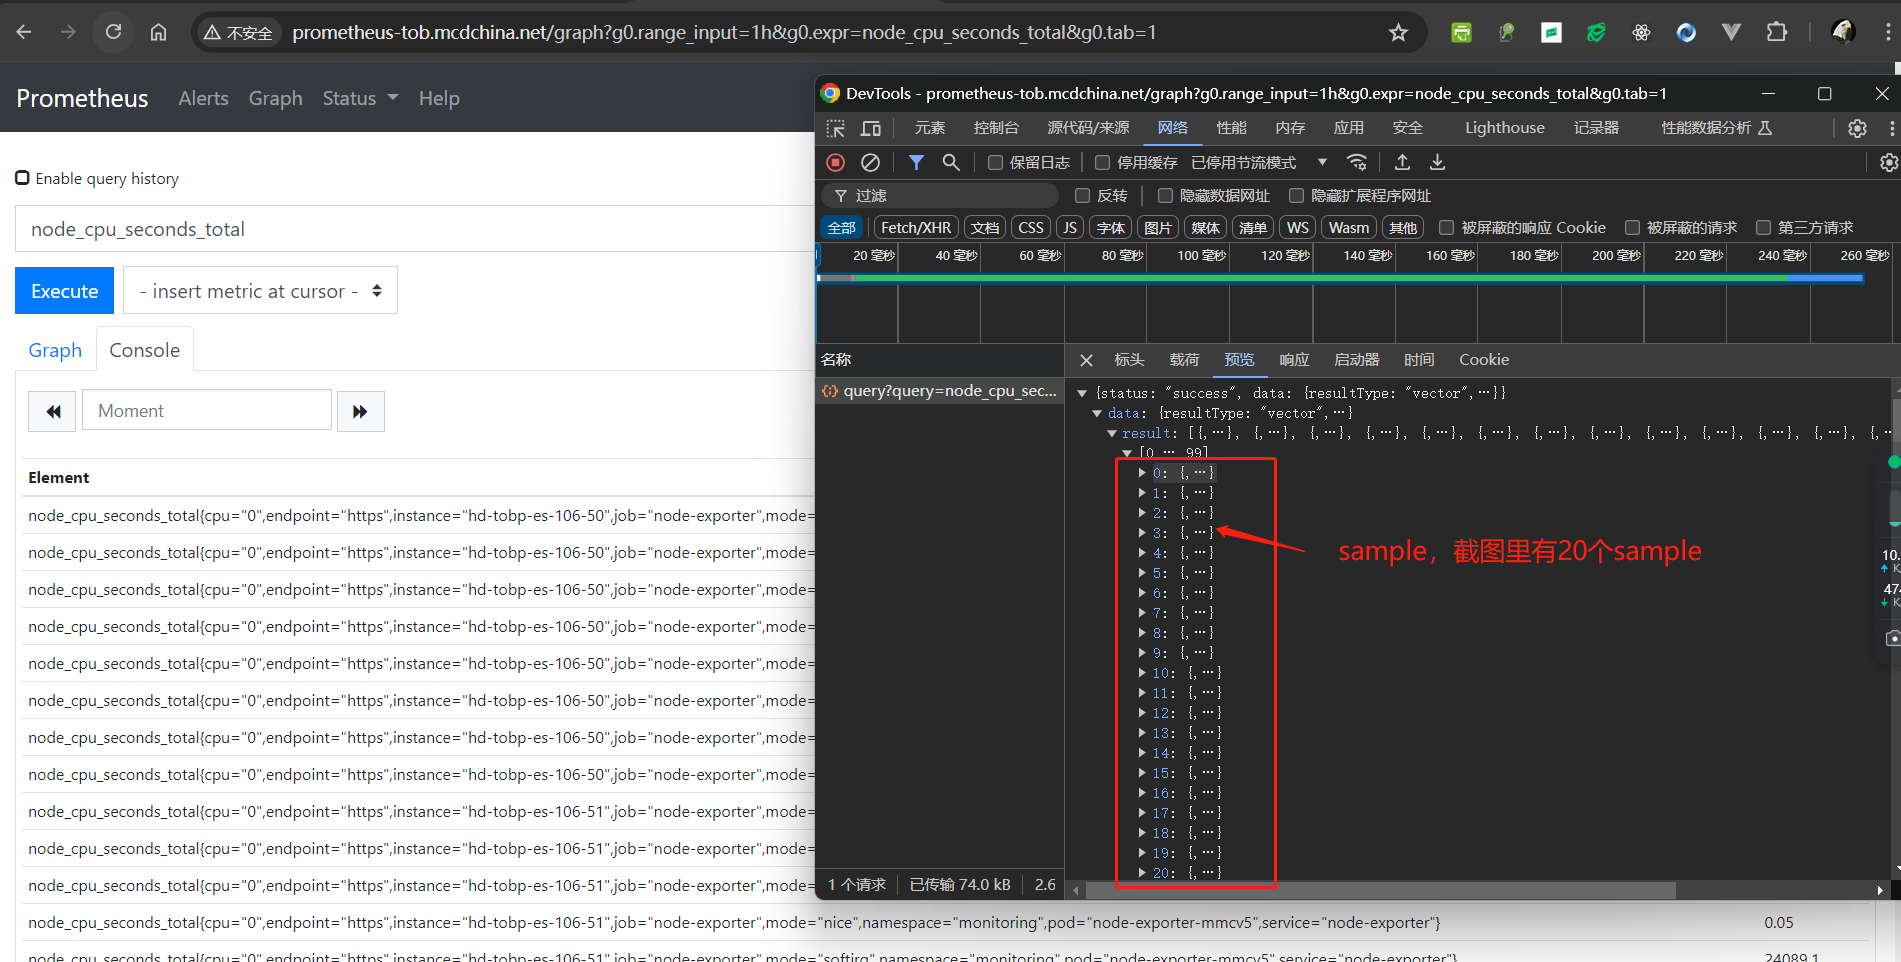
样本(Samples):每个时间序列由一系列样本组成,每个样本包含:
-
- https://prometheus.io/docs/concepts/data_model/#samples
- 一个
float64值:表示测量的具体数值。 - 一个时间戳:表示样本被记录的时间点,Prometheus中的时间戳通常以毫秒为单位。
- https://github.com/prometheus/prometheus/blob/v2.53.1/promql/value.go
-
-
- 一个
- https://prometheus.io/docs/concepts/data_model/#samples
-
三、notation(n.符号;以符号表达;备忘录;作笔记,我理解中文意思表达式?)
https://prometheus.io/docs/concepts/data_model/#notation
在 Prometheus 中,时间序列的标识和查询采用了一种特定的符号表示法。这种表示法允许用户通过组合指标名称(metric name)和一组标签(labels)来唯一地识别一个时间序列。
在 Prometheus 官网中,原话:Given a metric name and a set of labels, time series are frequently identified using this notation:
<metric name>{<label name>=<label value>, ...}
举个官网的举的例子:For example, a time series with the metric name api_http_requests_total and the labels method="POST" and handler="/messages" could be written like this:
api_http_requests_total{method="POST", handler="/messages"}
This is the same notation that OpenTSDB uses.

 浙公网安备 33010602011771号