


云原生监控系统Prometheus——Exporter(Nginx监控)
Exporter(Nginx监控)
Nginx是比较流行的一款轻量级 Web 服务器和反向代理服务器,也是一个 IMAP/POP3/SMTP 服务,因其优良的稳定性,丰富的功能集等等优点,广受大家喜爱,所以无论网站用户访问量级别有多大,nginx 监控是必备知识。
在 Prometheus 官方文档汇总提供了 2 个 Nginx 使用的第三方 Exporter: Nginx metric Library 和 nginx-vts-exporter。这里我们使用 nginx-vts-exporter 对已经安装好的 Nginx 服务进行监控数据采集。
一、部署 nginx-module-vts
nginx-module-vts 在 Nginx 官网上的第三方网站中推荐下载页面地址 https://github.com/vozlt/nginx-module-vts,也可以直接使用 git 进行 clone 操作 git clone git://github.com/vozlt/nginx-module-vts.git。
-
- Clone the git repository.
1
shell> git clone git://github.com/vozlt/nginx-module-vts.git - Add the module to the build configuration by adding --add-module=/path/to/nginx-module-vts
- Build the nginx binary.
- Install the nginx binary.
- Clone the git repository.
模块加载完成后,需要在 Nginx 配置文件中添加如下格式的配置内容:
1 2 3 4 5 6 7 8 9 10 11 12 13 14 15 | http { vhost_traffic_status_zone; ... server { ... location /status { vhost_traffic_status_display; vhost_traffic_status_display_format html; } }} |
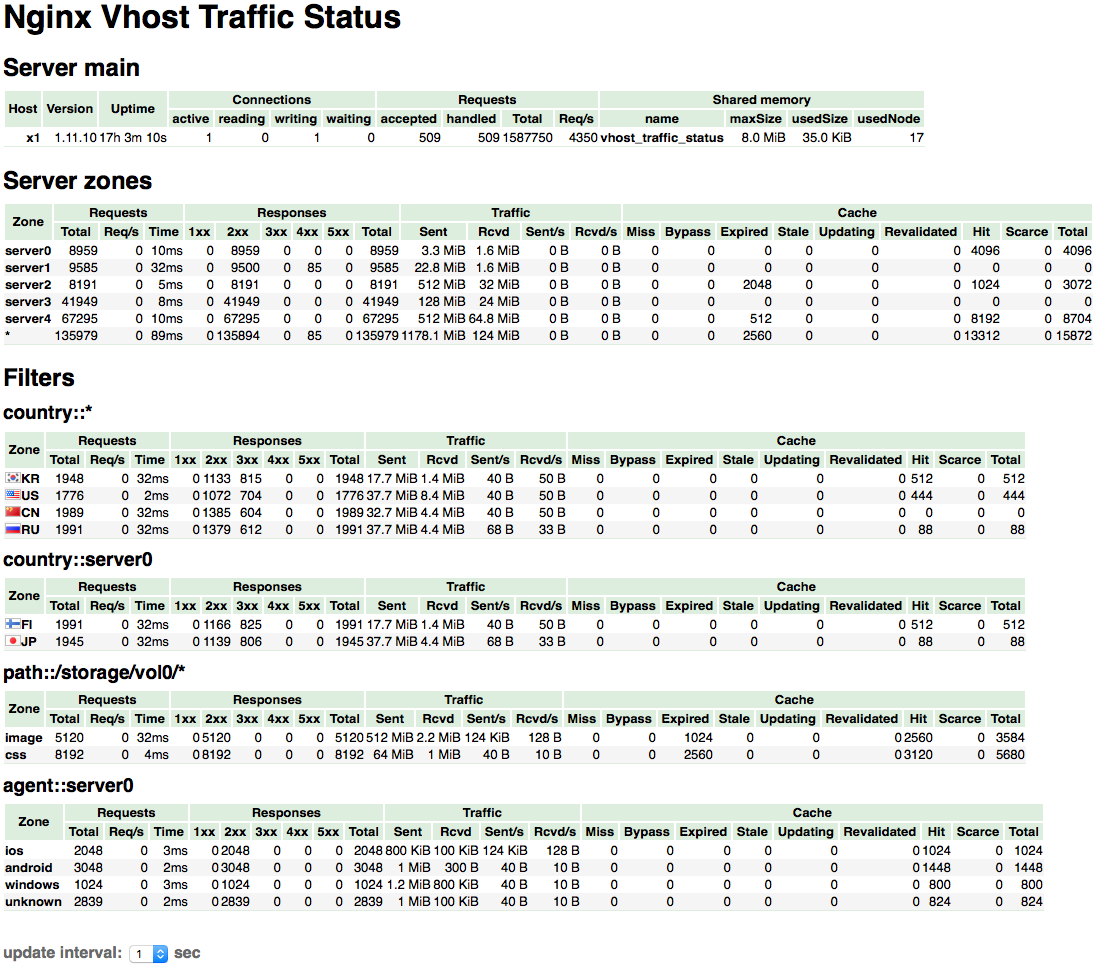
正确添加后,重新加载 Ngiinx 配置文件使配置生效,通过浏览器访问 /status,若可以看到如下的页面内容,说明 Nginx 模块 nginx-module-vts 已经开始正常运行。
二、与 Prometheus 集成
在 Prometheus 的配置文件 prometheus.yml 中继续追加 status_configs 来采集 redis_exporter 提供的数据。添加的参考配置内容如下:
1 2 3 4 5 6 7 8 9 10 11 12 13 14 15 16 17 18 19 20 21 22 23 24 25 26 27 28 | scrape_configs: # The job name is added as a label `job=<job_name>` to any timeseries scraped from this config. - job_name: "prometheus" # metrics_path defaults to '/metrics' # scheme defaults to 'http'. static_configs: - targets: ["localhost:9090"] - job_name: "node_exporter" static_configs: - targets: ["192.168.2.121:9100"] - job_name: "mysqld_exporter" scrape_interval: 10s static_configs: - targets: ["192.168.2.121:9104"] - job_name: "redis_exporter" scrape_interval: 10s static_configs: - targets: ["192.168.2.121:9121"] - job_name: "nginx_vts_exporter" scrape_interval: 10s static_configs: - targets: ["192.168.2.121:9913"] |


【推荐】国内首个AI IDE,深度理解中文开发场景,立即下载体验Trae
【推荐】编程新体验,更懂你的AI,立即体验豆包MarsCode编程助手
【推荐】抖音旗下AI助手豆包,你的智能百科全书,全免费不限次数
【推荐】轻量又高性能的 SSH 工具 IShell:AI 加持,快人一步
· 阿里最新开源QwQ-32B,效果媲美deepseek-r1满血版,部署成本又又又降低了!
· 开源Multi-agent AI智能体框架aevatar.ai,欢迎大家贡献代码
· Manus重磅发布:全球首款通用AI代理技术深度解析与实战指南
· 被坑几百块钱后,我竟然真的恢复了删除的微信聊天记录!
· AI技术革命,工作效率10个最佳AI工具