

云原生监控系统Prometheus——Exporter概述
Exporter概述
在 Prometheus 核心组件中,Exporter 是重要的组成部分,在实际中监控样本数据的收集都是由 Exporter 完成的,Prometheus 服务器只需要定时从这些 Exporter 提供的 HTTP 服务获取监控数据即可。
Exporter 本质上是将收集的数据转化为对应的文本格式,并提供 HTTP 接口,供 Prometheus 定期采集数据。
一、Exporter 类型
通常来说可以将要 Exporter 分为两类:
- 直接采集型。
- 这类 Exporter 直接内置了相应的应用程序,用于向 Prometheus 直接提供 target 数据支持。这样设计的好处是,可以更好地监控各自系统的内部运行状态,同时也适合更多自定义监控指标的项目实施。如 cAdvisor、Kubernetes 等,它们均内置了用于向 Prometheus 提供监控数据的端点。
- 间接采集型。
- 原始监控目标并不直接支持 Prometheus,需要我们使用 Prometheus 提供的 Client Libary 编写该监控目标的监控采集程序,用户可以将该程序独立运行,去获取指定的各类监控数据监控值。比如 Node exporter,还有 Nginx exporter,以及数据库或网站 HTTP 应用类的 Expoter 等。
二、文本数据格式
在 Prometheus 监控环境中,所有返回监控样本数据的 Exporter 程序,均需要遵守 Prometheus 规范,即基于文本格式,其特点是具有更好地跨平台和可读性。
Prometheus 的所有流程都需要使用基于文本的格式。现在我们可以使用浏览器访问已经部署完成的 metrics,可以从 Prometheus Web UI 提供的页面 http://192.168.2.121:31489(我这里是nodeport端口,实际是 9090)/metrics 来获取信息:
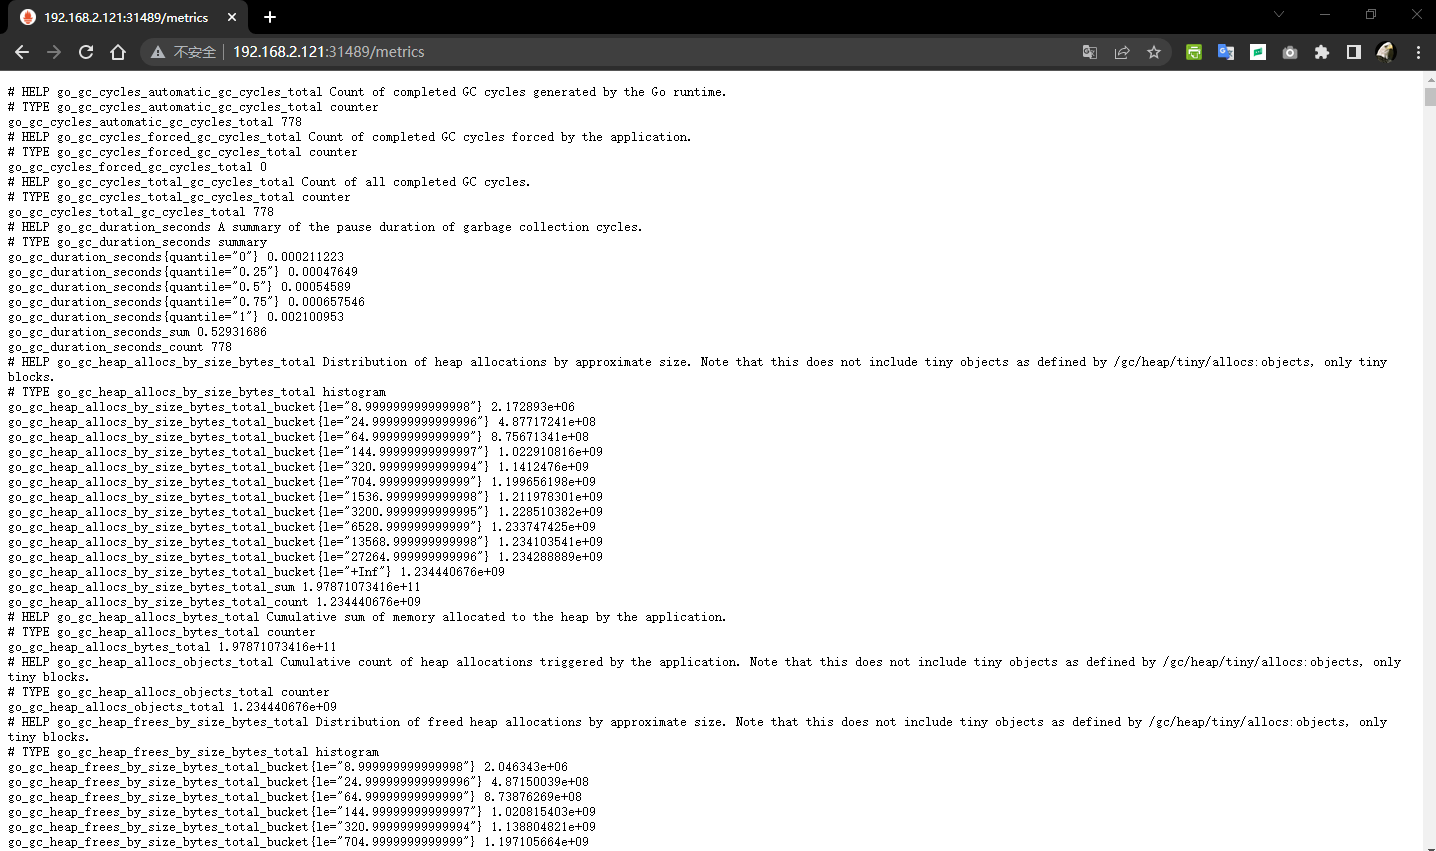
从图可以看到,Exporter 收集的数据值转化为文本内容展示。Prometheus 基于文本的格式是面向行的。行由换行符(\n)分隔,最后一行必须以换行符结尾,空行被忽略,以 # 开始的行通常都是注释内容。
-
- 以 # HELP 开始的行,表示 metric 的帮助与说明注释,可以包含当前监控指标名称和对应的说明信息。
- 以 # TYPE 开始的行,表示定义 metric 类型,可以包含当前监控指标名称和类型,类型有 Counter、Gauge、Histogram、Summary 和 Untyped。
- 以 非 # 开始的行,即监控样本数据。
- 其他一般性注释,方便阅读使用,会被 Prometheus 忽略。
针对每一行的样本需要满足以下格式:
<metric name>{<label name>=<label value>, ...}
三、获取 Exporter
Prometheus Exporter 社区很活跃,提供了支持 120+ 常见开源组件的 Exporter,一些比较有名的技术厂商都专门编写对应的 Prometheus Exporter,例如,Kubernetes,etcd 都直接内置了基于 Exporter 规范的 Metrics。
在众多的第三方提供的 Exporter 中,有一些 Exporter 作为 Prometheus GitHub 官方组织的一部分进行维护,这些 Exporter 会被标记为官方。可以在 Prometheus 官方 https://prometheus.io/docs/instrumenting/exporters/ 里可以看到常用的 Node/system metrics exporter(official),即官方进行维护的 Exporter。
我们也可以直接到 Prometheus GitHub 官网 https://github.com/prometheus 上获取对应的 Exporter 最新版本。
还有大量的 Exporter 由个人或其他机构提供和维护。
四、Prometheus软件组件
Pods 清单:
[root@k8s-masternode-2-121 ~]# kubectl get pods -n kubesphere-monitoring-system
NAME                                               READY   STATUS    RESTARTS   AGE
alertmanager-main-0                                2/2     Running   0          5h40m
kube-state-metrics-6d6786b44-fwp82                 3/3     Running   0          5h41m
node-exporter-7zqwb                                2/2     Running   0          5h42m
node-exporter-89c96                                2/2     Running   0          5h42m
node-exporter-8mv7d                                2/2     Running   0          5h42m
node-exporter-9mg99                                2/2     Running   0          5h42m
node-exporter-bcm8q                                2/2     Running   0          5h42m
node-exporter-bp8zb                                2/2     Running   0          5h42m
node-exporter-fddl4                                2/2     Running   0          5h42m
notification-manager-deployment-6f8c66ff88-dfd25   2/2     Running   0          5h37m
notification-manager-deployment-6f8c66ff88-n8qfc   2/2     Running   0          5h37m
notification-manager-operator-6455b45546-fthgc     2/2     Running   0          5h40m
prometheus-k8s-0                                   2/2     Running   0          5h40m
prometheus-operator-66d997dccf-bk685               2/2     Running   0          5h42m
thanos-ruler-kubesphere-0                          2/2     Running   0          5h39m
[root@k8s-masternode-2-121 ~]#

