Python-Matplotlib 6 直方图
Python-Matplotlib 5 直方图
Good http://blog.csdn.net/u013571243/article/details/48998619

Example 1
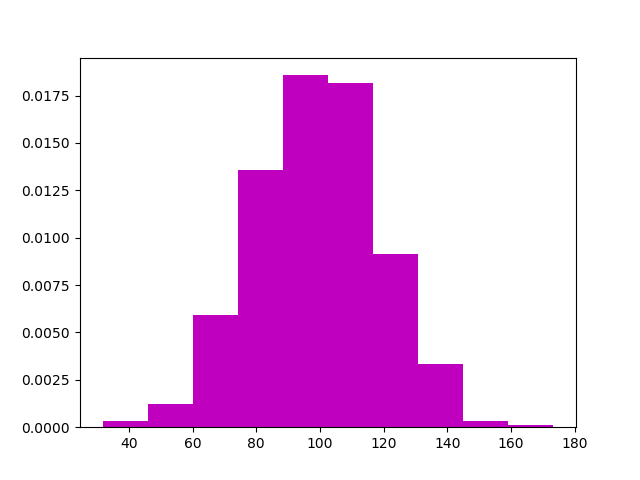
import numpy as np
import matplotlib.pyplot as plt

mu = 100 # mean of distribution
sigma = 20 # standard deviation of distribution
x = mu + sigma * np.random.randn(2000)

plt.hist(x, bins=10 , color='m' ,)
# p1 : normal = True
# p2 : ignore normal = True
plt.show()
P1

P2
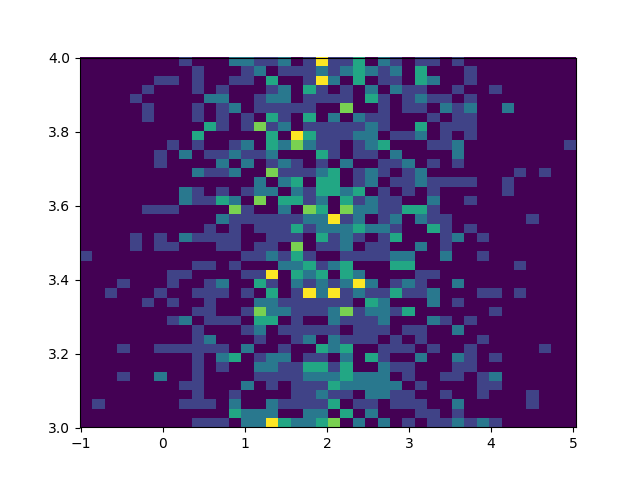
Example 2 :
import numpy as np
import matplotlib.pyplot as plt

x = np.random.randn(1000) + 2
y = np.random.rand(1000) + 3
plt.hist2d(x,y ,bins=400)
plt.show()

 浙公网安备 33010602011771号