Python-Matplotlib 3 散点图
Python-Matplotlib 3 散点图
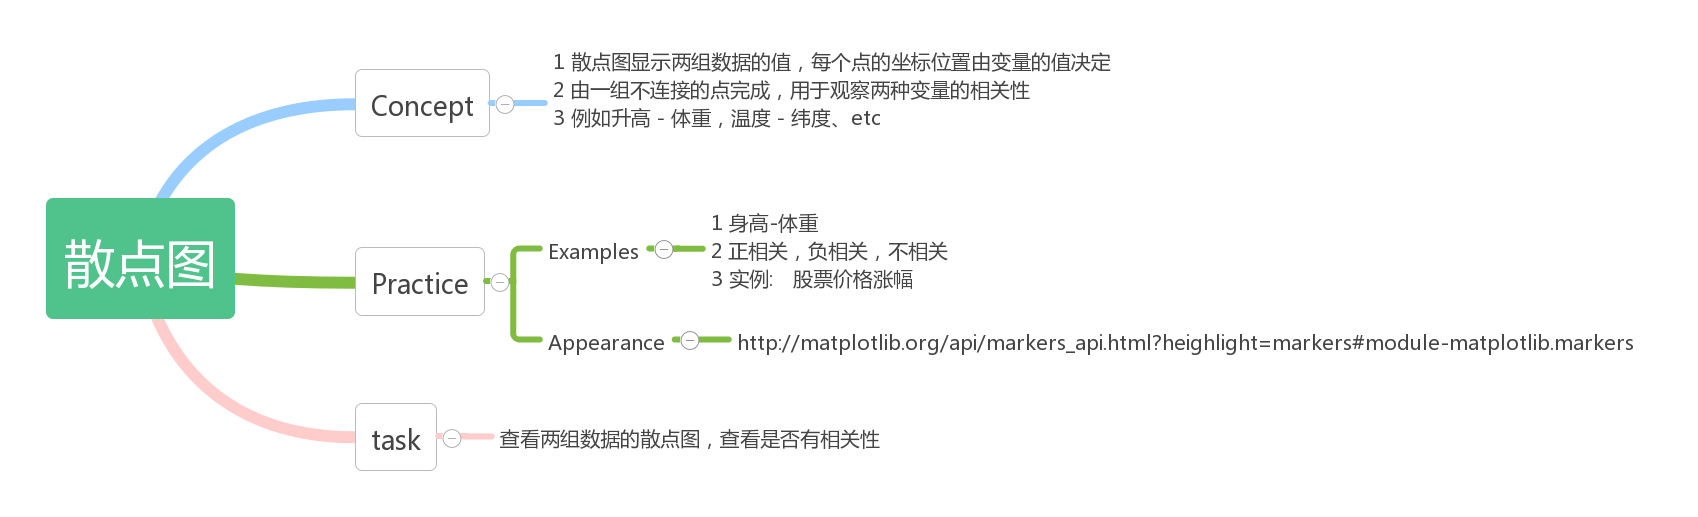
http://matplotlib.org/api/markers_api.html?heighlight=markers#module-matplotlib.markers
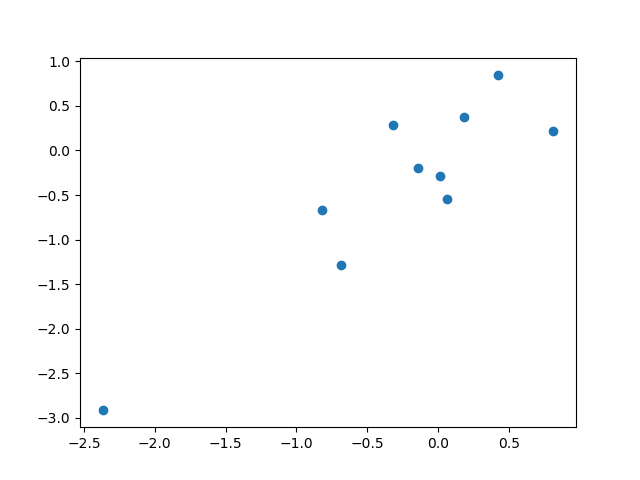
import matplotlib.pyplot as plt
import numpy as np
x = np.random.randn(10)
y = x + np.random.randn(10) * 0.5
plt.scatter(x,y)
plt.show()
Result

 浙公网安备 33010602011771号