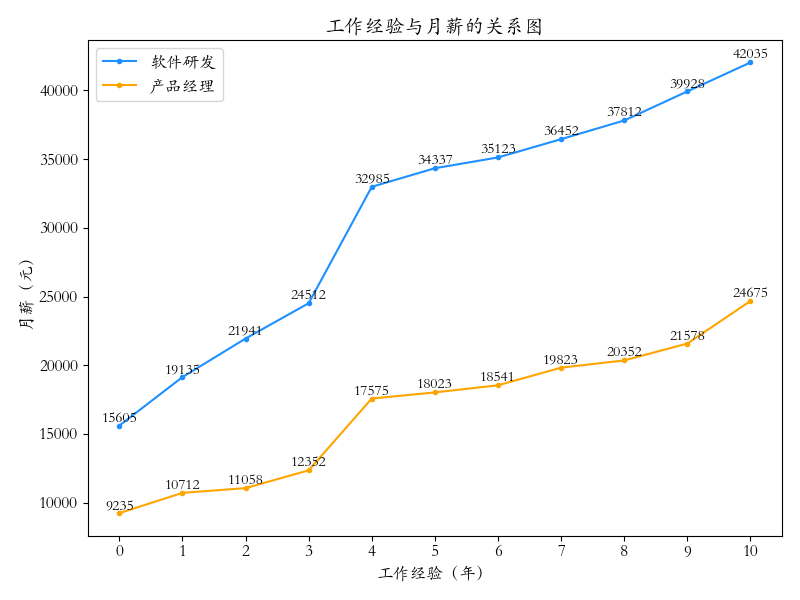
Matplotlib.pyplot.plot() 绘制折线图
Python 代码:
# 导入第三方包
import matplotlib
import matplotlib.pyplot as plt

# matplotlib其实是不支持显示中文的 显示中文需要额外设置

# 设置字体类型,宋体:SimSun  华文楷体:STKaiti  微软雅黑:Microsoft YaHei
matplotlib.rcParams['font.family'] = 'STKaiti'

# 设置字体尺寸
matplotlib.rcParams['font.size'] = 12

# 工作经验(年)
x = [0, 1, 2, 3, 4, 5, 6, 7, 8, 9, 10]

# 开发岗月薪
y_dev = [15605, 19135, 21941, 24512, 32985, 34337, 35123, 36452, 37812, 39928, 42035]

# 产品岗月薪
y_prod = [9235, 10712, 11058, 12352, 17575, 18023, 18541, 19823, 20352, 21578, 24675]

# 创建画布  num: 画布名称   figsize=(8, 6)  dpi=100  相当于设置画布分辨率为 800 * 600
plt.figure(num='e_plot', figsize=(8, 6), dpi=100)

# 设置折线图
# label: 标签    color: rgb颜色    marker: 数据节点类型    linestyle: 线的类型
plt.plot(x, y_dev, label='软件研发', color='#1E90FF', marker='.', linestyle='-')
plt.plot(x, y_prod, label='产品经理', color='orange', marker='.', linestyle='-')

# 设置横纵坐标标签
plt.xlabel(xlabel='工作经验(年)')
plt.ylabel(ylabel='月薪(元)')

# 设置X轴刻度
plt.xticks(ticks=x)

# 设置图像标签
plt.title(label='工作经验与月薪的关系图')

# 借助zip方法按顺序同时枚举多个元素
for x0, y1, y2 in zip(x, y_dev, y_prod):
    # 对应坐标显示文字
    # x, y: 横纵坐标  s: 显示文字
    plt.text(x=x0, y=y1, s=y1, ha='center', va='bottom', fontsize=11)
    plt.text(x=x0, y=y2, s=y2, ha='center', va='bottom', fontsize=11)

# 显示标签
plt.legend()
# plt.legend(['软件研发', '产品经理'])

# 是否加上网格
plt.grid(False)

# 对空白区域进行自动填充
plt.tight_layout()

# 保存图像
# plt.savefig('e_plot.png')

# 展示图片
plt.show()
折线图效果:


