Mermaid 绘图总结
简介
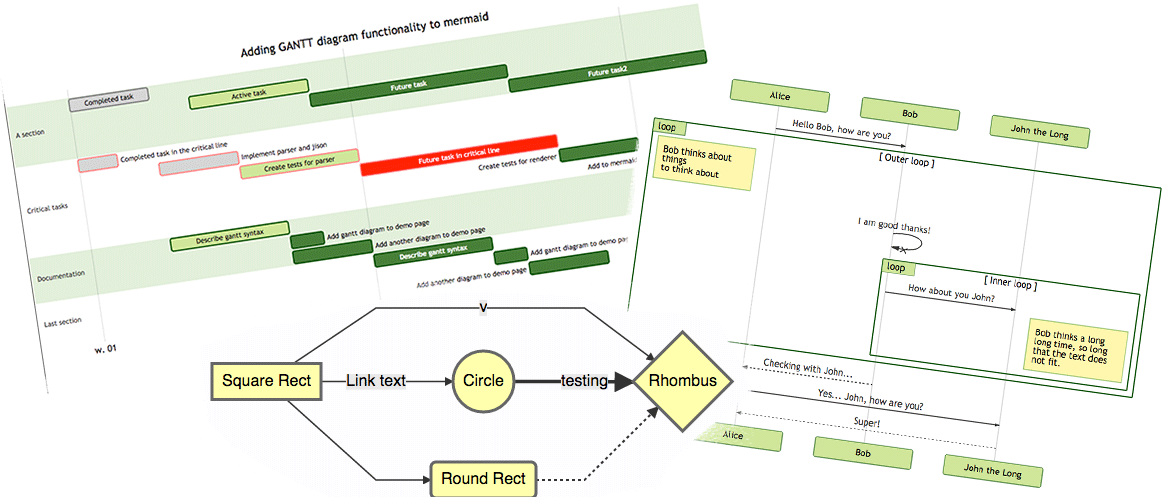
Mermaid 是一个用于画流程图、状态图、时序图、甘特图的库,使用 JS 进行本地渲染,广泛集成于许多 Markdown 编辑器中。
Mermaid 作为一个使用 JS 渲染的库,生成的不是一个“图片”,而是一段 HTML 代码,因此安全许多。
官网:https://mermaidjs.github.io/
Github 项目地址:https://github.com/knsv/mermaid
参考:
参考:
https://blog.csdn.net/lis_12/article/details/80693975
https://www.cnblogs.com/wuyida/p/6301240.html
https://blog.csdn.net/fenghuizhidao/article/details/79440583
    ```mermaid
	   graph LR
	   A[方形] -->B(圆角)
	   B --> C{条件a}
	   C -->|a=1| D[结果1]
	   C -->|a=2| E[结果2]
	   F[横向流程图]
	```
1. graph(流程图)
- 节点名不能与关键字同名
- 使用引号可以避免一些不必要的麻烦,如避免与关键字同名
关键字graph表示一个流程图的开始,同时需要指定该图的方向
1.1 图的方向
TB,从上到下
TD,从上到下
BT,从下到上
RL,从右到左
LR,从左到右

T = TOP,B = BOTTOM,L = LEFT,R = RIGHT,D = DOWN
例如:
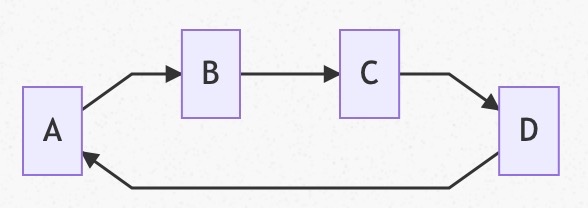
    ```mermaid
        graph LR;
        A-->B
        B-->C
        C-->D
        D-->A
    ```
1.2 节点形状
默认节点 A
文本节点 B[bname]
圆角节点 C(cname)
圆形节点 D((dname))
非对称节点 E>ename]
菱形节点 F{fname}

A~F 是当前节点名字,类似于变量名,画图时便于引用
[b~f]name是节点中显示的文字,默认节点的名字和显示的文字都为A
例如:
    ```
        graph TB
         A
         B[bname]
        C(cname)
        D((dname))
        E>ename]
        F{fname}
    ```

1.3 连线
节点间的连接线有多种形状,可以在连接线中加入标签:
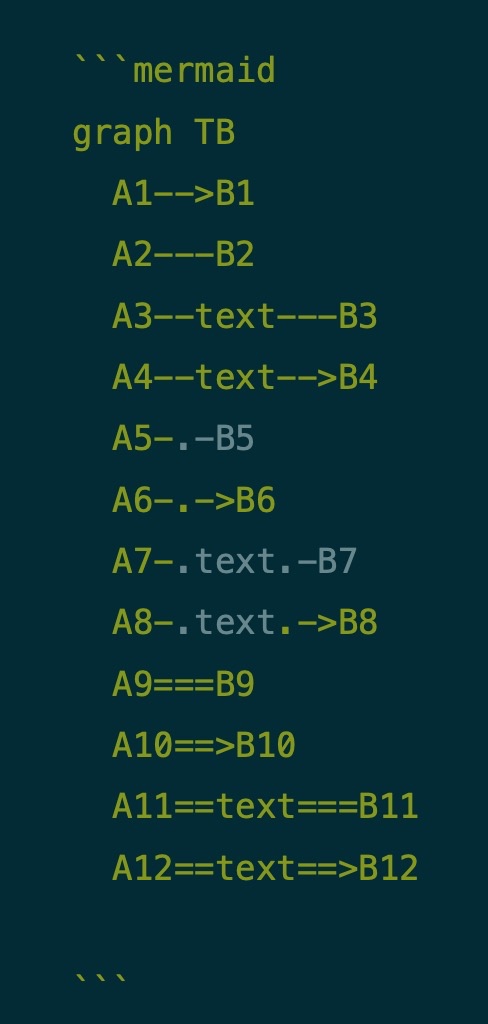
箭头连接 A1–->B1
开放连接 A2—B2
标签连接 A3–text—B3
箭头标签连接 A4–text–>B4
虚线开放连接 A5.-B5
虚线箭头连接 A6-.->B6
标签虚线连接 A7-.text.-B7
标签虚线箭头连接 A8-.text.->B8
粗线开放连接 A9===B9
粗线箭头连接 A10==>B10
标签粗线开放连接 A11==text===B11
标签粗线箭头连接 A12==text==>B12
例如:
graph TB
  A1-->B1
  A2---B2
  A3--text---B3
  A4--text-->B4
  A5-.-B5
  A6-.->B6
  A7-.text.-B7
  A8-.text.->B8
  A9===B9
  A10==>B10
  A11==text===B11
  A12==text==>B12

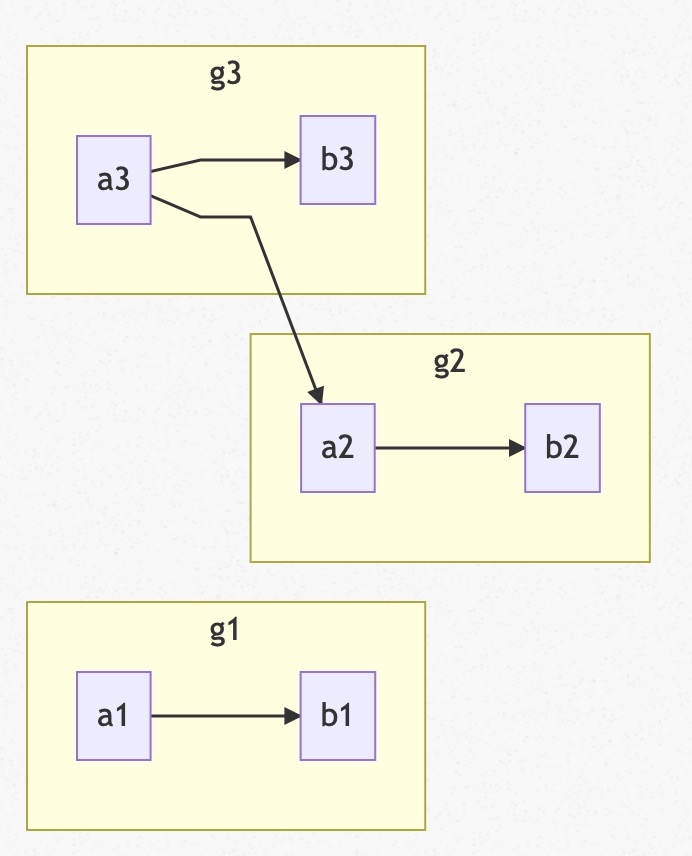
2. subgraph(子图)
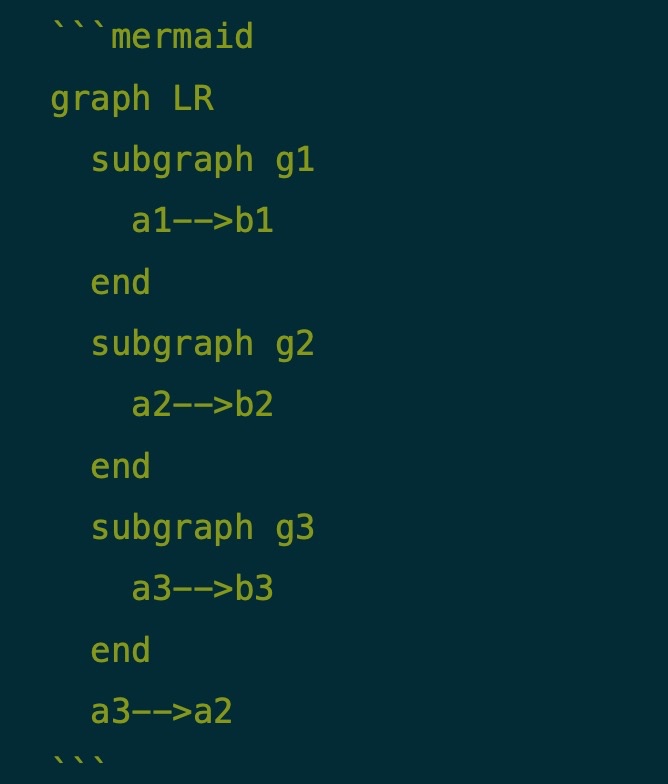
# 外面的那层, 可以使用子图中的节点,子图中的节点名不是隔离的,可以认为是全局变量-.-
graph LR
  subgraph title1
    graph definition
  end
  subgraph title2
    graph definition
  end
  ...
例如:
3. sequence diagram (序列图)
3.1 关键字 - participant
参与者,相当先定义模块,可通过设定参与者(participant)的顺序控制展示顺序
3.2 关键字 - note
便签
格式:
note [right of | left of][Actor]:Text

# 给多个模块做标签, 通过逗号分割

note over [Actor1, Actor2...]:Text
3.3 关键字 - 循环
例如:
loop Loop_text
... statements...
end
3.4 关键字 - 选择
例如:
alt Describing_text
...statements...
else
...statements...
end

# 推荐在没有else的情况下使用 opt(option,选择)

opt Describing_text
...statements...
end
3.5 示例
sequenceDiagram
  Alice->>Bob: Hello Bob, how are you?
  alt is sick
    Bob->>Alice:not so good :(
  else is well
    Bob->>Alice:good
  end
  opt Extra response
    Bob->>Alice:Thanks for asking
  end
3.6 连线
无箭头实线 ->
有箭头实线 ->>
无箭头虚线 –>
有箭头虚线 –>>
带x实线 -x
带x虚线 –x
例如:
sequenceDiagram
  Note right of A: 倒霉, 碰到B了
  A->B:   Hello B, how are you ?
  note left of B: 倒霉,碰到A了
  B-->A:  Fine, thx, and you?
  note over A,B: 快点溜,太麻烦了
  A->>B:  I'm fine too.
  note left of B: 快点打发了A
  B-->>A: Great!
  note right of A: 溜之大吉
  A-xB:   Wait a moment
  loop Look B every minute
   A->>B: look B, go?
  B->>A: let me go?
 end
 B--xA: I'm off, byte
  note right of A: 太好了, 他走了
改变AB的顺序
sequenceDiagram
  # 通过设定参与者(participant)的顺序控制展示顺序
  participant B
  participant A
   Note right of A: 倒霉, 碰到B了
  A->B:   Hello B, how are you ?
  note left of B: 倒霉,碰到A了
  B-->A:  Fine, thx, and you?
  note over A,B:快点溜,太麻烦了。。。
  A->>B:  I'm fine too.
  note left of B: 快点打发了A
  B-->>A: Great!
  note right of A: 溜之大吉
  A-xB:   Wait a moment
  loop Look B every minute
   A->>B: look B, go?
  B->>A: let me go?
 end
 B--xA: I'm off, byte
  note right of A: 太好了, 他走了
示例2:
sequenceDiagram
  # 通过设定参与者(participants)的顺序控制展示模块顺序
  participant Alice
 participant Bob
 participant John
 Alice->John:Hello John, how are you?
 loop Healthcheck
   John->John:Fight against hypochondria
 end
 Note right of John:Rational thoughts <br/>prevail...
 John-->Alice:Great!
 John->Bob: How about you?
 Bob-->John: good!
4. gantt diagram(甘特图)
甘特图是一类条形图,由Karol Adamiechi在1896年提出, 而在1910年Henry Gantt也独立的提出了此种图形表示。通常用在对项目终端元素和总结元素的开始及完成时间进行的描述
关键字
title     | 	标题
----------|-------
dateFormat	|日期格式
section	   |模块
Completed	| 已经完成
Active	   | 当前正在进行
Future	   | 后续待处理
crit	      | 关键阶段
日期缺失    |	默认从上一项完成后
例如1:
gantt
dateFormat YYYY-MM-DD
section S1
T1: 2014-01-01, 9d
section S2
T2: 2014-01-11, 9d
section S3
T3: 2014-01-02, 9d
例如2:
gantt
    dateFormat  YYYY-MM-DD
    title Adding GANTT diagram functionality to mermaid

    section A section
    Completed task            :done,    des1, 2014-01-06,2014-01-08
    Active task               :active,  des2, 2014-01-09, 3d
    Future task               :         des3, after des2, 5d
    Future task2               :         des4, after des3, 5d

    section Critical tasks
    Completed task in the critical line :crit, done, 2014-01-06,24h
    Implement parser and jison          :crit, done, after des1, 2d
    Create tests for parser             :crit, active, 3d
    Future task in critical line        :crit, 5d
    Create tests for renderer           :2d
    Add to mermaid                      :1d

    section Documentation
    Describe gantt syntax               :active, a1, after des1, 3d
    Add gantt diagram to demo page      :after a1  , 20h
    Add another diagram to demo page    :doc1, after a1  , 48h

    section Last section
    Describe gantt syntax               :after doc1, 3d
    Add gantt diagram to demo page      : 20h
    Add another diagram to demo page    : 48h
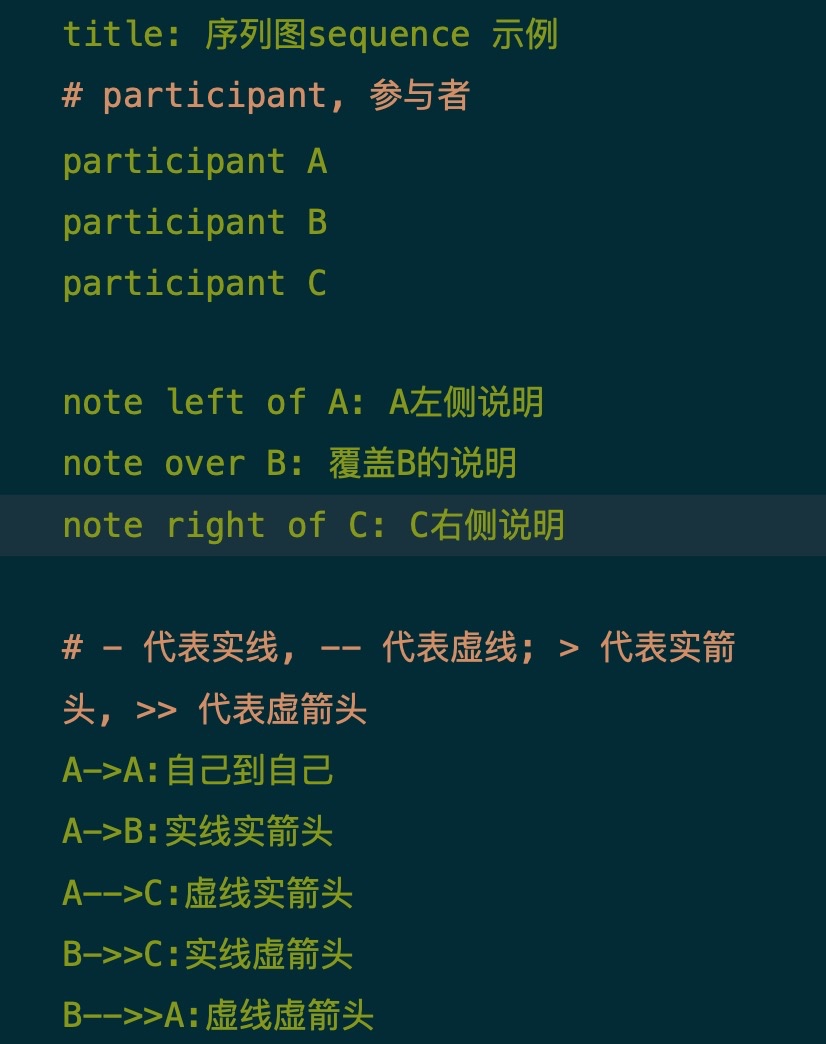
5. sequence(序列图)
关键字:
title,定义序列图的标题
participant,定义时序图中的对象
note,定义对时序图中的部分说明
方位控制
left of,表示当前对象的左侧
right of,表示当前对象的右侧
over,表示覆盖在当前对象(们)的上面
{actor},表示时序图中的具体对象(名称自定义)
箭头分为以下几种:
-> 表示实线实箭头
–> 表示虚线实箭头
->> 表示实线虚箭头
–>> 表示虚线虚箭头
例如:
例如2:
A->B: 吃饭了没?
# 可在文本中使用换行符\n
note right of B: B思考n秒\n如何回答
B--A: 吃过了。你咧?
A->>B: 吃过了,吃过了!
6. flow(流程图)
start/end,表示程序的开始与结束
operation,表示程序的处理块
subroutine,表示子程序块
condition,表示程序的条件判断
inputoutput,表示程序的出入输出
right/left,表示当前连线在当前模块上的起点(默认从下端开始)
yes/no, 表示condition判断的分支(可以和right,left同时使用)
通过定义模块与连接,再结合以上关键词即可定义简单流程图的各个模块。
模块定义(模块标识与模块名称可以任意定义名称,但是不能为关键词):
模块标识(相当于变量名)=>模块关键词: 模块名称(模块中显示的文字)
连接定义如下:
模块标识1->模块标识2
模块标识1->模块标识2->模块标识3
...
进行连接的时候,可以通过right,left确定箭头的起点。
使用condition关键词定义的判断框的连接需要结合yes或者no使用,如
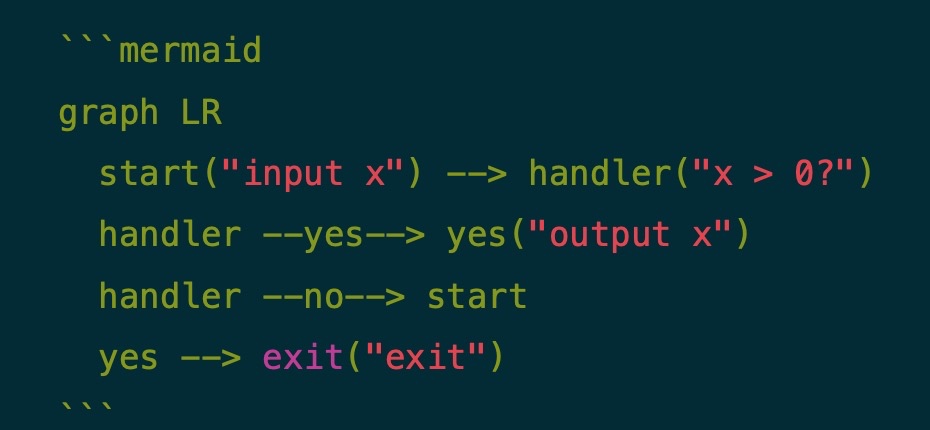
cond1=>condition: x>0?
cond1(yes)->module1
cond1(no)->moudle2
指定方向,如果后面占用了这个方向, 前面的无效
cond1(yes,right)->module1
cond1(no)->moudle2
先自定义变量,然后画图
st=>start: 开始
e=>end: 结束
op=>operation: 输入x
sub=>subroutine: 是否重新输入
cond1=>condition: x>0?
cond2=>condition: yes/no
io=>inputoutput: 输出x

st(right)->op->cond1
cond1(yes)->io(right)->e
cond1(no)->sub(right)->cond2()
cond2(yes, right)->op
cond2(no)->e
posted on 2020-12-15 22:07 ZhangDezhi 阅读(12119) 评论(0) 编辑 收藏 举报


