

kube-prometheus(prometheus-operator)监控(四):监控SpringBoot
准备工作
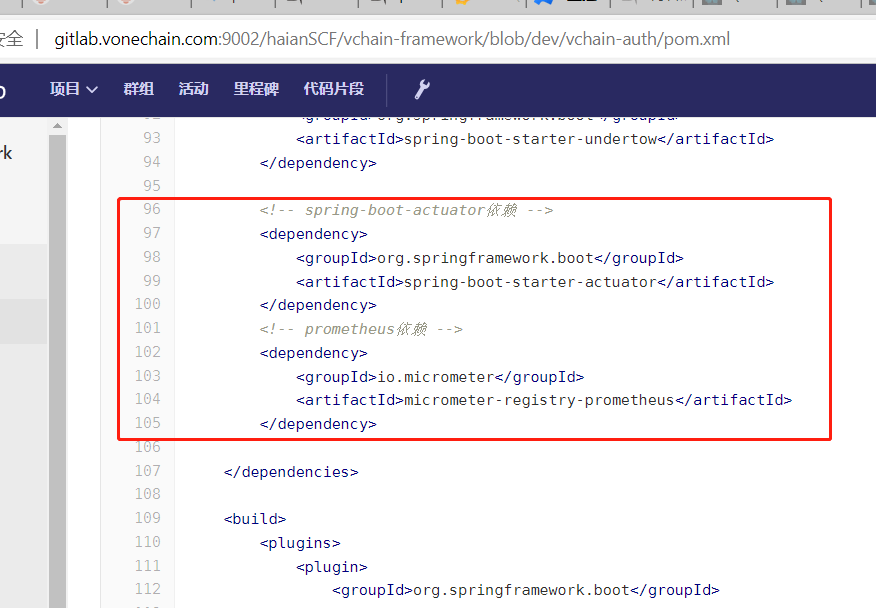
在工程的 pom 文件中添加两个依赖
文件路径:http://gitlab.vonechain.com:9002/haianSCF/vchain-framework/blob/dev/vchain-auth/pom.xml
增加的内容:
<!-- spring-boot-actuator依赖 -->
<dependency>
    <groupId>org.springframework.boot</groupId>
    <artifactId>spring-boot-starter-actuator</artifactId>
</dependency>
<!-- prometheus依赖 -->
<dependency>
    <groupId>io.micrometer</groupId>
    <artifactId>micrometer-registry-prometheus</artifactId>
</dependency>
配置位置如截图:
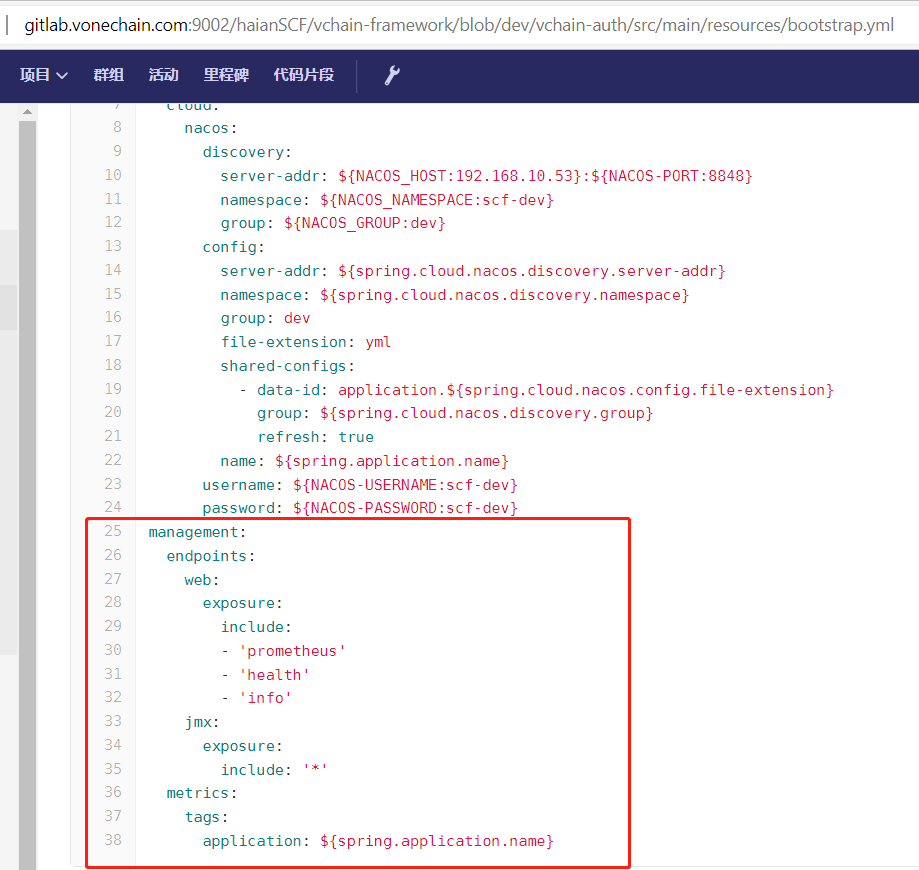
添加对外暴露监控端点指标
添加内容:
management:
  endpoints:
    web:
      exposure:
        include:
        - 'prometheus'
        - 'health'
        - 'info'
    jmx:
      exposure:
        include: '*'
  metrics:
    tags:
      application: ${spring.application.name}
位置如图
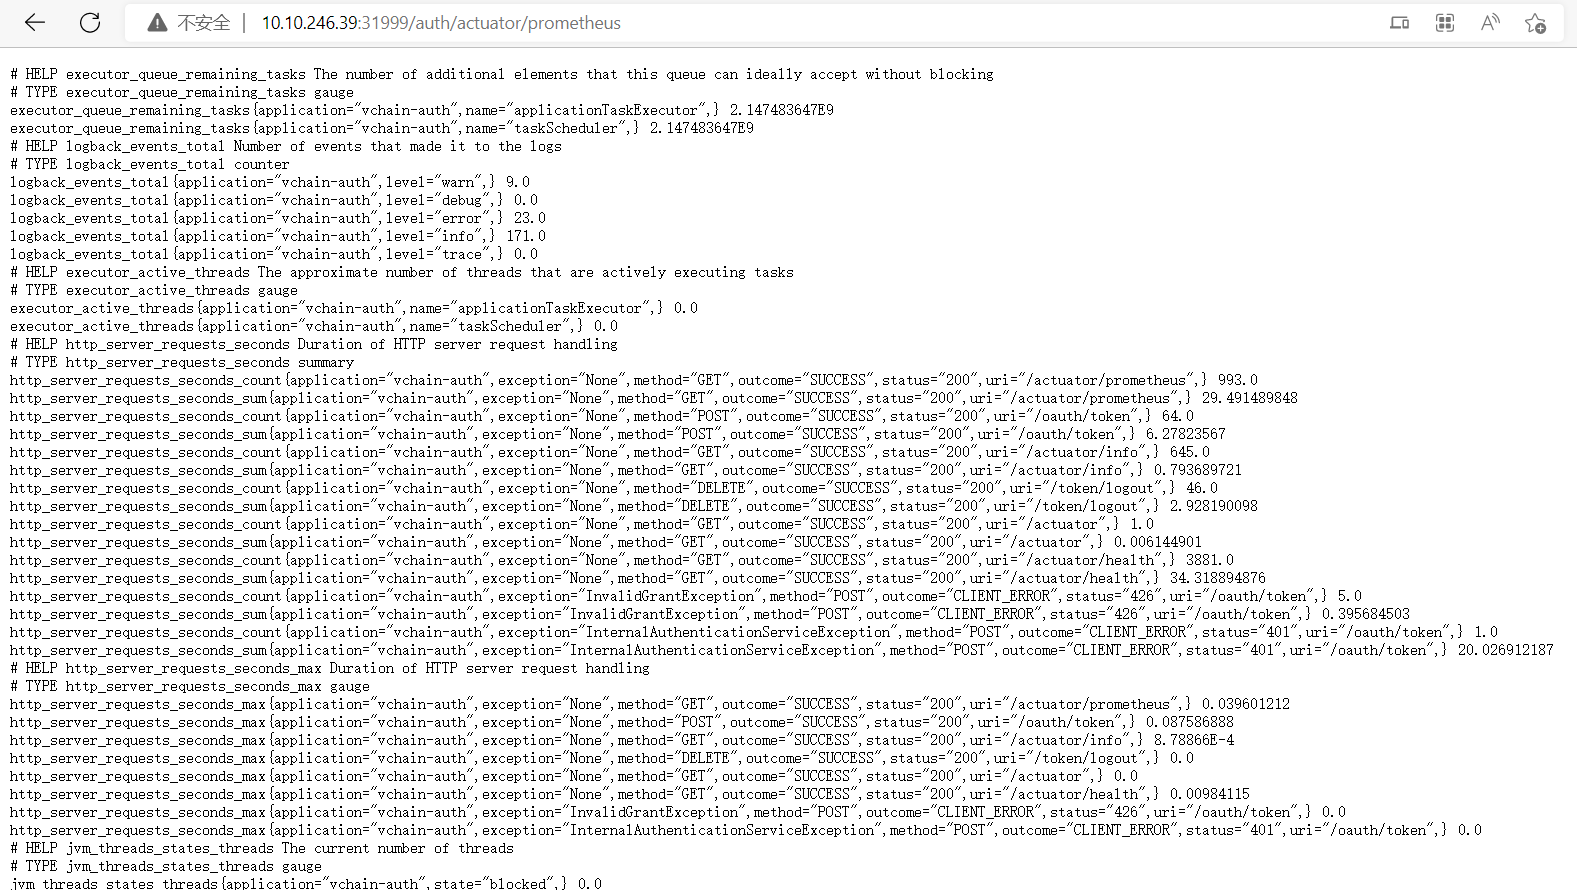
添加完成后,重新编译打包,部署。部署完成后,ip:端口/actuator/prometheus 可以查看到监控数据。
我们微服务因走了gateway网关路由,所以地址为:http://网关ip:网关端口/路由服务名称/actuator/prometheus
http://10.10.246.39:31999/auth/actuator/prometheus
添加vchain-auth-Service
# cat vchain-authService.yaml
apiVersion: v1
kind: Service
metadata:
  labels:
    app: vchain-auth
    project: haian
  name: vchain-auth
  namespace: kube-system
spec:
  type: ClusterIP
  ports:
  - name: http
    port: 31999
    protocol: TCP
    targetPort: 31999
---
apiVersion: v1
kind: Endpoints
metadata:
  labels:
    app: vchain-auth
    project: haian
  name: vchain-auth
  namespace: kube-system
subsets:
- addresses:
  - ip: 10.10.246.39
  ports:
  - name: http
    port: 31999
    protocol: TCP
启动:kubectl create -f vchain-authService.yaml
添加serviceMonitor-vchain-auth
# cat prometheus-serviceMonitor-vchain-auth.yaml
apiVersion: monitoring.coreos.com/v1
kind: ServiceMonitor
metadata:
  labels:
    app: vchain-auth
  name: vchain-auth
  namespace: monitoring
spec:
  endpoints:
  - interval: 30s
    path: /auth/actuator/prometheus
    port: http
  jobLabel: app
  namespaceSelector:
    matchNames:
    - kube-system
  selector:
    matchLabels:
      app: vchain-auth
启动:kubectl create -f prometheus-serviceMonitor-vchain-auth.yaml
检查:
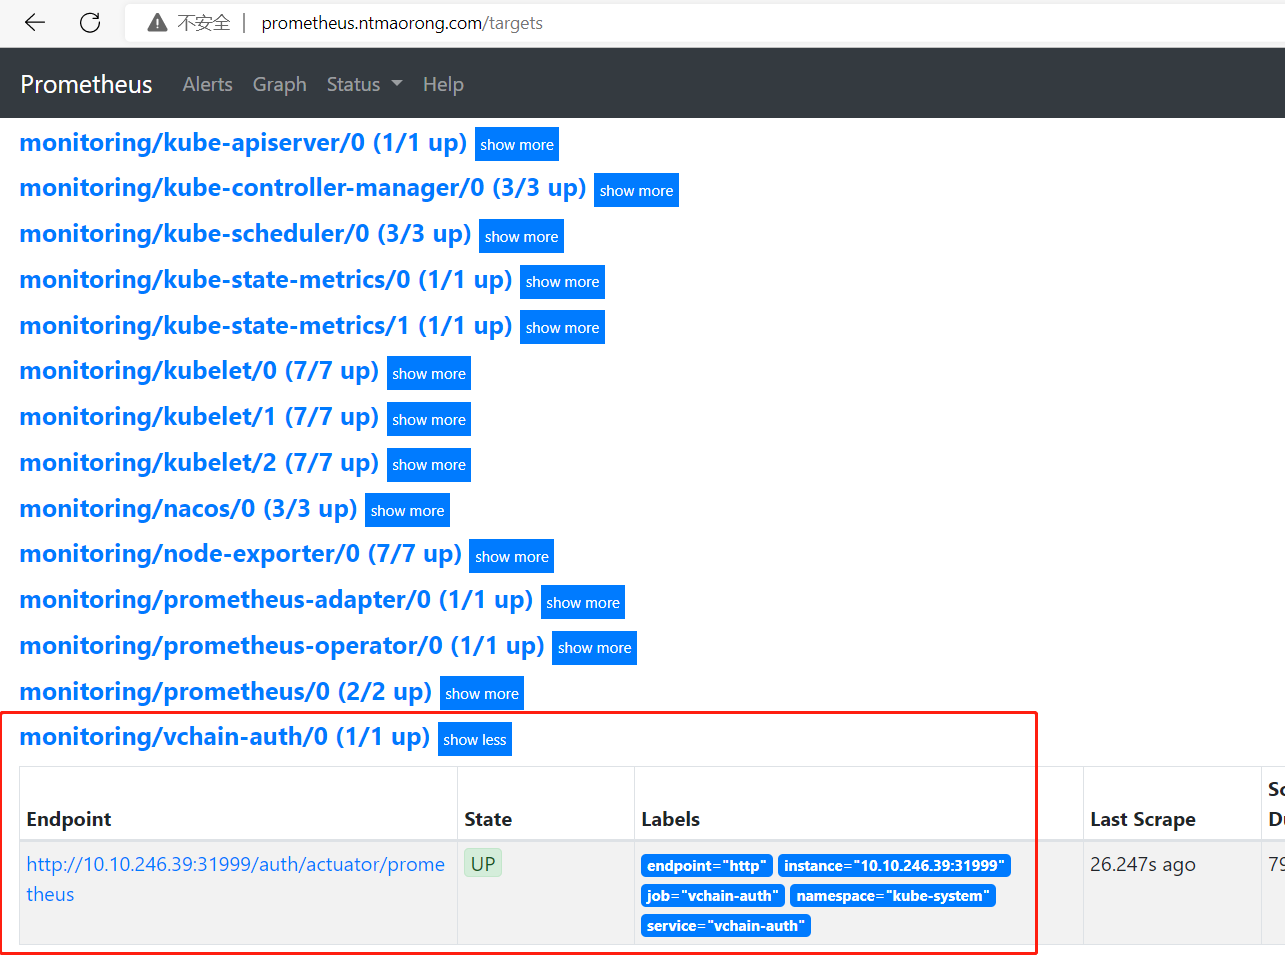
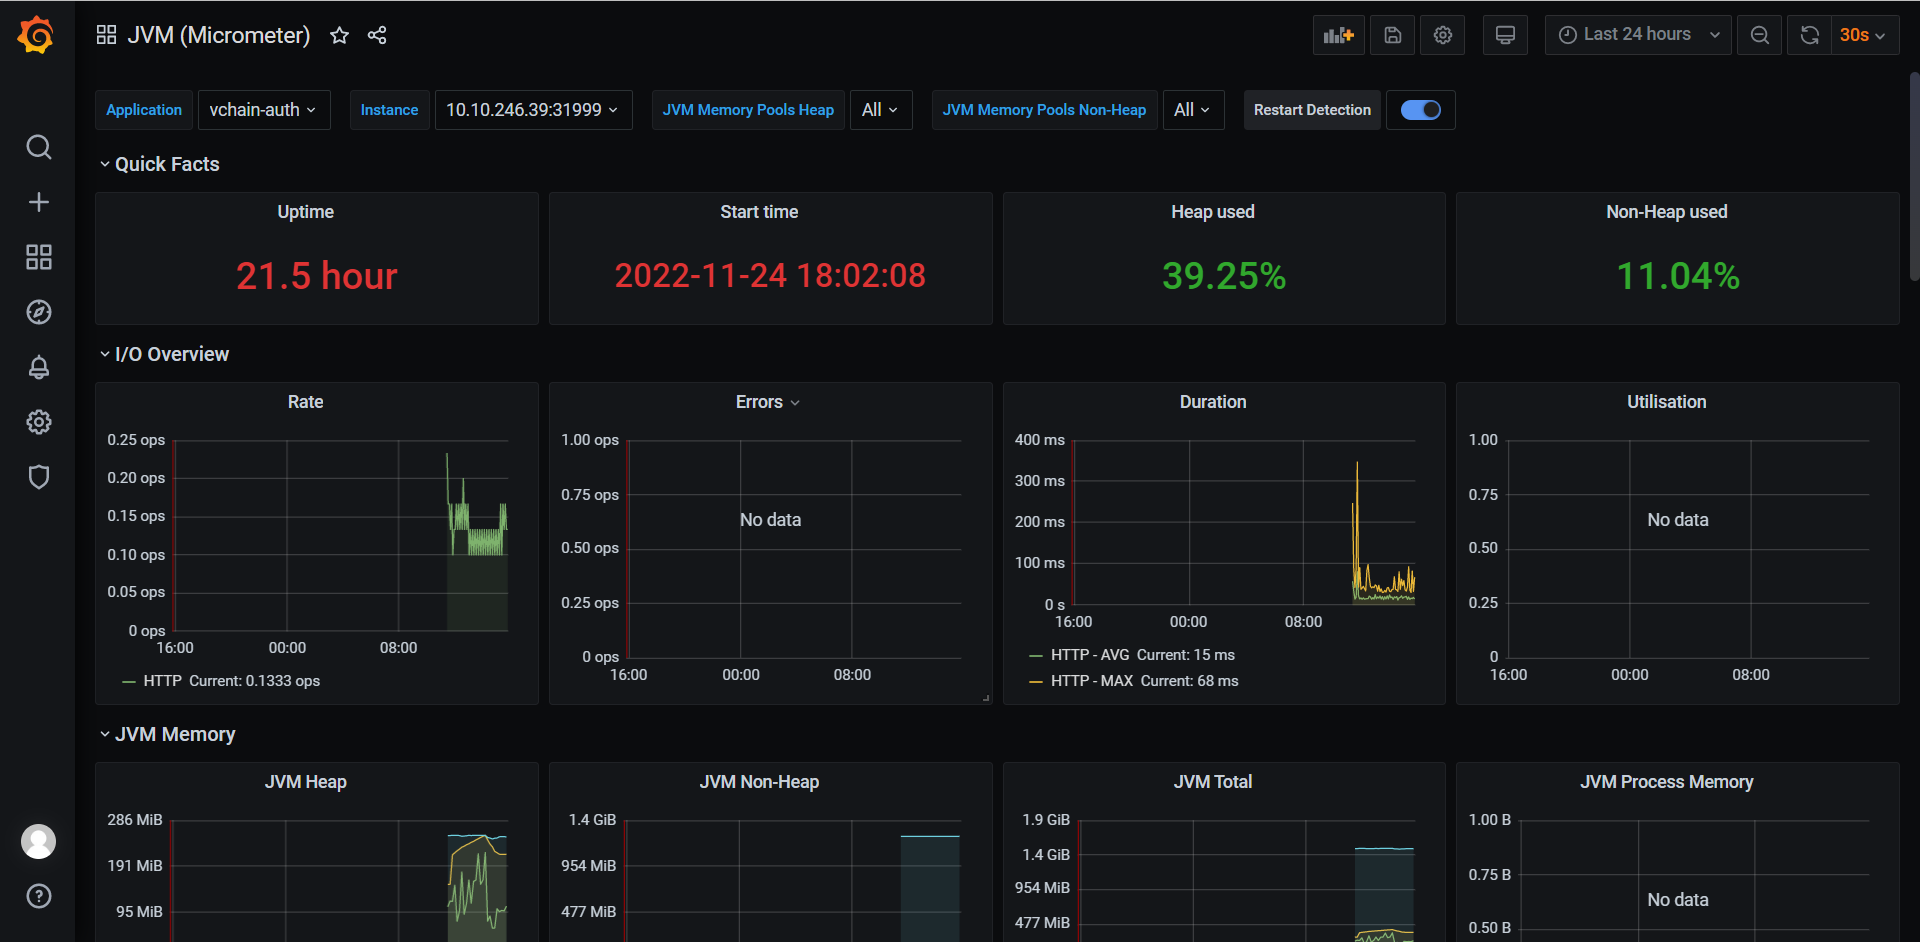
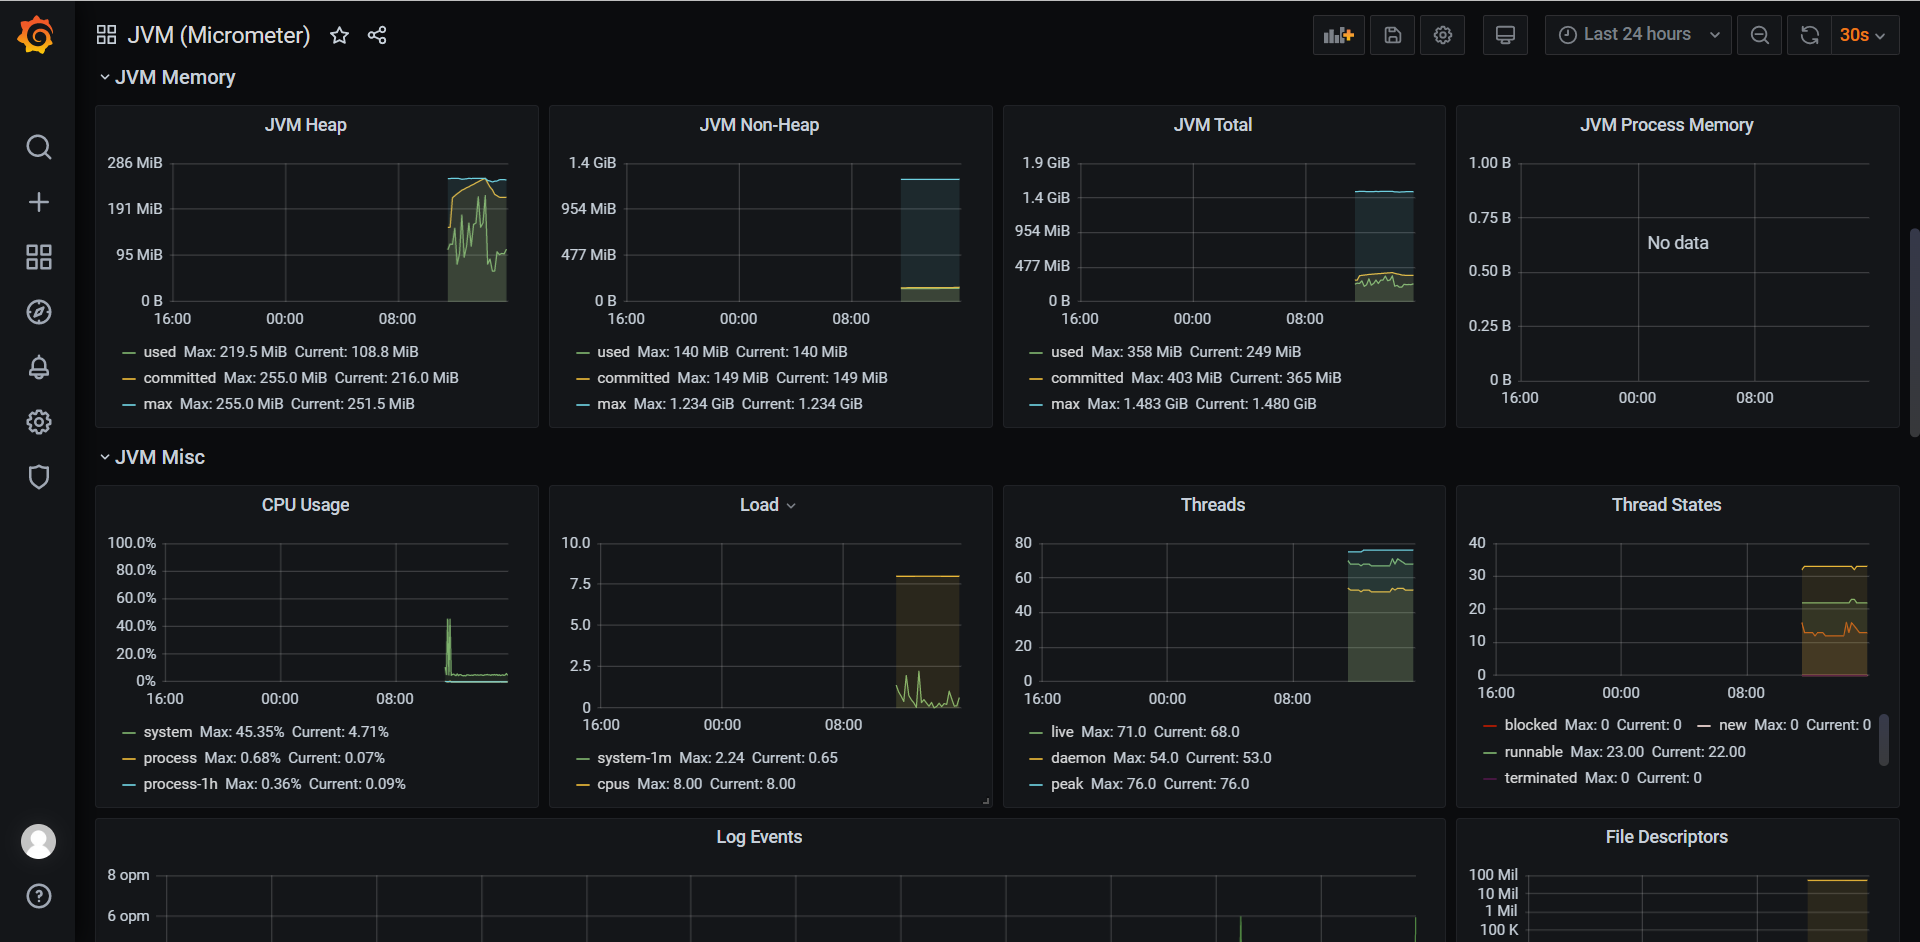
配置grafana
在官方网站找到https://grafana.com/grafana/dashboards/4701-jvm-micrometer/
导入:4701
分类:
监控


【推荐】国内首个AI IDE,深度理解中文开发场景,立即下载体验Trae
【推荐】编程新体验,更懂你的AI,立即体验豆包MarsCode编程助手
【推荐】抖音旗下AI助手豆包,你的智能百科全书,全免费不限次数
【推荐】轻量又高性能的 SSH 工具 IShell:AI 加持,快人一步
· winform 绘制太阳,地球,月球 运作规律
· AI与.NET技术实操系列(五):向量存储与相似性搜索在 .NET 中的实现
· 超详细:普通电脑也行Windows部署deepseek R1训练数据并当服务器共享给他人
· 【硬核科普】Trae如何「偷看」你的代码?零基础破解AI编程运行原理
· 上周热点回顾(3.3-3.9)