

kube-prometheus(prometheus-operator)监控(三):监控Nacos集群
背景说明
- kube-prometheus监控部署参考
- nacos集群说明
10.10.246.33:8848;10.10.246.34:8848;10.10.246.35:8848
二进制部署,配置目录为/data/nacos/conf
步骤简介
- nacos开启prometheus监控配置
- 添加Nacos的Service和Endpoints
- 添加ServiceMonitor
- 关联prometheus与ServiceMonitor
- 配置grafana
nacos开启prometheus监控配置
nacos集群3个节点都需要执行:
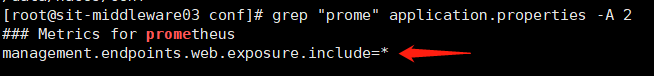
配置文件application.properties
management.endpoints.web.exposure.include=*
重启nacos
systemctl restart nacos.service
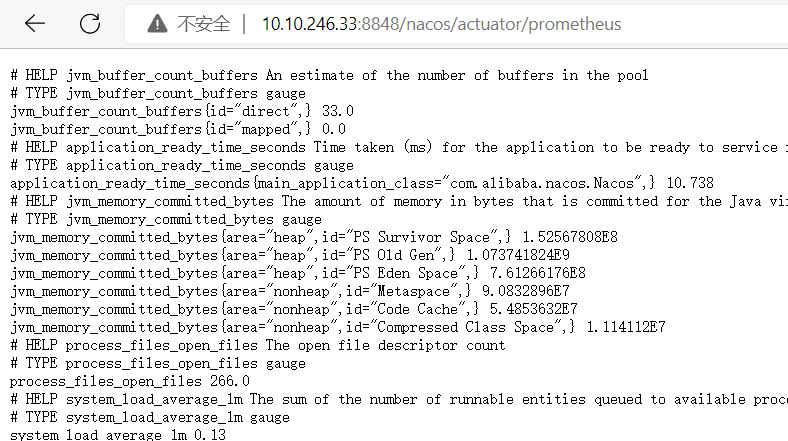
检查
http://10.10.246.33:8848/nacos/actuator/prometheus
可以看到数据指标:
添加Nacos的Service和Endpoints
增加文件:prometheus-NacosService.yaml
apiVersion: v1
kind: Service
metadata:
  labels:
    app: nacos   #标签
  name: nacos
  namespace: kube-system #命名空间
spec:
  type: ClusterIP
  ports:
  - name: http-nacos   #端口名称
    port: 8848
    protocol: TCP
    targetPort: 8848
---
apiVersion: v1
kind: Endpoints
metadata:
  labels:
    app: nacos  #标签
  name: nacos
  namespace: kube-system  #命名空间
subsets:
- addresses:   #集群地址
  - ip: 10.10.246.35
  - ip: 10.10.246.34
  - ip: 10.10.246.33
  ports:
  - name: http-nacos  #端口名称
    port: 8848       #端口
    protocol: TCP
启动:
kubectl create -f prometheus-NacosService.yaml
添加ServiceMonitor
增加文件:prometheus-serviceMonitorNacos.yaml
apiVersion: monitoring.coreos.com/v1
kind: ServiceMonitor
metadata:
  labels:
    app: nacos  #标签
  name: nacos
  namespace: monitoring  #监控的命名空间
spec:
  endpoints:
  - interval: 30s
    path: /nacos/actuator/prometheus    #nacos监控数据指标地址
    port: http-nacos    #端口名称,与svc中一致
  jobLabel: app    #标签,与svc中一致
  namespaceSelector:
    matchNames:
    - kube-system    #命名空间,与svc中一致
  selector:
    matchLabels:
      app: nacos    #选择的标签,与svc中一致
启动:
kubectl create -f prometheus-serviceMonitorNacos.yaml
关联prometheus与ServiceMonitor
这里说明下,若标签是k8s-app,则不需要作此操作,因为kube-prometheus默认将此标签的服务都已经加入关联了。我们按照常规服务,service的lable不一定是k8s-app标签的,所以增加了此步说明。
修改文件/data/kube-prometheus/manifests/prometheus-prometheus.yaml
apiVersion: monitoring.coreos.com/v1
kind: Prometheus
metadata:
  labels:
    prometheus: k8s
  name: k8s
  namespace: monitoring
spec:
##增加关联的serviceMonitor
  serviceMonitorSelector:
    matchLabels:
      app: nacos    #注意标签要与serviceMonitor、svc中都一致
##增加配置结束
  alerting:
    alertmanagers:
    - name: alertmanager-main
      namespace: monitoring
      port: web
重新加载配置:
kubectl replace -f prometheus-prometheus.yaml
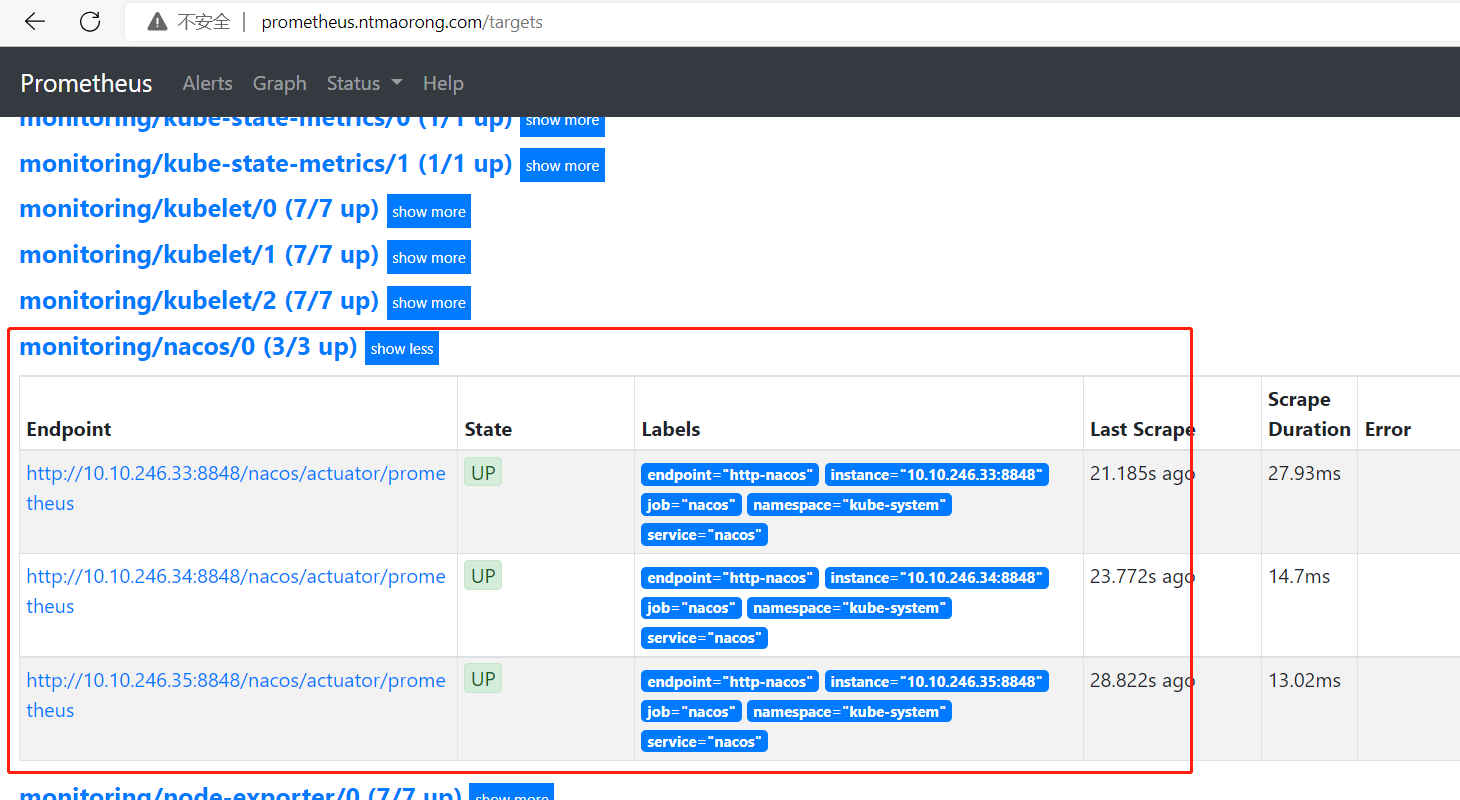
检查prometheus采集的nacos
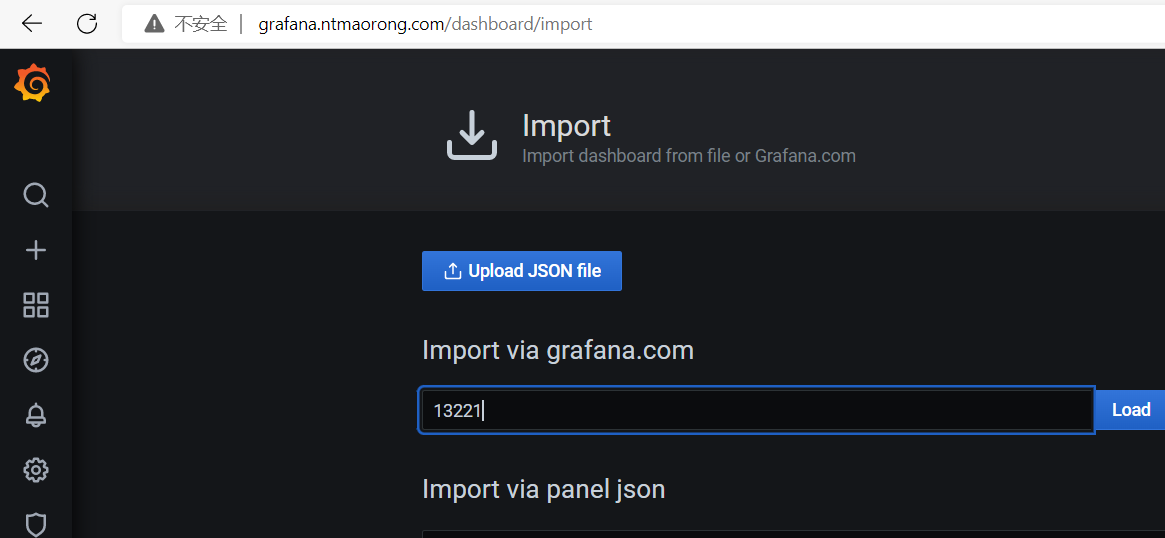
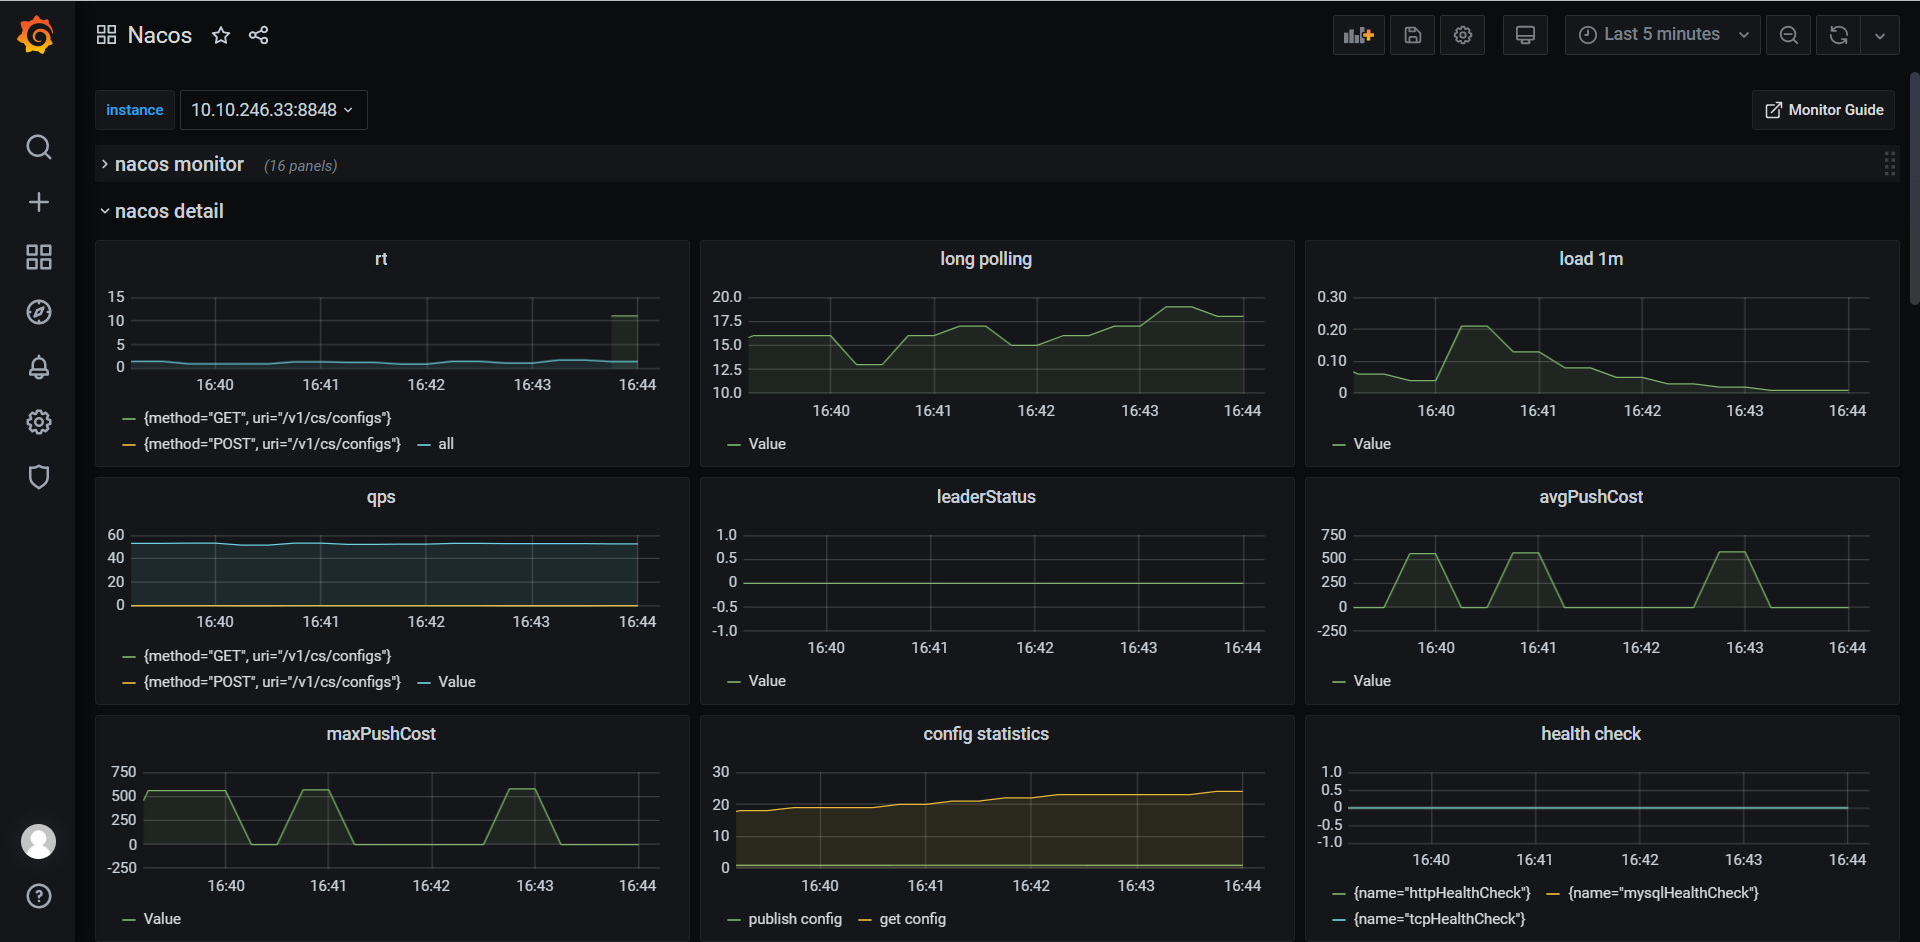
grafana上添加nacos监控面板
13221
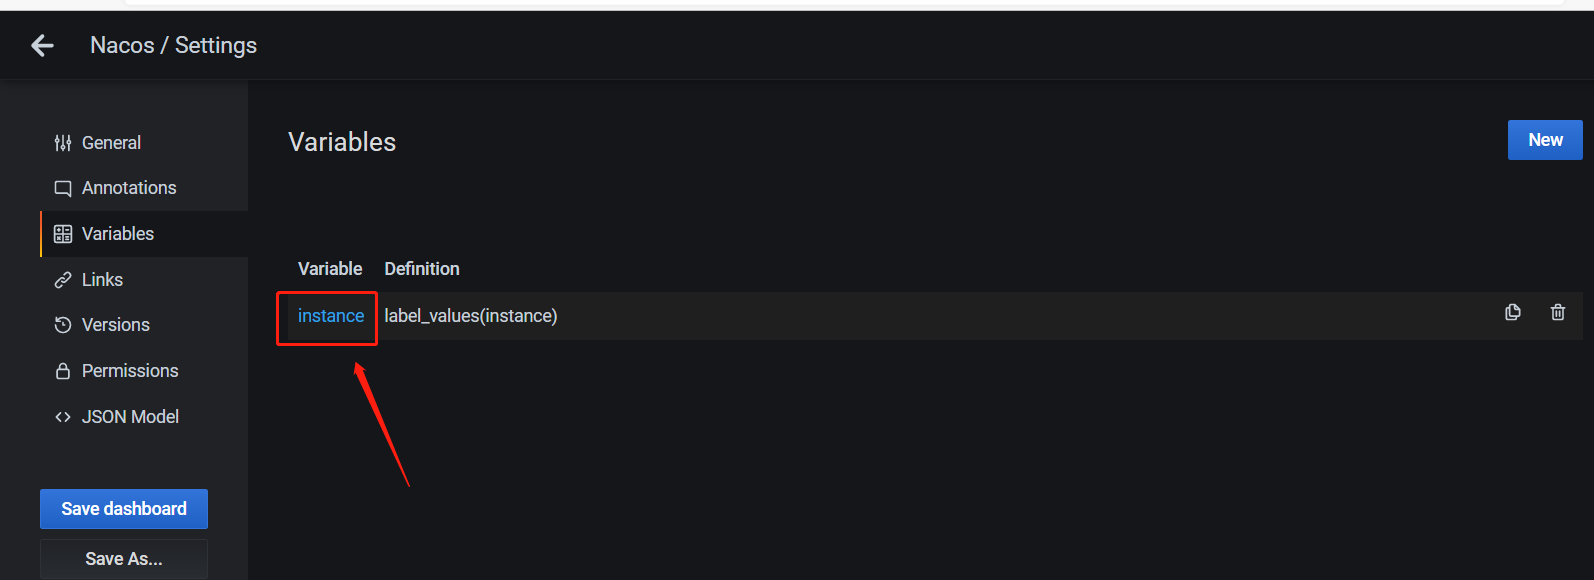
更新变量:
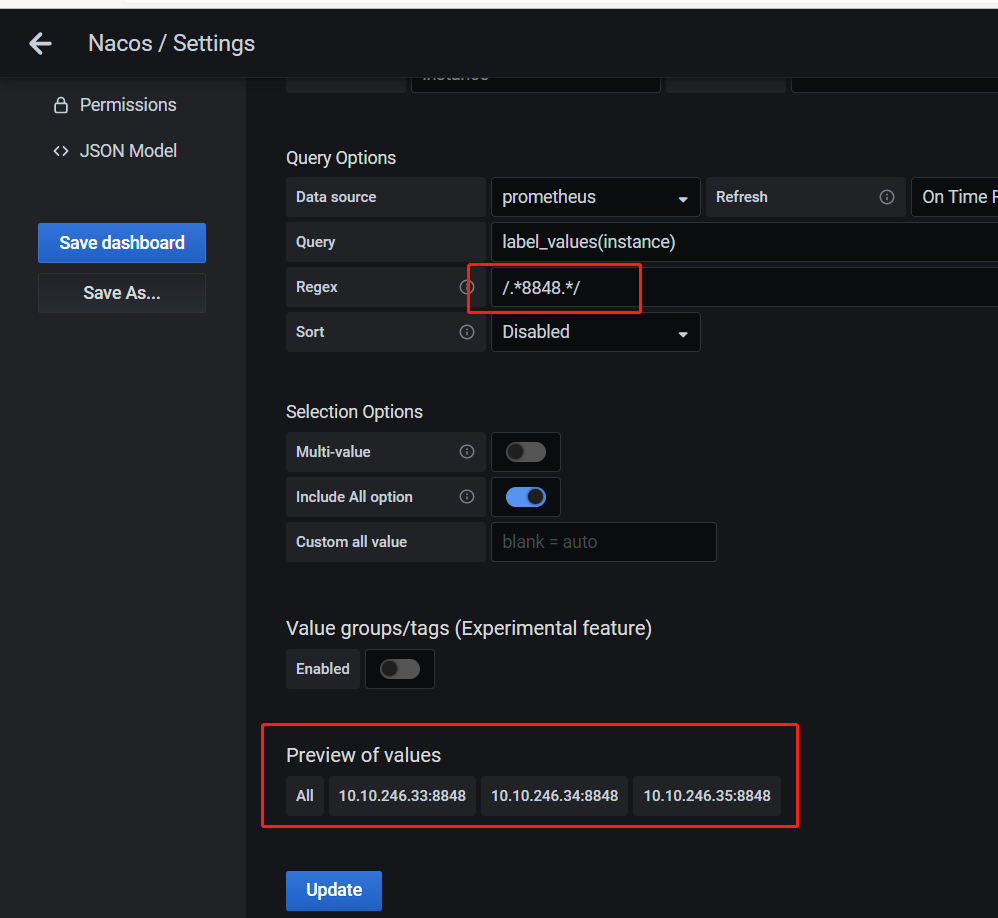
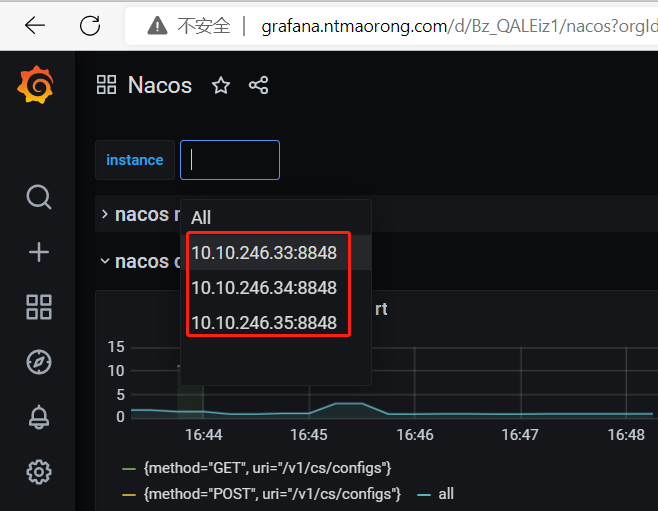
更新后,则查出来的只有nacos的端口:


【推荐】国内首个AI IDE,深度理解中文开发场景,立即下载体验Trae
【推荐】编程新体验,更懂你的AI,立即体验豆包MarsCode编程助手
【推荐】抖音旗下AI助手豆包,你的智能百科全书,全免费不限次数
【推荐】轻量又高性能的 SSH 工具 IShell:AI 加持,快人一步
· winform 绘制太阳,地球,月球 运作规律
· AI与.NET技术实操系列(五):向量存储与相似性搜索在 .NET 中的实现
· 超详细:普通电脑也行Windows部署deepseek R1训练数据并当服务器共享给他人
· 【硬核科普】Trae如何「偷看」你的代码?零基础破解AI编程运行原理
· 上周热点回顾(3.3-3.9)