可视化监控微服务 Hystrix Dashboard、Turbine stream
可视化监控微服务
一、使用 Hystrix Dashboard 监控单个微服务
1、添加依赖
<dependency>
      <groupId>org.springframework.cloud</groupId>
      <artifactId>spring-cloud-starter-netflix-hystrix-dashboard</artifactId>
</dependency>
2、配置 application.yml
hystrix:
  dashboard:
    proxy-stream-allow-list: "*"
3、开启 @EnableHystrixDashboard 注解
4、运行 application,然后打开相应url,查看微服务运行信息。
注:被监控的微服务需在 actuator 上暴露 hystrix.stream 接口
二、使用 Turbine 聚合监控数据
1、假设已经创建好了两个以上的 Hystrix 项目,并且在 actuator 中暴露了 hystrix.stream 接口
2、创建 turbine 项目
3、加入依赖
<dependency>
	<groupId>org.springframework.cloud</groupId>
	<artifactId>spring-cloud-starter-netflix-eureka-client</artifactId>
</dependency>
<dependency>
	<groupId>org.springframework.boot</groupId>
	<artifactId>spring-boot-starter-actuator</artifactId>
</dependency>
<dependency>
	<groupId>org.springframework.boot</groupId>
	<artifactId>spring-boot-starter-web</artifactId>
</dependency>
<dependency>
	<groupId>org.springframework.cloud</groupId>
	<artifactId>spring-cloud-starter-netflix-turbine</artifactId>
</dependency>
4、在启动器处开启 @EnableTurbine 注解
5、配置 application.yml
server:
  port: 8793
spring:
  application:
    name: hystrix-turbine-server
eureka:
  client:
    service-url:
      defaultZone: http://zolmk:zolmk@${client.desktop}:8761/eureka/,http://zolmk:zolmk@${client.desktop}:8762/eureka/
    register-with-eureka: true
    fetch-registry: true
  instance:
    prefer-ip-address: true
turbine:
  app-config: user-register-server			# 这里是需要进行聚合监控的微服务名称
  cluster-name-expression: "'default'"

client:
  desktop: 192.168.1.7
  notebook: eureka-node-a
6、启动该 application,通过 hystrix dashboard 访问 http://localhost:8793/turbine.stream 即可看到监控数据
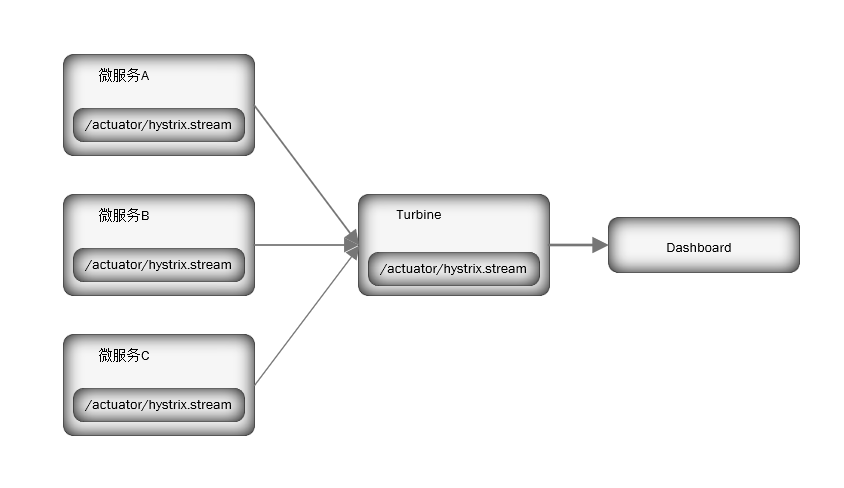
三、使用消息中间件收集数据
在一些场景下,微服务与 Turbine 网络不通,此时,可以借助消息中间件实现数据收集。各个微服务将 Hystrix Command 的监控数据发送至消息中间件,Turbine 消费消息中间件中的数据。
1、创建被监控的工程
1)、创建被监控的工程,在 pom.xml 文件中添加
<dependency>
	<groupId>org.springframework.cloud</groupId>
	<artifactId>spring-cloud-starter-netflix-hystrix</artifactId>
	<version>2.2.4.RELEASE</version>
</dependency>
<!-- hystrix stream -->
<dependency>
	<groupId>org.springframework.cloud</groupId>
	<artifactId>spring-cloud-netflix-hystrix-stream</artifactId>
	<version>2.0.4.BUILD-SNAPSHOT</version>
</dependency>
<!-- 消息中间件支持 RabbitMQ -->
<dependency>
	<groupId>org.springframework.cloud</groupId>
	<artifactId>spring-cloud-starter-stream-rabbit</artifactId>
</dependency>
2)、配置 application.yml
server:
  port: 8781
spring:
  application:
    name: user-register-server
  rabbitmq:
    host: 192.168.1.3
    password: zolmk
    username: zolmk
    port: 5672
eureka:
  client:
    service-url:
      defaultZone: http://zolmk:zolmk@${client.desktop}:8761/eureka/,http://zolmk:zolmk@${client.desktop}:8762/eureka/
    register-with-eureka: true
    fetch-registry: true
  instance:
    prefer-ip-address: true

management:
  endpoints:
    web:
      exposure:
        include: ["hystrix.stream","health"]

client:
  desktop: 192.168.1.7
  notebook: eureka-node-a
3)、假设项目已有 HystrixCommand ,也就是已完成熔断器部分。
4)、启动项目
2、创建监控 turbine-stream-server
1)、添加 pom 依赖
<dependency>
	<groupId>org.springframework.boot</groupId>
	<artifactId>spring-boot-starter-actuator</artifactId>
</dependency>
<dependency>
	<groupId>org.springframework.cloud</groupId>
	<artifactId>spring-cloud-starter-netflix-turbine-stream</artifactId>
</dependency>
<dependency>
	<groupId>org.springframework.cloud</groupId>
	<artifactId>spring-cloud-starter-stream-rabbit</artifactId>
</dependency>
2)、配置 application.yml
server:
  port: 8794
spring:
  application:
    name: hystrix-turbine-stream-server
  rabbitmq:
    port: 5672
    username: zolmk
    password: zolmk
    host: 192.168.1.3
eureka:
  client:
    service-url:
      defaultZone: http://zolmk:zolmk@${client.desktop}:8761/eureka/,http://zolmk:zolmk@${client.desktop}:8762/eureka/
    register-with-eureka: true
    fetch-registry: true
  instance:
    prefer-ip-address: true
client:
  desktop: 192.168.1.7
  notebook: eureka-node-a
3)、开启注解 @EnableTurbineStream
4)、启动 application
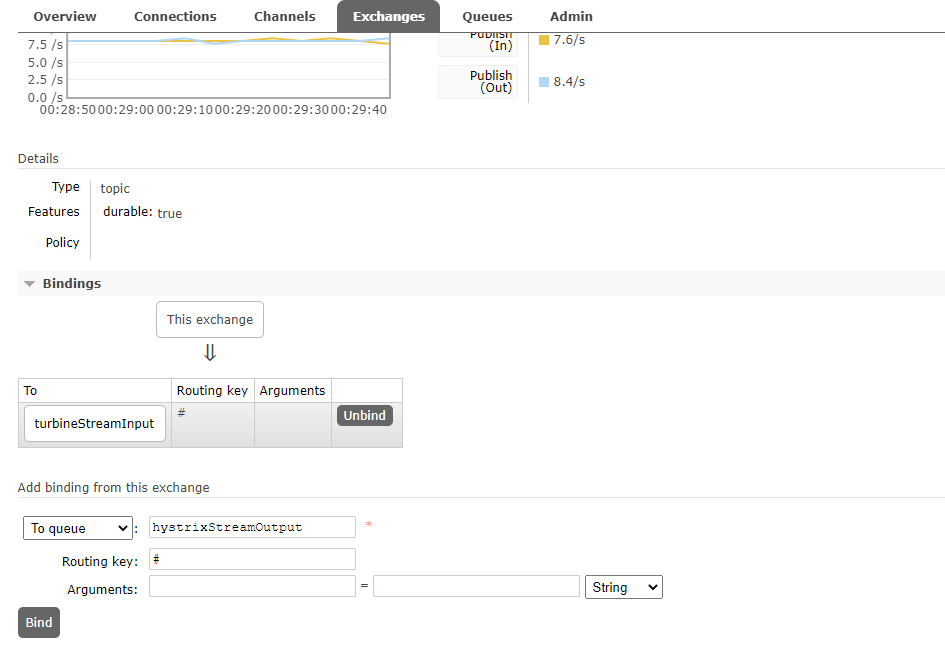
5)、需要将 hystrixStreamOutput 和 hystrixStreamOutput 两个交换器进行绑定。
绑定方法,在交换器中点击 hystrixStreamOutput ,选择 Bindings ,绑定到交换器,输入交换器名称 hystrixStreamOutput ,路由键填写 #,绑定之后就可以在 Hystrix dashboard 中看到数据了。

 浙公网安备 33010602011771号